

Key Insights
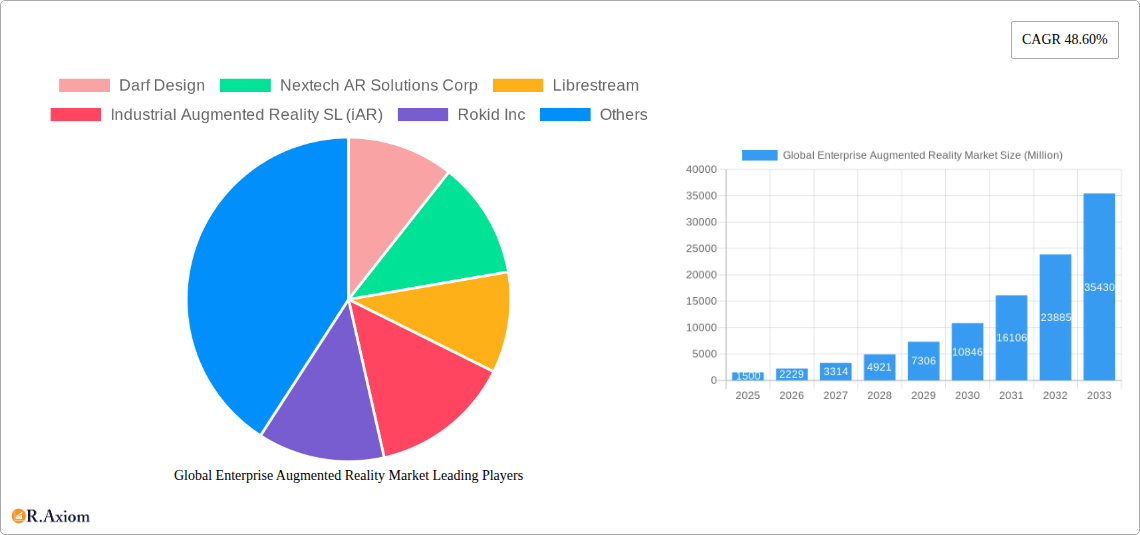
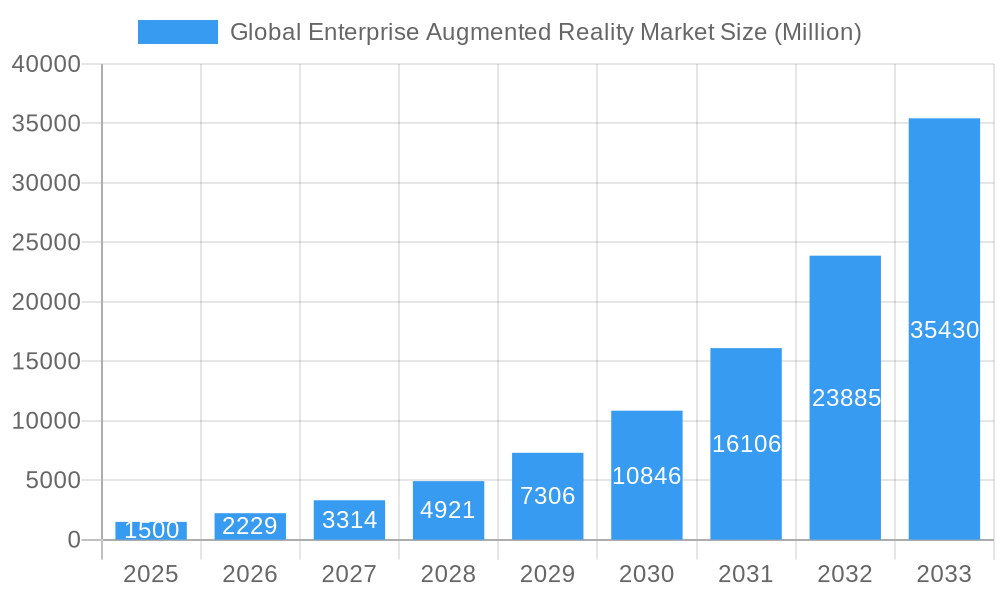
The Global Enterprise Augmented Reality (EAR) market is experiencing explosive growth, projected to reach a substantial size, driven by a remarkable Compound Annual Growth Rate (CAGR) of 48.60% from 2025 to 2033. This surge is fueled by several key factors. The increasing adoption of AR technology across diverse sectors, including retail and e-commerce for enhanced customer experiences and improved supply chain management, is a major driver. Furthermore, the educational sector's embrace of e-learning platforms incorporating AR for interactive and immersive learning experiences contributes significantly to market expansion. Industrial applications, notably in manufacturing and maintenance, leverage AR for streamlining processes, improving worker efficiency, and reducing operational costs. The automotive and aerospace industries utilize AR for design, prototyping, and training, while professional services are increasingly adopting AR for remote assistance and collaboration. Finally, the burgeoning applications in sectors such as energy, public safety, and agriculture are further expanding the market's reach. Technological advancements, including improved AR hardware and software, coupled with decreasing costs, are accelerating market penetration.
Global Enterprise Augmented Reality Market Market Size (In Billion)
However, the market also faces certain restraints. The high initial investment costs associated with implementing AR solutions can be a barrier for some businesses, particularly smaller enterprises. Concerns regarding data security and privacy, as well as the need for robust infrastructure to support AR applications, present challenges. Despite these obstacles, the long-term potential of EAR is undeniable, with its ability to transform various industries and significantly improve productivity, efficiency, and customer satisfaction. The competitive landscape is dynamic, with established players and emerging startups vying for market share. Companies such as PTC, Microsoft, and others are actively developing and deploying advanced AR solutions, driving innovation and fostering competition. The market's future growth will depend on continued technological advancements, wider adoption across industries, and the successful resolution of current challenges.
Global Enterprise Augmented Reality Market Company Market Share
Global Enterprise Augmented Reality Market Report: 2019-2033
This comprehensive report provides an in-depth analysis of the Global Enterprise Augmented Reality (AR) Market, offering valuable insights for businesses, investors, and industry stakeholders. The study period covers 2019-2033, with 2025 as the base and estimated year, and a forecast period of 2025-2033. The historical period analyzed is 2019-2024. The report encompasses market size estimations in Millions, covering various segments and key players.
Global Enterprise Augmented Reality Market Concentration & Innovation
This section analyzes the competitive landscape of the global enterprise augmented reality market, examining market concentration, innovation drivers, regulatory influences, product substitution, end-user trends, and mergers & acquisitions (M&A) activities. The market is characterized by a moderately concentrated structure, with a few major players holding significant market share. However, the presence of numerous smaller companies and startups indicates a dynamic competitive landscape.
- Market Concentration: The top five players currently hold approximately xx% of the market share (2024 data). This suggests a relatively consolidated market, although significant fragmentation exists amongst smaller players.
- Innovation Drivers: Continuous advancements in AR technology, such as improved display resolution, increased processing power, and enhanced user interfaces, are driving market innovation. The integration of AI and machine learning further propels the development of sophisticated AR applications across diverse sectors.
- Regulatory Frameworks: Government regulations concerning data privacy and security in AR applications are influencing market development. The evolving regulatory landscape impacts the adoption of AR technologies in various sectors, particularly in data-sensitive industries like healthcare and finance.
- Product Substitutes: While AR offers unique capabilities, potential substitutes include virtual reality (VR) technologies, 3D modeling software, and traditional training methods. The competitive pressure from these alternatives impacts the adoption rate of AR solutions.
- End-User Trends: Growing demand for immersive and interactive experiences across industries such as retail, manufacturing, and healthcare is driving the adoption of AR technologies. The increasing preference for remote collaboration and enhanced employee training further fuels market growth.
- M&A Activities: The AR market has witnessed several M&A activities in recent years. While specific deal values are not publicly available for all transactions, the average deal size has been estimated at approximately xx Million, reflecting the strategic importance of AR technologies for larger enterprises. Significant acquisitions have contributed to market consolidation and technological advancement.
Global Enterprise Augmented Reality Market Industry Trends & Insights
This section delves into the key trends and insights shaping the global enterprise augmented reality market. The market is experiencing robust growth, driven by a confluence of factors.
The market exhibits a Compound Annual Growth Rate (CAGR) of xx% during the forecast period (2025-2033). This growth is largely attributable to the rising adoption of AR technology across various industries, the development of more sophisticated and user-friendly AR applications, and the decreasing cost of AR hardware and software. Market penetration in key sectors is projected to reach xx% by 2033. Technological disruptions such as the development of 5G networks, advancements in computer vision, and the miniaturization of AR hardware are further propelling market expansion. Consumer preferences are shifting towards immersive and interactive digital experiences, creating a significant demand for AR applications in entertainment, retail, and education. Competitive dynamics are marked by intense innovation and strategic partnerships, with both established players and new entrants vying for market share. Challenges like high initial investment costs, the need for specialized skills, and concerns about data privacy are also influencing market growth trajectory.
Dominant Markets & Segments in Global Enterprise Augmented Reality Market
This section identifies the leading regions, countries, and end-user segments within the global enterprise augmented reality market.
Leading Segment: The Industrial sector is currently the dominant segment, accounting for approximately xx% of the market share in 2024. This is driven by the increasing adoption of AR for maintenance, training, and design in manufacturing environments.
Key Drivers for Industrial Dominance:
- Improved efficiency and productivity: AR-assisted maintenance reduces downtime and enhances worker efficiency.
- Enhanced worker training: AR-based training simulations provide safer and more cost-effective training.
- Optimized design and prototyping: AR facilitates quicker and more effective product design and prototyping.
The North American region is predicted to maintain its leadership in the market, driven by strong technological advancements and substantial investments in AR technologies. However, the Asia-Pacific region is expected to witness significant growth due to increasing technological adoption and a rising number of AR solution providers. Economic policies supporting technological innovation and infrastructure developments fostering digital adoption are key drivers in these regions.
- Other End-user Segments: While Industrial leads, significant growth is anticipated in Retail & E-commerce (driven by enhanced customer experiences), Education (E-learning), and Automotive & Aerospace (aided by improved design and maintenance processes).
Global Enterprise Augmented Reality Market Product Developments
Recent product innovations focus on improved user interfaces, enhanced visual fidelity, and seamless integration with existing enterprise systems. These advancements cater to the growing demand for more intuitive and user-friendly AR solutions. Miniaturization of AR hardware, such as smart glasses, is enabling wider adoption across diverse work environments. Competitive advantages are gained through improved functionality, ease of use, cost-effectiveness, and strong integration with existing enterprise software. The market is witnessing a trend towards cloud-based AR platforms, providing scalability and enhanced accessibility.
Report Scope & Segmentation Analysis
This report segments the global enterprise augmented reality market by end-user:
Retail and E-commerce: This segment is projected to experience significant growth driven by the increasing use of AR for virtual try-ons and interactive product demonstrations. Market size is expected to reach xx Million by 2033. Competition is intense with many players focusing on providing seamless integration with e-commerce platforms.
Education (E-learning): This segment is experiencing growth fueled by the use of AR for immersive learning experiences. The market size is estimated to reach xx Million by 2033. Key players are focusing on developing educational AR applications that cater to diverse learning styles and needs.
Industrial: This segment dominates the market due to the adoption of AR in manufacturing, maintenance, and training. It is projected to reach xx Million by 2033. Competition in this segment is high, with companies specializing in AR solutions for specific industrial applications.
Automotive and Aerospace: The use of AR for design, manufacturing, and maintenance in the automotive and aerospace industries is driving segment growth. Market size is expected to reach xx Million by 2033. Key players are developing AR solutions focused on improving efficiency and reducing production costs.
Professional Services: AR adoption in sectors like architecture, engineering, and construction is fueling growth in this segment. The market size is expected to reach xx Million by 2033. Companies are creating specialized AR solutions for tasks like design visualization and remote collaboration.
Other End-user Applications (Energy, Public Safety, Agriculture, etc.): This diverse segment is witnessing increasing AR adoption. The projected market size for 2033 is xx Million. Growth is driven by the unique applications of AR in improving safety, efficiency, and decision-making across various sectors.
Key Drivers of Global Enterprise Augmented Reality Market Growth
Several factors drive the growth of the global enterprise augmented reality market. Advancements in AR hardware and software, decreasing costs, increasing availability of high-speed internet, and growing demand for improved worker productivity and efficiency are major catalysts. Government initiatives and investments in AR technology further accelerate market expansion. Furthermore, the rising adoption of cloud-based AR platforms ensures scalability and accessibility, driving broader market penetration across diverse industries.
Challenges in the Global Enterprise Augmented Reality Market Sector
The market faces certain challenges, including the high initial investment costs associated with AR implementation. Data privacy and security concerns pose significant hurdles, particularly in regulated sectors. The requirement for specialized skills and expertise to develop and deploy AR solutions also limits market adoption. Finally, intense competition among existing and emerging players creates pressure on pricing and profitability. These challenges, if not addressed, could potentially impede market growth.
Emerging Opportunities in Global Enterprise Augmented Reality Market
Significant opportunities exist in the AR market, particularly in sectors like healthcare, where AR can improve surgical procedures and patient care. The integration of AR with other technologies, such as 5G and IoT, presents substantial opportunities for creating innovative applications. The development of more user-friendly and accessible AR solutions will broaden market adoption and create new opportunities for market expansion across various demographics and industries. The rise of the metaverse and decentralized AR platforms also unlocks new revenue streams and user engagement avenues.
Leading Players in the Global Enterprise Augmented Reality Market Market
- Darf Design
- Nextech AR Solutions Corp
- Librestream
- Industrial Augmented Reality SL (iAR)
- Rokid Inc
- Dynabook Americas Inc
- Dalux
- Vuzix Corporation
- Epson America Inc (Seiko Epson Corporation)
- Plutomen Technologies Pvt Ltd
- Lenovo Corporation
- Atheer Inc
- ThirdEye
- Vuforia (PTC Inc )
Key Developments in Global Enterprise Augmented Reality Market Industry
November 2021: Qualcomm and Lenovo partnered to launch new augmented reality applications using the Snapdragon Spaces XR Developer Platform and ThinkReality A3 smart glasses. This collaboration significantly expands AR application development capabilities.
May 2022: ThirdEye launched a decentralized AR 3D social network, offering users greater data control and enabling virtual object placement in the real world. This development signifies a shift towards user-centric AR experiences and potentially impacts data privacy regulations.
Strategic Outlook for Global Enterprise Augmented Reality Market Market
The future of the enterprise augmented reality market appears bright, with substantial growth potential driven by technological advancements, increasing demand across various sectors, and strategic investments. The focus on developing user-friendly applications, integrating AR with other technologies, and addressing data privacy concerns will be crucial for realizing the market's full potential. The expansion into new sectors and the emergence of innovative applications will further drive market expansion in the coming years.
Global Enterprise Augmented Reality Market Segmentation
-
1. End-user
- 1.1. Retail and E-commerce
- 1.2. Education (E-learning)
- 1.3. Industrial
- 1.4. Automotive and Aerospace
- 1.5. Professional Services
- 1.6. Other
Global Enterprise Augmented Reality Market Segmentation By Geography
- 1. North America
- 2. Europe
- 3. Asia Pacific
- 4. Rest of the World
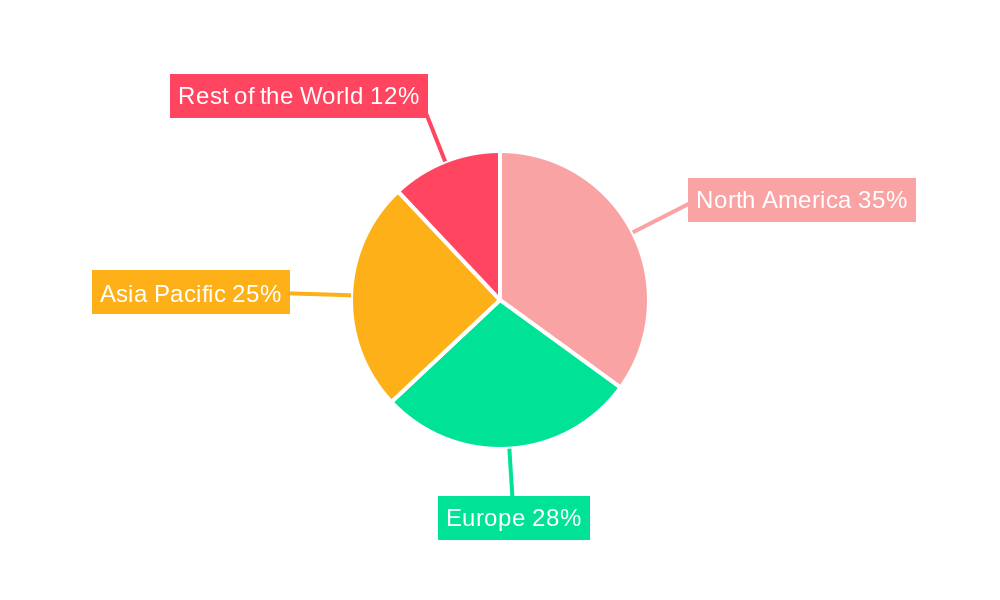
Global Enterprise Augmented Reality Market Regional Market Share
Geographic Coverage of Global Enterprise Augmented Reality Market
Global Enterprise Augmented Reality Market REPORT HIGHLIGHTS
| Aspects | Details |
|---|---|
| Study Period | 2020-2034 |
| Base Year | 2025 |
| Estimated Year | 2026 |
| Forecast Period | 2026-2034 |
| Historical Period | 2020-2025 |
| Growth Rate | CAGR of 35.1% from 2020-2034 |
| Segmentation |
|
Table of Contents
- 1. Introduction
- 1.1. Research Scope
- 1.2. Market Segmentation
- 1.3. Research Objective
- 1.4. Definitions and Assumptions
- 2. Executive Summary
- 2.1. Market Snapshot
- 3. Market Dynamics
- 3.1. Market Drivers
- 3.2. Market Restrains
- 3.3. Market Trends
- 3.4. Market Opportunities
- 4. Market Factor Analysis
- 4.1. Porters Five Forces
- 4.1.1. Bargaining Power of Suppliers
- 4.1.2. Bargaining Power of Buyers
- 4.1.3. Threat of New Entrants
- 4.1.4. Threat of Substitutes
- 4.1.5. Competitive Rivalry
- 4.2. PESTEL analysis
- 4.3. BCG Analysis
- 4.3.1. Stars (High Growth, High Market Share)
- 4.3.2. Cash Cows (Low Growth, High Market Share)
- 4.3.3. Question Mark (High Growth, Low Market Share)
- 4.3.4. Dogs (Low Growth, Low Market Share)
- 4.4. Ansoff Matrix Analysis
- 4.5. Supply Chain Analysis
- 4.6. Regulatory Landscape
- 4.7. Current Market Potential and Opportunity Assessment (TAM–SAM–SOM Framework)
- 4.8. RAX Analyst Note
- 4.1. Porters Five Forces
- 5. Market Analysis, Insights and Forecast 2021-2033
- 5.1. Market Analysis, Insights and Forecast - by End-user
- 5.1.1. Retail and E-commerce
- 5.1.2. Education (E-learning)
- 5.1.3. Industrial
- 5.1.4. Automotive and Aerospace
- 5.1.5. Professional Services
- 5.1.6. Other
- 5.2. Market Analysis, Insights and Forecast - by Region
- 5.2.1. North America
- 5.2.2. Europe
- 5.2.3. Asia Pacific
- 5.2.4. Rest of the World
- 5.1. Market Analysis, Insights and Forecast - by End-user
- 6. Global Enterprise Augmented Reality Market Analysis, Insights and Forecast, 2021-2033
- 6.1. Market Analysis, Insights and Forecast - by End-user
- 6.1.1. Retail and E-commerce
- 6.1.2. Education (E-learning)
- 6.1.3. Industrial
- 6.1.4. Automotive and Aerospace
- 6.1.5. Professional Services
- 6.1.6. Other
- 6.1. Market Analysis, Insights and Forecast - by End-user
- 7. North America Global Enterprise Augmented Reality Market Analysis, Insights and Forecast, 2020-2032
- 7.1. Market Analysis, Insights and Forecast - by End-user
- 7.1.1. Retail and E-commerce
- 7.1.2. Education (E-learning)
- 7.1.3. Industrial
- 7.1.4. Automotive and Aerospace
- 7.1.5. Professional Services
- 7.1.6. Other
- 7.1. Market Analysis, Insights and Forecast - by End-user
- 8. Europe Global Enterprise Augmented Reality Market Analysis, Insights and Forecast, 2020-2032
- 8.1. Market Analysis, Insights and Forecast - by End-user
- 8.1.1. Retail and E-commerce
- 8.1.2. Education (E-learning)
- 8.1.3. Industrial
- 8.1.4. Automotive and Aerospace
- 8.1.5. Professional Services
- 8.1.6. Other
- 8.1. Market Analysis, Insights and Forecast - by End-user
- 9. Asia Pacific Global Enterprise Augmented Reality Market Analysis, Insights and Forecast, 2020-2032
- 9.1. Market Analysis, Insights and Forecast - by End-user
- 9.1.1. Retail and E-commerce
- 9.1.2. Education (E-learning)
- 9.1.3. Industrial
- 9.1.4. Automotive and Aerospace
- 9.1.5. Professional Services
- 9.1.6. Other
- 9.1. Market Analysis, Insights and Forecast - by End-user
- 10. Rest of the World Global Enterprise Augmented Reality Market Analysis, Insights and Forecast, 2020-2032
- 10.1. Market Analysis, Insights and Forecast - by End-user
- 10.1.1. Retail and E-commerce
- 10.1.2. Education (E-learning)
- 10.1.3. Industrial
- 10.1.4. Automotive and Aerospace
- 10.1.5. Professional Services
- 10.1.6. Other
- 10.1. Market Analysis, Insights and Forecast - by End-user
- 11. Competitive Analysis
- 11.1. Company Profiles
- 11.1.1 Darf Design
- 11.1.1.1. Company Overview
- 11.1.1.2. Products
- 11.1.1.3. Company Financials
- 11.1.1.4. SWOT Analysis
- 11.1.2 Nextech AR Solutions Corp
- 11.1.2.1. Company Overview
- 11.1.2.2. Products
- 11.1.2.3. Company Financials
- 11.1.2.4. SWOT Analysis
- 11.1.3 Librestream
- 11.1.3.1. Company Overview
- 11.1.3.2. Products
- 11.1.3.3. Company Financials
- 11.1.3.4. SWOT Analysis
- 11.1.4 Industrial Augmented Reality SL (iAR)
- 11.1.4.1. Company Overview
- 11.1.4.2. Products
- 11.1.4.3. Company Financials
- 11.1.4.4. SWOT Analysis
- 11.1.5 Rokid Inc
- 11.1.5.1. Company Overview
- 11.1.5.2. Products
- 11.1.5.3. Company Financials
- 11.1.5.4. SWOT Analysis
- 11.1.6 Dynabook Americas Inc
- 11.1.6.1. Company Overview
- 11.1.6.2. Products
- 11.1.6.3. Company Financials
- 11.1.6.4. SWOT Analysis
- 11.1.7 Dalux
- 11.1.7.1. Company Overview
- 11.1.7.2. Products
- 11.1.7.3. Company Financials
- 11.1.7.4. SWOT Analysis
- 11.1.8 Vuzix Corporation
- 11.1.8.1. Company Overview
- 11.1.8.2. Products
- 11.1.8.3. Company Financials
- 11.1.8.4. SWOT Analysis
- 11.1.9 Epson America Inc (Seiko Epson Corporation)
- 11.1.9.1. Company Overview
- 11.1.9.2. Products
- 11.1.9.3. Company Financials
- 11.1.9.4. SWOT Analysis
- 11.1.10 Plutomen Technologies Pvt Ltd
- 11.1.10.1. Company Overview
- 11.1.10.2. Products
- 11.1.10.3. Company Financials
- 11.1.10.4. SWOT Analysis
- 11.1.11 Lenovo Corporation
- 11.1.11.1. Company Overview
- 11.1.11.2. Products
- 11.1.11.3. Company Financials
- 11.1.11.4. SWOT Analysis
- 11.1.12 Atheer Inc
- 11.1.12.1. Company Overview
- 11.1.12.2. Products
- 11.1.12.3. Company Financials
- 11.1.12.4. SWOT Analysis
- 11.1.13 ThirdEye
- 11.1.13.1. Company Overview
- 11.1.13.2. Products
- 11.1.13.3. Company Financials
- 11.1.13.4. SWOT Analysis
- 11.1.14 Vuforia (PTC Inc )
- 11.1.14.1. Company Overview
- 11.1.14.2. Products
- 11.1.14.3. Company Financials
- 11.1.14.4. SWOT Analysis
- 11.1.1 Darf Design
- 11.2. Market Entropy
- 11.2.1 Company's Key Areas Served
- 11.2.2 Recent Developments
- 11.3. Company Market Share Analysis 2025
- 11.3.1 Top 5 Companies Market Share Analysis
- 11.3.2 Top 3 Companies Market Share Analysis
- 11.4. List of Potential Customers
- 12. Research Methodology
List of Figures
- Figure 1: Global Global Enterprise Augmented Reality Market Revenue Breakdown (billion, %) by Region 2025 & 2033
- Figure 2: North America Global Enterprise Augmented Reality Market Revenue (billion), by End-user 2025 & 2033
- Figure 3: North America Global Enterprise Augmented Reality Market Revenue Share (%), by End-user 2025 & 2033
- Figure 4: North America Global Enterprise Augmented Reality Market Revenue (billion), by Country 2025 & 2033
- Figure 5: North America Global Enterprise Augmented Reality Market Revenue Share (%), by Country 2025 & 2033
- Figure 6: Europe Global Enterprise Augmented Reality Market Revenue (billion), by End-user 2025 & 2033
- Figure 7: Europe Global Enterprise Augmented Reality Market Revenue Share (%), by End-user 2025 & 2033
- Figure 8: Europe Global Enterprise Augmented Reality Market Revenue (billion), by Country 2025 & 2033
- Figure 9: Europe Global Enterprise Augmented Reality Market Revenue Share (%), by Country 2025 & 2033
- Figure 10: Asia Pacific Global Enterprise Augmented Reality Market Revenue (billion), by End-user 2025 & 2033
- Figure 11: Asia Pacific Global Enterprise Augmented Reality Market Revenue Share (%), by End-user 2025 & 2033
- Figure 12: Asia Pacific Global Enterprise Augmented Reality Market Revenue (billion), by Country 2025 & 2033
- Figure 13: Asia Pacific Global Enterprise Augmented Reality Market Revenue Share (%), by Country 2025 & 2033
- Figure 14: Rest of the World Global Enterprise Augmented Reality Market Revenue (billion), by End-user 2025 & 2033
- Figure 15: Rest of the World Global Enterprise Augmented Reality Market Revenue Share (%), by End-user 2025 & 2033
- Figure 16: Rest of the World Global Enterprise Augmented Reality Market Revenue (billion), by Country 2025 & 2033
- Figure 17: Rest of the World Global Enterprise Augmented Reality Market Revenue Share (%), by Country 2025 & 2033
List of Tables
- Table 1: Global Enterprise Augmented Reality Market Revenue billion Forecast, by End-user 2020 & 2033
- Table 2: Global Enterprise Augmented Reality Market Revenue billion Forecast, by Region 2020 & 2033
- Table 3: Global Enterprise Augmented Reality Market Revenue billion Forecast, by End-user 2020 & 2033
- Table 4: Global Enterprise Augmented Reality Market Revenue billion Forecast, by Country 2020 & 2033
- Table 5: Global Enterprise Augmented Reality Market Revenue billion Forecast, by End-user 2020 & 2033
- Table 6: Global Enterprise Augmented Reality Market Revenue billion Forecast, by Country 2020 & 2033
- Table 7: Global Enterprise Augmented Reality Market Revenue billion Forecast, by End-user 2020 & 2033
- Table 8: Global Enterprise Augmented Reality Market Revenue billion Forecast, by Country 2020 & 2033
- Table 9: Global Enterprise Augmented Reality Market Revenue billion Forecast, by End-user 2020 & 2033
- Table 10: Global Enterprise Augmented Reality Market Revenue billion Forecast, by Country 2020 & 2033
Frequently Asked Questions
1. What is the projected Compound Annual Growth Rate (CAGR) of the Global Enterprise Augmented Reality Market?
The projected CAGR is approximately 35.1%.
2. Which companies are prominent players in the Global Enterprise Augmented Reality Market?
Key companies in the market include Darf Design, Nextech AR Solutions Corp, Librestream, Industrial Augmented Reality SL (iAR), Rokid Inc, Dynabook Americas Inc, Dalux, Vuzix Corporation, Epson America Inc (Seiko Epson Corporation), Plutomen Technologies Pvt Ltd, Lenovo Corporation, Atheer Inc, ThirdEye, Vuforia (PTC Inc ).
3. What are the main segments of the Global Enterprise Augmented Reality Market?
The market segments include End-user.
4. Can you provide details about the market size?
The market size is estimated to be USD 140.34 billion as of 2022.
5. What are some drivers contributing to market growth?
Higher Effectiveness and Efficacy of AR Applications; High Demand for Mobile-based Augmented Reality.
6. What are the notable trends driving market growth?
Demand for Mobile-base AR is Expected to Witness Significant Growth.
7. Are there any restraints impacting market growth?
Increased Demand for Outsourcing and Automation in Pharmaceutical Manufacturing.
8. Can you provide examples of recent developments in the market?
May 2022 - ThirdEye, an Augmented Reality & Artificial Intelligence (AR/AI) solution, has launched a decentralized Augmented Reality (AR) 3D social network for consumers, where they have control over their data and will be able to place virtual AR objects in the real world
9. What pricing options are available for accessing the report?
Pricing options include single-user, multi-user, and enterprise licenses priced at USD 4750, USD 5250, and USD 8750 respectively.
10. Is the market size provided in terms of value or volume?
The market size is provided in terms of value, measured in billion.
11. Are there any specific market keywords associated with the report?
Yes, the market keyword associated with the report is "Global Enterprise Augmented Reality Market," which aids in identifying and referencing the specific market segment covered.
12. How do I determine which pricing option suits my needs best?
The pricing options vary based on user requirements and access needs. Individual users may opt for single-user licenses, while businesses requiring broader access may choose multi-user or enterprise licenses for cost-effective access to the report.
13. Are there any additional resources or data provided in the Global Enterprise Augmented Reality Market report?
While the report offers comprehensive insights, it's advisable to review the specific contents or supplementary materials provided to ascertain if additional resources or data are available.
14. How can I stay updated on further developments or reports in the Global Enterprise Augmented Reality Market?
To stay informed about further developments, trends, and reports in the Global Enterprise Augmented Reality Market, consider subscribing to industry newsletters, following relevant companies and organizations, or regularly checking reputable industry news sources and publications.
Methodology
Step 1 - Identification of Relevant Samples Size from Population Database


Step 2 - Approaches for Defining Global Market Size (Value, Volume* & Price*)

Note*: In applicable scenarios
Step 3 - Data Sources
Primary Research
- Web Analytics
- Survey Reports
- Research Institute
- Latest Research Reports
- Opinion Leaders
Secondary Research
- Annual Reports
- White Paper
- Latest Press Release
- Industry Association
- Paid Database
- Investor Presentations

Step 4 - Data Triangulation
Involves using different sources of information in order to increase the validity of a study
These sources are likely to be stakeholders in a program - participants, other researchers, program staff, other community members, and so on.
Then we put all data in single framework & apply various statistical tools to find out the dynamic on the market.
During the analysis stage, feedback from the stakeholder groups would be compared to determine areas of agreement as well as areas of divergence