

Key Insights
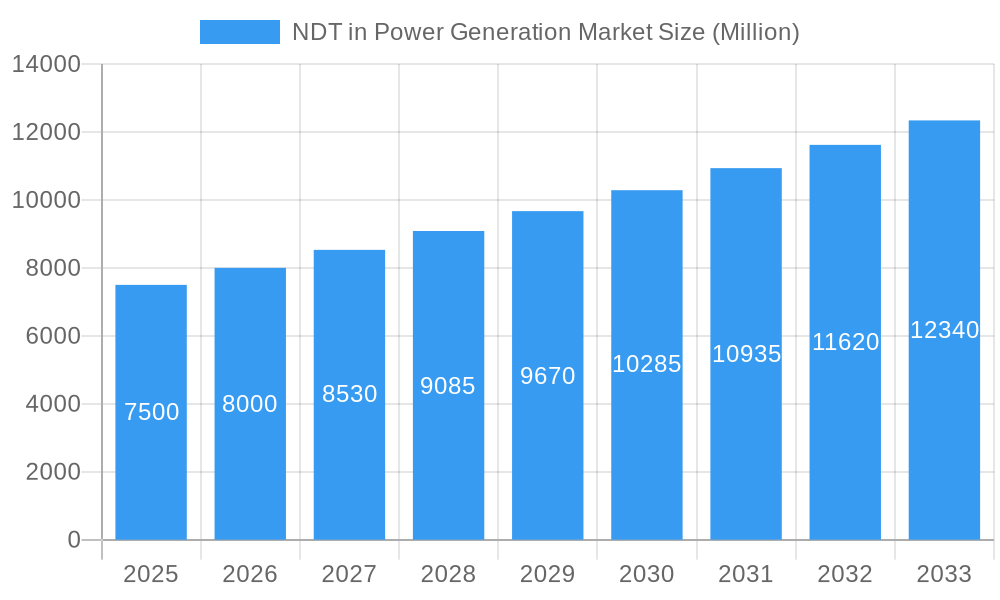
The Non-Destructive Testing (NDT) market in the power generation sector is poised for significant expansion. Driven by stringent safety regulations, the increasing demand for reliable power infrastructure, and the maintenance needs of an aging global power generation fleet, the market is projected for robust growth. The Compound Annual Growth Rate (CAGR) is estimated at 6.24%, with a projected market size of 4.18 billion by 2025. This growth is propelled by the adoption of advanced NDT technologies like ultrasonic and radiography testing, which enhance flaw detection accuracy and efficiency. A growing emphasis on predictive maintenance strategies to minimize downtime and optimize operational efficiency also serves as a key market accelerator.
NDT in Power Generation Market Market Size (In Billion)
Key market segments include NDT services (inspection, consulting, training), equipment (ultrasound scanners, radiographic systems), and specialized testing technologies. Radiography, ultrasonic, and eddy current testing are dominant due to their effectiveness in identifying internal and surface flaws in critical power generation components such as turbines, boilers, and pipelines. Potential restraints include high initial investment costs for advanced equipment and the requirement for skilled personnel. Geographically, North America and Europe exhibit strong market presence due to established infrastructure and strict safety standards. However, the Asia-Pacific region, particularly China and India, is expected to witness the highest growth rate, driven by expanding power generation capacity and infrastructure development. Leading companies like Yxlon, Intertek, Eddyfi, and SGS are key players, competing through technological innovation, service offerings, and global presence.
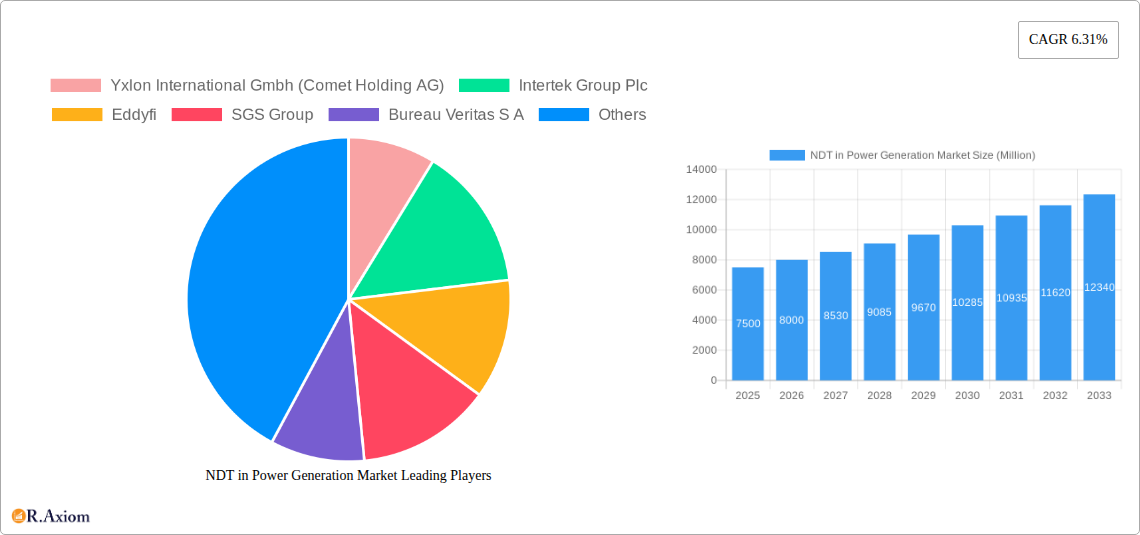
NDT in Power Generation Market Company Market Share
This report offers a comprehensive analysis of the Non-Destructive Testing (NDT) market within the power generation sector, covering the forecast period through 2033. It examines market size, segmentation, key players, growth drivers, challenges, and emerging opportunities, providing actionable insights for industry stakeholders. The analysis is grounded in extensive data and real-world examples, offering a nuanced understanding of this dynamic market.
NDT in Power Generation Market Concentration & Innovation
The NDT in power generation market exhibits a moderately concentrated landscape, with several major players dominating significant market share. While precise market share figures for individual companies are proprietary information, key players like Yxlon International GmbH, Intertek Group Plc, Eddyfi, SGS Group, Bureau Veritas S A, Fujifilm Corporation, Mistras Group Inc, Zetec Inc, Applus+ Services Technologies S L, Baker Hughes Company, Team Inc, and Olympus Corporation collectively account for a substantial portion of the market. However, the presence of numerous smaller, specialized firms indicates a competitive environment.
Market Concentration Metrics (Estimated):
- Herfindahl-Hirschman Index (HHI): xx (indicating moderate concentration)
- Top 5 Market Share: xx%
Innovation Drivers:
- Advancements in AI and Machine Learning: The integration of AI for automated defect detection and analysis is a major driver of innovation, as seen in projects like AUTEND.
- Development of advanced testing technologies: Continuous improvements in ultrasonic testing (UT), radiography testing (RT), eddy current testing (ECT), and other NDT methods are enhancing accuracy and efficiency.
- Miniaturization and portability: Smaller, more portable NDT equipment is improving accessibility and reducing inspection time, especially in challenging environments.
Regulatory Frameworks and M&A Activities:
Stringent safety regulations governing power generation facilities fuel demand for reliable NDT services. The market has witnessed significant M&A activity, with recent examples including Applus+'s acquisition of Inecosa and Adícora in 2021, expanding their presence in the power generation sector. These mergers often involve substantial financial investments, ranging from xx Million to xx Million per deal, depending on the size and scope of the companies involved. The impact of such acquisitions includes market consolidation and broader service offerings.
NDT in Power Generation Market Industry Trends & Insights
The NDT in power generation market is experiencing robust growth, driven by several factors. The aging infrastructure of power generation facilities globally necessitates increased inspection and maintenance activities to ensure safety and operational efficiency. This demand is further amplified by stricter regulatory compliance requirements and a growing emphasis on predictive maintenance strategies. The market is anticipated to witness a Compound Annual Growth Rate (CAGR) of xx% during the forecast period (2025-2033). Market penetration of advanced NDT technologies, such as AI-powered systems, is gradually increasing, enhancing inspection efficiency and accuracy. However, competitive dynamics remain intense, with established players facing challenges from emerging companies offering innovative solutions. Consumer preferences are shifting towards integrated NDT solutions that offer comprehensive data analysis and reporting capabilities.
Dominant Markets & Segments in NDT in Power Generation Market
Dominant Regions/Countries:
The North American and European markets currently hold significant shares of the NDT in power generation market, due to their established power generation infrastructure, stringent regulatory frameworks, and high levels of technological adoption. However, Asia-Pacific is expected to witness the fastest growth due to rapid industrialization and increasing investment in renewable energy sources.
Dominant Segments:
- Type: Services segment dominates the market due to the high demand for specialized expertise and comprehensive inspection solutions.
- Testing Technology: Ultrasonic testing (UT) and radiography testing (RT) remain the most widely used methods, although eddy current testing (ECT) is gaining traction due to its effectiveness in specific applications.
Key Drivers for Dominant Segments:
- Services: Growing need for experienced professionals in NDT, especially given the complexities of inspecting aging infrastructure.
- Ultrasonic Testing: Superior ability to detect internal flaws in various materials.
- Radiography Testing: Widely accepted for its ability to provide detailed images of internal structures.
- Eddy Current Testing: Increasing use in inspecting conductors and detecting surface cracks.
NDT in Power Generation Market Product Developments
Recent product innovations have focused on enhancing the speed, accuracy, and portability of NDT equipment. The integration of AI and machine learning algorithms is significantly improving defect detection and analysis capabilities. New handheld devices and advanced software platforms are improving user-friendliness and data management. These innovations are improving the overall efficiency and effectiveness of NDT inspections, which translates directly into improved safety and reduced operational costs for power generation companies. The market fit is strong, with clear demand for improved inspection technologies across all segments.
Report Scope & Segmentation Analysis
This report offers a detailed segmentation of the NDT in power generation market based on type (Services and Equipment) and testing technology (Radiography Testing, Ultrasonic Testing, Visual Inspection Testing, Eddy Current Testing, and Other Testing Technologies).
Type:
Services: This segment encompasses inspection services, data analysis, and reporting. The market size for services is projected to reach xx Million by 2033, with a CAGR of xx%. Competition is high, with a large number of providers offering specialized services.
Equipment: This segment includes NDT equipment such as ultrasonic flaw detectors, radiographic systems, and eddy current testing instruments. Market size is estimated at xx Million in 2025, with growth expected in the forecast period.
Testing Technology: Each testing technology segment is further analyzed with market size estimations, growth projections, and competitive dynamics. The report details the strengths and weaknesses of each testing method and their applicability to various power generation components.
Key Drivers of NDT in Power Generation Market Growth
Several factors are driving the growth of the NDT in power generation market:
- Aging Infrastructure: The need for regular inspections of aging power plants is a major driver.
- Stringent Safety Regulations: Stricter regulations mandate more frequent and thorough inspections.
- Technological Advancements: The development of advanced NDT techniques and equipment is improving the efficiency and accuracy of inspections.
- Increased Focus on Predictive Maintenance: Moving towards proactive maintenance strategies to minimize downtime and maximize efficiency.
- Growing Renewable Energy Sector: The expansion of renewable energy sources, such as wind and solar power, also requires extensive NDT for quality control and monitoring.
Challenges in the NDT in Power Generation Market Sector
Several challenges exist:
- High Initial Investment Costs: The cost of acquiring advanced NDT equipment can be substantial.
- Skilled Labor Shortages: A lack of trained NDT personnel can constrain the market's growth.
- Complex Inspection Procedures: Inspecting large and complex power generation components can be challenging.
- Data Management and Analysis: Handling large amounts of inspection data efficiently and accurately is critical.
Emerging Opportunities in NDT in Power Generation Market
Emerging opportunities include:
- AI-powered NDT Systems: The integration of AI is set to revolutionize the speed and accuracy of NDT.
- Robotics and Automation: Using robots for automated inspections in hazardous environments.
- Big Data Analytics: Employing big data analytics to optimize maintenance scheduling and improve asset management.
- Expansion into Emerging Markets: Growing demand from developing economies presents significant opportunities.
Leading Players in the NDT in Power Generation Market Market
- Yxlon International Gmbh (Comet Holding AG)
- Intertek Group Plc
- Eddyfi
- SGS Group
- Bureau Veritas S A
- Fujifilm Corporation
- Mistras Group Inc
- Zetec Inc
- Applus+ Services Technologies S L
- Baker Hughes Company
- Team Inc
- Olympus Corporation
Key Developments in NDT in Power Generation Market Industry
- June 2022: The AUTEND project, leveraging AI for faster nuclear power plant inspections, highlights a significant technological shift.
- April 2021: The partnership between IR Supplies and Services and Creative Electron strengthens NDT service capabilities in Canada.
- March 2021: Applus+'s acquisition of Inecosa and Adícora expands its presence and capabilities within the power generation market.
Strategic Outlook for NDT in Power Generation Market Market
The NDT in power generation market is poised for continued growth, driven by technological advancements, aging infrastructure, and stricter safety regulations. The integration of AI and other advanced technologies will transform inspection processes, leading to increased efficiency and accuracy. The market's strategic outlook is positive, with significant opportunities for companies that can adapt to technological changes and offer innovative solutions. Expansion into emerging markets and focus on predictive maintenance services will be key factors in future success.
NDT in Power Generation Market Segmentation
-
1. Type
- 1.1. Services
- 1.2. Equipment
-
2. Testing Technology
- 2.1. Radiography Testing
- 2.2. Ultrasonic Testing
- 2.3. Visual Inspection Testing
- 2.4. Eddy Current Testing
- 2.5. Other Testing Technologies
NDT in Power Generation Market Segmentation By Geography
-
1. North America
- 1.1. United States
- 1.2. Canada
-
2. Europe
- 2.1. United Kingdom
- 2.2. Germany
- 2.3. France
- 2.4. Rest of Europe
-
3. Asia Pacific
- 3.1. China
- 3.2. Japan
- 3.3. India
- 3.4. Rest of Asia Pacific
- 4. Latin America
- 5. Middle East and Africa
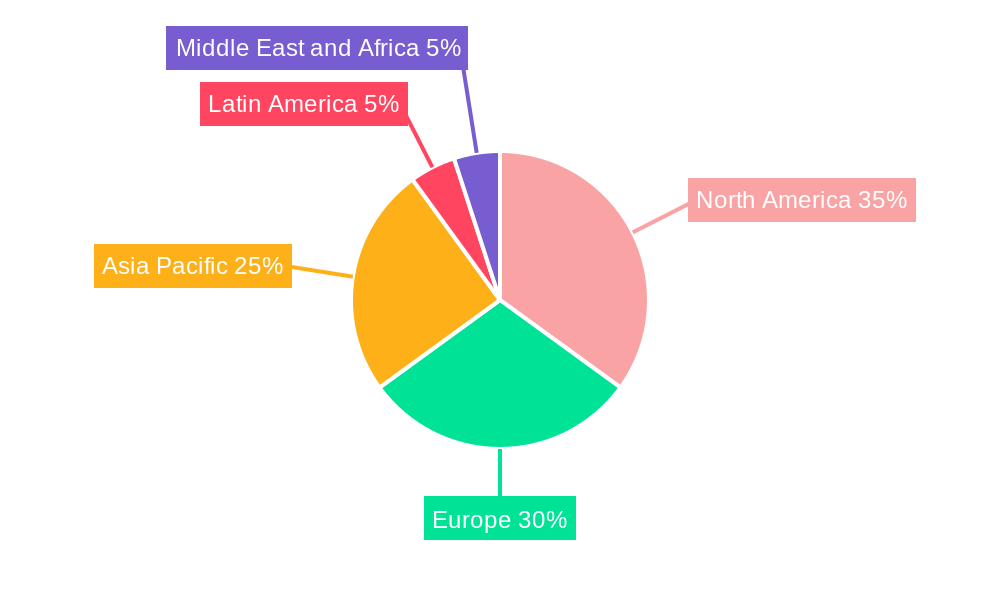
NDT in Power Generation Market Regional Market Share
Geographic Coverage of NDT in Power Generation Market
NDT in Power Generation Market REPORT HIGHLIGHTS
| Aspects | Details |
|---|---|
| Study Period | 2020-2034 |
| Base Year | 2025 |
| Estimated Year | 2026 |
| Forecast Period | 2026-2034 |
| Historical Period | 2020-2025 |
| Growth Rate | CAGR of 6.24% from 2020-2034 |
| Segmentation |
|
Table of Contents
- 1. Introduction
- 1.1. Research Scope
- 1.2. Market Segmentation
- 1.3. Research Objective
- 1.4. Definitions and Assumptions
- 2. Executive Summary
- 2.1. Market Snapshot
- 3. Market Dynamics
- 3.1. Market Drivers
- 3.2. Market Restrains
- 3.3. Market Trends
- 3.4. Market Opportunities
- 4. Market Factor Analysis
- 4.1. Porters Five Forces
- 4.1.1. Bargaining Power of Suppliers
- 4.1.2. Bargaining Power of Buyers
- 4.1.3. Threat of New Entrants
- 4.1.4. Threat of Substitutes
- 4.1.5. Competitive Rivalry
- 4.2. PESTEL analysis
- 4.3. BCG Analysis
- 4.3.1. Stars (High Growth, High Market Share)
- 4.3.2. Cash Cows (Low Growth, High Market Share)
- 4.3.3. Question Mark (High Growth, Low Market Share)
- 4.3.4. Dogs (Low Growth, Low Market Share)
- 4.4. Ansoff Matrix Analysis
- 4.5. Supply Chain Analysis
- 4.6. Regulatory Landscape
- 4.7. Current Market Potential and Opportunity Assessment (TAM–SAM–SOM Framework)
- 4.8. RAX Analyst Note
- 4.1. Porters Five Forces
- 5. Market Analysis, Insights and Forecast 2021-2033
- 5.1. Market Analysis, Insights and Forecast - by Type
- 5.1.1. Services
- 5.1.2. Equipment
- 5.2. Market Analysis, Insights and Forecast - by Testing Technology
- 5.2.1. Radiography Testing
- 5.2.2. Ultrasonic Testing
- 5.2.3. Visual Inspection Testing
- 5.2.4. Eddy Current Testing
- 5.2.5. Other Testing Technologies
- 5.3. Market Analysis, Insights and Forecast - by Region
- 5.3.1. North America
- 5.3.2. Europe
- 5.3.3. Asia Pacific
- 5.3.4. Latin America
- 5.3.5. Middle East and Africa
- 5.1. Market Analysis, Insights and Forecast - by Type
- 6. Global NDT in Power Generation Market Analysis, Insights and Forecast, 2021-2033
- 6.1. Market Analysis, Insights and Forecast - by Type
- 6.1.1. Services
- 6.1.2. Equipment
- 6.2. Market Analysis, Insights and Forecast - by Testing Technology
- 6.2.1. Radiography Testing
- 6.2.2. Ultrasonic Testing
- 6.2.3. Visual Inspection Testing
- 6.2.4. Eddy Current Testing
- 6.2.5. Other Testing Technologies
- 6.1. Market Analysis, Insights and Forecast - by Type
- 7. North America NDT in Power Generation Market Analysis, Insights and Forecast, 2020-2032
- 7.1. Market Analysis, Insights and Forecast - by Type
- 7.1.1. Services
- 7.1.2. Equipment
- 7.2. Market Analysis, Insights and Forecast - by Testing Technology
- 7.2.1. Radiography Testing
- 7.2.2. Ultrasonic Testing
- 7.2.3. Visual Inspection Testing
- 7.2.4. Eddy Current Testing
- 7.2.5. Other Testing Technologies
- 7.1. Market Analysis, Insights and Forecast - by Type
- 8. Europe NDT in Power Generation Market Analysis, Insights and Forecast, 2020-2032
- 8.1. Market Analysis, Insights and Forecast - by Type
- 8.1.1. Services
- 8.1.2. Equipment
- 8.2. Market Analysis, Insights and Forecast - by Testing Technology
- 8.2.1. Radiography Testing
- 8.2.2. Ultrasonic Testing
- 8.2.3. Visual Inspection Testing
- 8.2.4. Eddy Current Testing
- 8.2.5. Other Testing Technologies
- 8.1. Market Analysis, Insights and Forecast - by Type
- 9. Asia Pacific NDT in Power Generation Market Analysis, Insights and Forecast, 2020-2032
- 9.1. Market Analysis, Insights and Forecast - by Type
- 9.1.1. Services
- 9.1.2. Equipment
- 9.2. Market Analysis, Insights and Forecast - by Testing Technology
- 9.2.1. Radiography Testing
- 9.2.2. Ultrasonic Testing
- 9.2.3. Visual Inspection Testing
- 9.2.4. Eddy Current Testing
- 9.2.5. Other Testing Technologies
- 9.1. Market Analysis, Insights and Forecast - by Type
- 10. Latin America NDT in Power Generation Market Analysis, Insights and Forecast, 2020-2032
- 10.1. Market Analysis, Insights and Forecast - by Type
- 10.1.1. Services
- 10.1.2. Equipment
- 10.2. Market Analysis, Insights and Forecast - by Testing Technology
- 10.2.1. Radiography Testing
- 10.2.2. Ultrasonic Testing
- 10.2.3. Visual Inspection Testing
- 10.2.4. Eddy Current Testing
- 10.2.5. Other Testing Technologies
- 10.1. Market Analysis, Insights and Forecast - by Type
- 11. Middle East and Africa NDT in Power Generation Market Analysis, Insights and Forecast, 2020-2032
- 11.1. Market Analysis, Insights and Forecast - by Type
- 11.1.1. Services
- 11.1.2. Equipment
- 11.2. Market Analysis, Insights and Forecast - by Testing Technology
- 11.2.1. Radiography Testing
- 11.2.2. Ultrasonic Testing
- 11.2.3. Visual Inspection Testing
- 11.2.4. Eddy Current Testing
- 11.2.5. Other Testing Technologies
- 11.1. Market Analysis, Insights and Forecast - by Type
- 12. Competitive Analysis
- 12.1. Company Profiles
- 12.1.1 Yxlon International Gmbh (Comet Holding AG)
- 12.1.1.1. Company Overview
- 12.1.1.2. Products
- 12.1.1.3. Company Financials
- 12.1.1.4. SWOT Analysis
- 12.1.2 Intertek Group Plc
- 12.1.2.1. Company Overview
- 12.1.2.2. Products
- 12.1.2.3. Company Financials
- 12.1.2.4. SWOT Analysis
- 12.1.3 Eddyfi
- 12.1.3.1. Company Overview
- 12.1.3.2. Products
- 12.1.3.3. Company Financials
- 12.1.3.4. SWOT Analysis
- 12.1.4 SGS Group
- 12.1.4.1. Company Overview
- 12.1.4.2. Products
- 12.1.4.3. Company Financials
- 12.1.4.4. SWOT Analysis
- 12.1.5 Bureau Veritas S A
- 12.1.5.1. Company Overview
- 12.1.5.2. Products
- 12.1.5.3. Company Financials
- 12.1.5.4. SWOT Analysis
- 12.1.6 Fujifilm Corporation
- 12.1.6.1. Company Overview
- 12.1.6.2. Products
- 12.1.6.3. Company Financials
- 12.1.6.4. SWOT Analysis
- 12.1.7 Mistras Group Inc
- 12.1.7.1. Company Overview
- 12.1.7.2. Products
- 12.1.7.3. Company Financials
- 12.1.7.4. SWOT Analysis
- 12.1.8 Zetec Inc
- 12.1.8.1. Company Overview
- 12.1.8.2. Products
- 12.1.8.3. Company Financials
- 12.1.8.4. SWOT Analysis
- 12.1.9 Applus+ Services Technologies S L
- 12.1.9.1. Company Overview
- 12.1.9.2. Products
- 12.1.9.3. Company Financials
- 12.1.9.4. SWOT Analysis
- 12.1.10 Baker Hughes Company
- 12.1.10.1. Company Overview
- 12.1.10.2. Products
- 12.1.10.3. Company Financials
- 12.1.10.4. SWOT Analysis
- 12.1.11 Team Inc *List Not Exhaustive
- 12.1.11.1. Company Overview
- 12.1.11.2. Products
- 12.1.11.3. Company Financials
- 12.1.11.4. SWOT Analysis
- 12.1.12 Olympus Corporation
- 12.1.12.1. Company Overview
- 12.1.12.2. Products
- 12.1.12.3. Company Financials
- 12.1.12.4. SWOT Analysis
- 12.1.1 Yxlon International Gmbh (Comet Holding AG)
- 12.2. Market Entropy
- 12.2.1 Company's Key Areas Served
- 12.2.2 Recent Developments
- 12.3. Company Market Share Analysis 2025
- 12.3.1 Top 5 Companies Market Share Analysis
- 12.3.2 Top 3 Companies Market Share Analysis
- 12.4. List of Potential Customers
- 13. Research Methodology
List of Figures
- Figure 1: Global NDT in Power Generation Market Revenue Breakdown (billion, %) by Region 2025 & 2033
- Figure 2: North America NDT in Power Generation Market Revenue (billion), by Type 2025 & 2033
- Figure 3: North America NDT in Power Generation Market Revenue Share (%), by Type 2025 & 2033
- Figure 4: North America NDT in Power Generation Market Revenue (billion), by Testing Technology 2025 & 2033
- Figure 5: North America NDT in Power Generation Market Revenue Share (%), by Testing Technology 2025 & 2033
- Figure 6: North America NDT in Power Generation Market Revenue (billion), by Country 2025 & 2033
- Figure 7: North America NDT in Power Generation Market Revenue Share (%), by Country 2025 & 2033
- Figure 8: Europe NDT in Power Generation Market Revenue (billion), by Type 2025 & 2033
- Figure 9: Europe NDT in Power Generation Market Revenue Share (%), by Type 2025 & 2033
- Figure 10: Europe NDT in Power Generation Market Revenue (billion), by Testing Technology 2025 & 2033
- Figure 11: Europe NDT in Power Generation Market Revenue Share (%), by Testing Technology 2025 & 2033
- Figure 12: Europe NDT in Power Generation Market Revenue (billion), by Country 2025 & 2033
- Figure 13: Europe NDT in Power Generation Market Revenue Share (%), by Country 2025 & 2033
- Figure 14: Asia Pacific NDT in Power Generation Market Revenue (billion), by Type 2025 & 2033
- Figure 15: Asia Pacific NDT in Power Generation Market Revenue Share (%), by Type 2025 & 2033
- Figure 16: Asia Pacific NDT in Power Generation Market Revenue (billion), by Testing Technology 2025 & 2033
- Figure 17: Asia Pacific NDT in Power Generation Market Revenue Share (%), by Testing Technology 2025 & 2033
- Figure 18: Asia Pacific NDT in Power Generation Market Revenue (billion), by Country 2025 & 2033
- Figure 19: Asia Pacific NDT in Power Generation Market Revenue Share (%), by Country 2025 & 2033
- Figure 20: Latin America NDT in Power Generation Market Revenue (billion), by Type 2025 & 2033
- Figure 21: Latin America NDT in Power Generation Market Revenue Share (%), by Type 2025 & 2033
- Figure 22: Latin America NDT in Power Generation Market Revenue (billion), by Testing Technology 2025 & 2033
- Figure 23: Latin America NDT in Power Generation Market Revenue Share (%), by Testing Technology 2025 & 2033
- Figure 24: Latin America NDT in Power Generation Market Revenue (billion), by Country 2025 & 2033
- Figure 25: Latin America NDT in Power Generation Market Revenue Share (%), by Country 2025 & 2033
- Figure 26: Middle East and Africa NDT in Power Generation Market Revenue (billion), by Type 2025 & 2033
- Figure 27: Middle East and Africa NDT in Power Generation Market Revenue Share (%), by Type 2025 & 2033
- Figure 28: Middle East and Africa NDT in Power Generation Market Revenue (billion), by Testing Technology 2025 & 2033
- Figure 29: Middle East and Africa NDT in Power Generation Market Revenue Share (%), by Testing Technology 2025 & 2033
- Figure 30: Middle East and Africa NDT in Power Generation Market Revenue (billion), by Country 2025 & 2033
- Figure 31: Middle East and Africa NDT in Power Generation Market Revenue Share (%), by Country 2025 & 2033
List of Tables
- Table 1: Global NDT in Power Generation Market Revenue billion Forecast, by Type 2020 & 2033
- Table 2: Global NDT in Power Generation Market Revenue billion Forecast, by Testing Technology 2020 & 2033
- Table 3: Global NDT in Power Generation Market Revenue billion Forecast, by Region 2020 & 2033
- Table 4: Global NDT in Power Generation Market Revenue billion Forecast, by Type 2020 & 2033
- Table 5: Global NDT in Power Generation Market Revenue billion Forecast, by Testing Technology 2020 & 2033
- Table 6: Global NDT in Power Generation Market Revenue billion Forecast, by Country 2020 & 2033
- Table 7: United States NDT in Power Generation Market Revenue (billion) Forecast, by Application 2020 & 2033
- Table 8: Canada NDT in Power Generation Market Revenue (billion) Forecast, by Application 2020 & 2033
- Table 9: Global NDT in Power Generation Market Revenue billion Forecast, by Type 2020 & 2033
- Table 10: Global NDT in Power Generation Market Revenue billion Forecast, by Testing Technology 2020 & 2033
- Table 11: Global NDT in Power Generation Market Revenue billion Forecast, by Country 2020 & 2033
- Table 12: United Kingdom NDT in Power Generation Market Revenue (billion) Forecast, by Application 2020 & 2033
- Table 13: Germany NDT in Power Generation Market Revenue (billion) Forecast, by Application 2020 & 2033
- Table 14: France NDT in Power Generation Market Revenue (billion) Forecast, by Application 2020 & 2033
- Table 15: Rest of Europe NDT in Power Generation Market Revenue (billion) Forecast, by Application 2020 & 2033
- Table 16: Global NDT in Power Generation Market Revenue billion Forecast, by Type 2020 & 2033
- Table 17: Global NDT in Power Generation Market Revenue billion Forecast, by Testing Technology 2020 & 2033
- Table 18: Global NDT in Power Generation Market Revenue billion Forecast, by Country 2020 & 2033
- Table 19: China NDT in Power Generation Market Revenue (billion) Forecast, by Application 2020 & 2033
- Table 20: Japan NDT in Power Generation Market Revenue (billion) Forecast, by Application 2020 & 2033
- Table 21: India NDT in Power Generation Market Revenue (billion) Forecast, by Application 2020 & 2033
- Table 22: Rest of Asia Pacific NDT in Power Generation Market Revenue (billion) Forecast, by Application 2020 & 2033
- Table 23: Global NDT in Power Generation Market Revenue billion Forecast, by Type 2020 & 2033
- Table 24: Global NDT in Power Generation Market Revenue billion Forecast, by Testing Technology 2020 & 2033
- Table 25: Global NDT in Power Generation Market Revenue billion Forecast, by Country 2020 & 2033
- Table 26: Global NDT in Power Generation Market Revenue billion Forecast, by Type 2020 & 2033
- Table 27: Global NDT in Power Generation Market Revenue billion Forecast, by Testing Technology 2020 & 2033
- Table 28: Global NDT in Power Generation Market Revenue billion Forecast, by Country 2020 & 2033
Frequently Asked Questions
1. What is the projected Compound Annual Growth Rate (CAGR) of the NDT in Power Generation Market?
The projected CAGR is approximately 6.24%.
2. Which companies are prominent players in the NDT in Power Generation Market?
Key companies in the market include Yxlon International Gmbh (Comet Holding AG), Intertek Group Plc, Eddyfi, SGS Group, Bureau Veritas S A, Fujifilm Corporation, Mistras Group Inc, Zetec Inc, Applus+ Services Technologies S L, Baker Hughes Company, Team Inc *List Not Exhaustive, Olympus Corporation.
3. What are the main segments of the NDT in Power Generation Market?
The market segments include Type, Testing Technology.
4. Can you provide details about the market size?
The market size is estimated to be USD 4.18 billion as of 2022.
5. What are some drivers contributing to market growth?
Stringent Regulations Mandating Safety Standards; Increase in Demand for Flaw Detection to Reduce Repair Cost; Aging Infrastructure and Increasing Need for Maintenance.
6. What are the notable trends driving market growth?
Visual Inspection Testing is Expected to Witness a Significant Growth.
7. Are there any restraints impacting market growth?
Lack of Skilled Workforce and Training Regulations.
8. Can you provide examples of recent developments in the market?
June 2022 - ALEIA, a startup specializing in AI, and Omexom NDT Engineering & Services, in collaboration with the Laboratoire d'Acoustique de l'Université du Mans (LAUM) UMR CNRS, have announced the deployment of the AUTEND project. The project is aimed to accelerate the inspection of nuclear power plants through AI. Moreover, the project is presently focusing on Non-Destructive Testing, which is an inspection process for nuclear infrastructures using eddy current or ultrasonic testing methods.
9. What pricing options are available for accessing the report?
Pricing options include single-user, multi-user, and enterprise licenses priced at USD 4750, USD 5250, and USD 8750 respectively.
10. Is the market size provided in terms of value or volume?
The market size is provided in terms of value, measured in billion.
11. Are there any specific market keywords associated with the report?
Yes, the market keyword associated with the report is "NDT in Power Generation Market," which aids in identifying and referencing the specific market segment covered.
12. How do I determine which pricing option suits my needs best?
The pricing options vary based on user requirements and access needs. Individual users may opt for single-user licenses, while businesses requiring broader access may choose multi-user or enterprise licenses for cost-effective access to the report.
13. Are there any additional resources or data provided in the NDT in Power Generation Market report?
While the report offers comprehensive insights, it's advisable to review the specific contents or supplementary materials provided to ascertain if additional resources or data are available.
14. How can I stay updated on further developments or reports in the NDT in Power Generation Market?
To stay informed about further developments, trends, and reports in the NDT in Power Generation Market, consider subscribing to industry newsletters, following relevant companies and organizations, or regularly checking reputable industry news sources and publications.
Methodology
Step 1 - Identification of Relevant Samples Size from Population Database


Step 2 - Approaches for Defining Global Market Size (Value, Volume* & Price*)

Note*: In applicable scenarios
Step 3 - Data Sources
Primary Research
- Web Analytics
- Survey Reports
- Research Institute
- Latest Research Reports
- Opinion Leaders
Secondary Research
- Annual Reports
- White Paper
- Latest Press Release
- Industry Association
- Paid Database
- Investor Presentations

Step 4 - Data Triangulation
Involves using different sources of information in order to increase the validity of a study
These sources are likely to be stakeholders in a program - participants, other researchers, program staff, other community members, and so on.
Then we put all data in single framework & apply various statistical tools to find out the dynamic on the market.
During the analysis stage, feedback from the stakeholder groups would be compared to determine areas of agreement as well as areas of divergence