

Key Insights
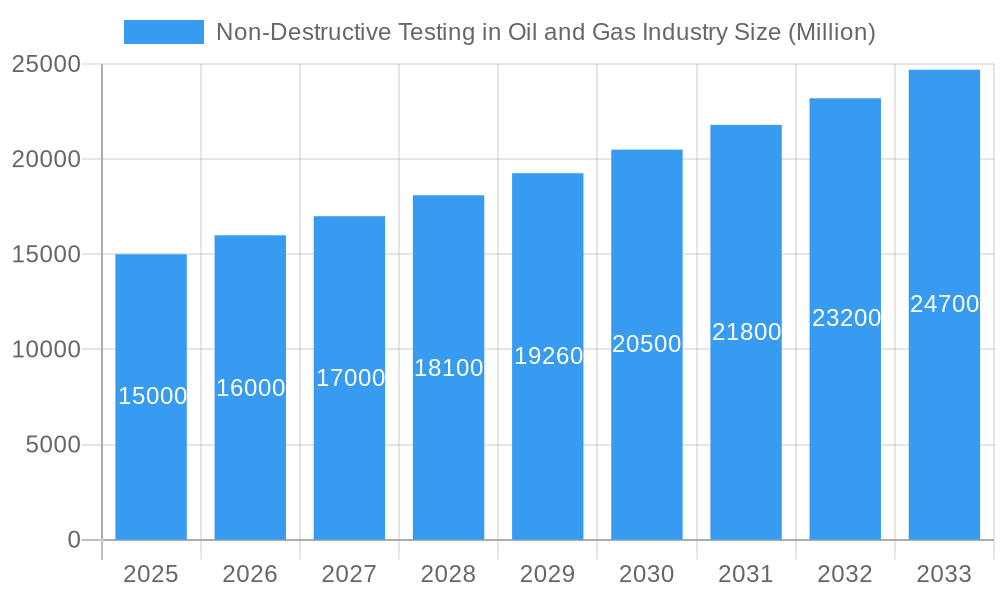
The Non-Destructive Testing (NDT) market within the oil and gas industry is experiencing robust growth, projected to maintain a Compound Annual Growth Rate (CAGR) of 6.52% from 2025 to 2033. This expansion is fueled by several key drivers. Stringent safety regulations mandating thorough equipment inspection are paramount, particularly given the inherent risks associated with oil and gas operations. Furthermore, the increasing demand for enhanced operational efficiency and reduced downtime necessitates proactive NDT implementation. The industry's focus on extending the lifespan of aging infrastructure also contributes significantly to market growth. Technological advancements, such as the adoption of advanced imaging techniques and automation, are improving the accuracy, speed, and cost-effectiveness of NDT procedures. Ultrasonic testing, radiography, and liquid penetrant testing remain dominant techniques, but the market is witnessing growing adoption of more sophisticated methods like magnetic particle and eddy current inspection, particularly in complex pipeline inspection and critical component evaluation. While the high initial investment costs associated with sophisticated NDT equipment can be a restraint, the long-term benefits in terms of safety, efficiency, and cost savings outweigh the initial expenditure.
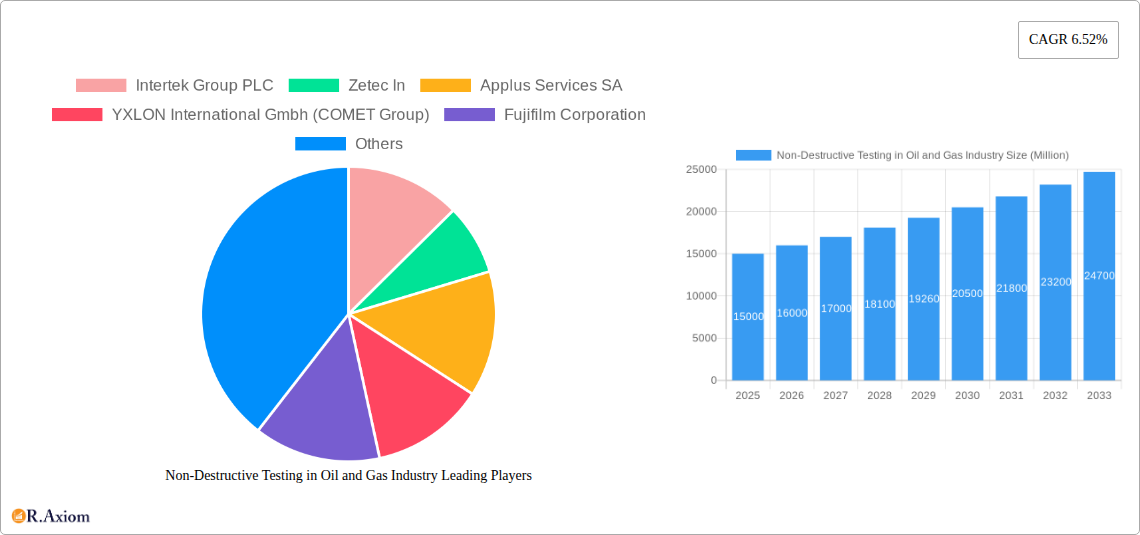
Non-Destructive Testing in Oil and Gas Industry Market Size (In Billion)
Market segmentation reveals a significant share held by equipment and services segments, both experiencing parallel growth. Geographically, North America and Europe currently dominate the market due to established infrastructure and stringent regulatory frameworks. However, the Asia-Pacific region is expected to exhibit the most rapid growth in the forecast period, driven by significant investments in oil and gas exploration and production, alongside rising awareness about safety and operational efficiency. Companies like Intertek, Applus, and Fujifilm are major players, constantly innovating and expanding their service offerings to capture a larger market share within the evolving NDT landscape. The ongoing expansion of the oil and gas sector, along with increasing regulations, will continue to drive substantial market growth in NDT throughout the forecast period. Competition is fierce, pushing innovation and pushing down pricing to make these vital services accessible.
Non-Destructive Testing in Oil and Gas Industry Company Market Share
Non-Destructive Testing (NDT) in the Oil and Gas Industry: A Comprehensive Market Report (2019-2033)
This comprehensive report provides an in-depth analysis of the Non-Destructive Testing (NDT) market within the oil and gas industry, covering the period 2019-2033. The report offers crucial insights into market dynamics, competitive landscapes, technological advancements, and future growth opportunities, empowering stakeholders to make informed strategic decisions. With a focus on key market segments, leading players, and emerging trends, this report is an indispensable resource for industry professionals, investors, and researchers. The report utilizes a robust methodology and incorporates extensive market data for a detailed and accurate representation of this dynamic sector. Market values are expressed in Millions (USD).
Non-Destructive Testing in Oil and Gas Industry Market Concentration & Innovation
The NDT market in the oil and gas sector exhibits a moderately concentrated landscape, with several multinational corporations holding significant market share. Intertek Group PLC, Applus Services SA, and Bureau Veritas SA are among the prominent players, commanding a collective market share estimated at xx%. However, the market also accommodates numerous smaller, specialized firms catering to niche applications or geographical regions.
Market concentration is influenced by factors including M&A activity, technological advancements, and regulatory compliance. Over the historical period (2019-2024), the total value of M&A deals in the NDT market within the oil and gas industry is estimated at $xx Million. These transactions primarily focused on expanding service portfolios, geographical reach, and technological capabilities.
Innovation is a key driver, with continuous development of advanced NDT techniques like advanced ultrasonic imaging, phased array technology, and improved data analysis software. Regulatory frameworks, particularly concerning safety and environmental compliance, significantly impact the adoption of new NDT methods and technologies. The industry faces pressure from alternative inspection methods, although NDT remains the preferred choice for its non-destructive nature and reliability. End-user trends reflect a growing preference for integrated NDT solutions that optimize efficiency and reduce operational costs.
- Key Metrics:
- Estimated Market Share of Top 3 Players: xx% (2025)
- Estimated M&A Deal Value (2019-2024): $xx Million
Non-Destructive Testing in Oil and Gas Industry Industry Trends & Insights
The NDT market in the oil and gas sector is experiencing robust growth, driven by increasing demand for enhanced safety and operational efficiency. The rising complexity of oil and gas infrastructure and stringent regulatory requirements necessitates the widespread adoption of NDT techniques for asset integrity management. Technological advancements, such as the development of portable and automated NDT equipment, contribute to increased productivity and reduced inspection time. Furthermore, the growing focus on predictive maintenance and digitalization is further fueling the adoption of sophisticated NDT solutions. The market is characterized by a high degree of competition, with leading players continuously striving to innovate and expand their service offerings.
The Compound Annual Growth Rate (CAGR) for the NDT market in the oil and gas sector is projected at xx% during the forecast period (2025-2033). Market penetration of advanced NDT technologies, such as phased array ultrasonics and advanced radiography, is steadily increasing, indicating a shift towards more sophisticated and efficient inspection methods. Consumer preference leans toward integrated, automated systems, coupled with robust data analytics, capable of providing real-time insights into asset condition and enabling predictive maintenance.
Dominant Markets & Segments in Non-Destructive Testing in Oil and Gas Industry
Leading Regions/Countries: The North American and European regions dominate the global NDT market in the oil and gas industry, driven by substantial oil and gas production, extensive existing infrastructure, and stringent regulatory compliance requirements. The Asia-Pacific region exhibits significant growth potential due to rapid infrastructural development and increasing investment in the oil and gas sector.
Dominant Segments:
- By Type: Services segment holds the largest market share, driven by the outsourcing of NDT inspections by oil and gas companies to specialized service providers.
- By Technique: Ultrasonic testing holds the dominant market share due to its versatility, cost-effectiveness, and ability to detect a wide range of defects.
Key Drivers:
- Upstream: Stringent regulations and growing demand for enhanced safety in offshore operations are driving segment growth.
- Midstream: The need for efficient pipeline inspection and maintenance to prevent leaks and ensure safety is a key driver.
- Downstream: Demand for quality control and preventative maintenance in refineries and petrochemical plants fuels this segment’s growth.
Dominance Analysis: The dominance of specific regions and segments is attributable to factors including existing infrastructure, regulatory environment, and technological advancements. North America's dominance stems from a combination of robust regulations, a well-established NDT service industry, and high levels of oil and gas production.
Non-Destructive Testing in Oil and Gas Industry Product Developments
Recent product innovations have focused on enhancing portability, automation, and data analysis capabilities of NDT equipment. The development of advanced handheld imagers, such as Videray Technologies Inc.’s PX Ultra, addresses the need for rapid and efficient inspections in challenging environments. Improved software solutions enable efficient data processing and interpretation, leading to faster and more accurate defect detection. These developments are driven by the need for enhanced efficiency, improved safety, and reduced inspection costs. The market fit for these innovations is strong, driven by industry demands for enhanced asset integrity management and predictive maintenance strategies.
Report Scope & Segmentation Analysis
This report segments the NDT market in the oil and gas industry by Type (Equipment, Services) and Technique (Ultrasonic, Radiography, Visual Inspection, Liquid Penetrant, Others). Each segment is further analyzed based on its regional distribution (North America, Europe, Asia Pacific, etc.), providing comprehensive insights into market size, growth projections, and competitive dynamics for each market segment. The report includes detailed analysis of the historical period (2019-2024), base year (2025), and forecast period (2025-2033).
- By Type - Equipment: This segment encompasses the manufacturing and sale of various NDT instruments and equipment.
- By Type - Services: This segment includes the provision of NDT inspection and testing services by specialized companies.
- By Technique - Ultrasonic: This technique uses high-frequency sound waves to detect internal flaws.
- By Technique - Radiography: This method utilizes X-rays or gamma rays to create images of internal structures.
- By Technique - Visual Inspection: A basic method involving visual observation of the object's surface.
- By Technique - Liquid Penetrant: This method uses colored liquids to detect surface cracks.
- By Technique - Others (Magnetic Particle & Eddy Current): This encompasses magnetic particle testing and eddy current testing for detecting surface and subsurface flaws.
Key Drivers of Non-Destructive Testing in Oil and Gas Industry Growth
Several factors propel the growth of the NDT market in the oil and gas sector. Stringent safety regulations mandate regular inspections to prevent catastrophic failures and environmental damage. The increasing complexity and scale of oil and gas infrastructure further necessitate the use of advanced NDT techniques for asset integrity management. Technological advancements, leading to more efficient, portable, and automated systems, significantly reduce inspection time and costs, contributing to the market's expansion. Finally, the growing emphasis on predictive maintenance, aimed at minimizing downtime and maximizing operational efficiency, enhances the demand for NDT services.
Challenges in the Non-Destructive Testing in Oil and Gas Industry Sector
The NDT market faces challenges including the high initial investment cost associated with advanced NDT technologies, potentially limiting adoption by smaller companies. The skilled labor shortage in the NDT field creates a bottleneck in service provision and restricts market expansion. Furthermore, fluctuating oil and gas prices can affect investment decisions and lead to postponement of NDT-related projects. Stringent regulatory compliance requirements and the need for continuous operator training can represent additional costs for companies operating in this sector.
Emerging Opportunities in Non-Destructive Testing in Oil and Gas Industry
The integration of artificial intelligence (AI) and machine learning (ML) in NDT data analysis presents a significant opportunity for improved accuracy, automation, and real-time defect detection. The expansion into new markets, such as renewable energy infrastructure, offers diversification opportunities for NDT providers. The development of more sustainable and environmentally friendly NDT technologies addresses growing environmental concerns within the industry.
Leading Players in the Non-Destructive Testing in Oil and Gas Industry Market
- Intertek Group PLC
- Zetec Inc
- Applus Services SA
- YXLON International GmbH (COMET Group)
- Fujifilm Corporation
- GE Measurement and Control (Baker Hughes)
- Karl Storz Ndtec GmbH
- Bureau Veritas SA
- Olympus Corporation
- Magnaflux Corp
- Magnetic Analysis Corporation
Key Developments in Non-Destructive Testing in Oil and Gas Industry Industry
September 2022: Waygate Technologies introduced the Ruby|plate 240 calibration phantom for industrial computed tomography (CT), enhancing calibration accuracy and speed in industrial CT scans. This improves the reliability and efficiency of CT-based NDT.
October 2022: Videray Technologies Inc. launched PX Ultra, a handheld backscatter X-ray imager, enabling faster and more efficient anomaly detection through thicker materials. This expands the capabilities of handheld NDT equipment for various industrial applications, improving safety and efficiency.
Strategic Outlook for Non-Destructive Testing in Oil and Gas Industry Market
The NDT market in the oil and gas industry is poised for continued growth, driven by the increasing need for enhanced safety, regulatory compliance, and operational efficiency. The adoption of advanced technologies such as AI and ML, coupled with a growing emphasis on predictive maintenance, will create new opportunities for NDT providers. The expansion into new markets, such as renewable energy, presents significant growth potential. Companies that invest in innovation, develop comprehensive service offerings, and embrace technological advancements are well-positioned to capitalize on the future growth prospects of this dynamic market.
Non-Destructive Testing in Oil and Gas Industry Segmentation
-
1. Type
- 1.1. Equipment
- 1.2. Services
-
2. Type
- 2.1. Upstream
- 2.2. Midstream
- 2.3. Downstream
-
3. Technique
- 3.1. Ultrasonic
- 3.2. Radiography
- 3.3. Visual Inspection
- 3.4. Liquid Penetrant
- 3.5. Others (Magnetic Particle & Eddy Current)
Non-Destructive Testing in Oil and Gas Industry Segmentation By Geography
- 1. North America
- 2. Europe
- 3. Asia Pacific
- 4. Rest of the World

Non-Destructive Testing in Oil and Gas Industry Regional Market Share
Geographic Coverage of Non-Destructive Testing in Oil and Gas Industry
Non-Destructive Testing in Oil and Gas Industry REPORT HIGHLIGHTS
| Aspects | Details |
|---|---|
| Study Period | 2020-2034 |
| Base Year | 2025 |
| Estimated Year | 2026 |
| Forecast Period | 2026-2034 |
| Historical Period | 2020-2025 |
| Growth Rate | CAGR of 8.8% from 2020-2034 |
| Segmentation |
|
Table of Contents
- 1. Introduction
- 1.1. Research Scope
- 1.2. Market Segmentation
- 1.3. Research Objective
- 1.4. Definitions and Assumptions
- 2. Executive Summary
- 2.1. Market Snapshot
- 3. Market Dynamics
- 3.1. Market Drivers
- 3.2. Market Restrains
- 3.3. Market Trends
- 3.4. Market Opportunities
- 4. Market Factor Analysis
- 4.1. Porters Five Forces
- 4.1.1. Bargaining Power of Suppliers
- 4.1.2. Bargaining Power of Buyers
- 4.1.3. Threat of New Entrants
- 4.1.4. Threat of Substitutes
- 4.1.5. Competitive Rivalry
- 4.2. PESTEL analysis
- 4.3. BCG Analysis
- 4.3.1. Stars (High Growth, High Market Share)
- 4.3.2. Cash Cows (Low Growth, High Market Share)
- 4.3.3. Question Mark (High Growth, Low Market Share)
- 4.3.4. Dogs (Low Growth, Low Market Share)
- 4.4. Ansoff Matrix Analysis
- 4.5. Supply Chain Analysis
- 4.6. Regulatory Landscape
- 4.7. Current Market Potential and Opportunity Assessment (TAM–SAM–SOM Framework)
- 4.8. RAX Analyst Note
- 4.1. Porters Five Forces
- 5. Market Analysis, Insights and Forecast 2021-2033
- 5.1. Market Analysis, Insights and Forecast - by Type
- 5.1.1. Equipment
- 5.1.2. Services
- 5.2. Market Analysis, Insights and Forecast - by Type
- 5.2.1. Upstream
- 5.2.2. Midstream
- 5.2.3. Downstream
- 5.3. Market Analysis, Insights and Forecast - by Technique
- 5.3.1. Ultrasonic
- 5.3.2. Radiography
- 5.3.3. Visual Inspection
- 5.3.4. Liquid Penetrant
- 5.3.5. Others (Magnetic Particle & Eddy Current)
- 5.4. Market Analysis, Insights and Forecast - by Region
- 5.4.1. North America
- 5.4.2. Europe
- 5.4.3. Asia Pacific
- 5.4.4. Rest of the World
- 5.1. Market Analysis, Insights and Forecast - by Type
- 6. Global Non-Destructive Testing in Oil and Gas Industry Analysis, Insights and Forecast, 2021-2033
- 6.1. Market Analysis, Insights and Forecast - by Type
- 6.1.1. Equipment
- 6.1.2. Services
- 6.2. Market Analysis, Insights and Forecast - by Type
- 6.2.1. Upstream
- 6.2.2. Midstream
- 6.2.3. Downstream
- 6.3. Market Analysis, Insights and Forecast - by Technique
- 6.3.1. Ultrasonic
- 6.3.2. Radiography
- 6.3.3. Visual Inspection
- 6.3.4. Liquid Penetrant
- 6.3.5. Others (Magnetic Particle & Eddy Current)
- 6.1. Market Analysis, Insights and Forecast - by Type
- 7. North America Non-Destructive Testing in Oil and Gas Industry Analysis, Insights and Forecast, 2020-2032
- 7.1. Market Analysis, Insights and Forecast - by Type
- 7.1.1. Equipment
- 7.1.2. Services
- 7.2. Market Analysis, Insights and Forecast - by Type
- 7.2.1. Upstream
- 7.2.2. Midstream
- 7.2.3. Downstream
- 7.3. Market Analysis, Insights and Forecast - by Technique
- 7.3.1. Ultrasonic
- 7.3.2. Radiography
- 7.3.3. Visual Inspection
- 7.3.4. Liquid Penetrant
- 7.3.5. Others (Magnetic Particle & Eddy Current)
- 7.1. Market Analysis, Insights and Forecast - by Type
- 8. Europe Non-Destructive Testing in Oil and Gas Industry Analysis, Insights and Forecast, 2020-2032
- 8.1. Market Analysis, Insights and Forecast - by Type
- 8.1.1. Equipment
- 8.1.2. Services
- 8.2. Market Analysis, Insights and Forecast - by Type
- 8.2.1. Upstream
- 8.2.2. Midstream
- 8.2.3. Downstream
- 8.3. Market Analysis, Insights and Forecast - by Technique
- 8.3.1. Ultrasonic
- 8.3.2. Radiography
- 8.3.3. Visual Inspection
- 8.3.4. Liquid Penetrant
- 8.3.5. Others (Magnetic Particle & Eddy Current)
- 8.1. Market Analysis, Insights and Forecast - by Type
- 9. Asia Pacific Non-Destructive Testing in Oil and Gas Industry Analysis, Insights and Forecast, 2020-2032
- 9.1. Market Analysis, Insights and Forecast - by Type
- 9.1.1. Equipment
- 9.1.2. Services
- 9.2. Market Analysis, Insights and Forecast - by Type
- 9.2.1. Upstream
- 9.2.2. Midstream
- 9.2.3. Downstream
- 9.3. Market Analysis, Insights and Forecast - by Technique
- 9.3.1. Ultrasonic
- 9.3.2. Radiography
- 9.3.3. Visual Inspection
- 9.3.4. Liquid Penetrant
- 9.3.5. Others (Magnetic Particle & Eddy Current)
- 9.1. Market Analysis, Insights and Forecast - by Type
- 10. Rest of the World Non-Destructive Testing in Oil and Gas Industry Analysis, Insights and Forecast, 2020-2032
- 10.1. Market Analysis, Insights and Forecast - by Type
- 10.1.1. Equipment
- 10.1.2. Services
- 10.2. Market Analysis, Insights and Forecast - by Type
- 10.2.1. Upstream
- 10.2.2. Midstream
- 10.2.3. Downstream
- 10.3. Market Analysis, Insights and Forecast - by Technique
- 10.3.1. Ultrasonic
- 10.3.2. Radiography
- 10.3.3. Visual Inspection
- 10.3.4. Liquid Penetrant
- 10.3.5. Others (Magnetic Particle & Eddy Current)
- 10.1. Market Analysis, Insights and Forecast - by Type
- 11. Competitive Analysis
- 11.1. Company Profiles
- 11.1.1 Intertek Group PLC
- 11.1.1.1. Company Overview
- 11.1.1.2. Products
- 11.1.1.3. Company Financials
- 11.1.1.4. SWOT Analysis
- 11.1.2 Zetec In
- 11.1.2.1. Company Overview
- 11.1.2.2. Products
- 11.1.2.3. Company Financials
- 11.1.2.4. SWOT Analysis
- 11.1.3 Applus Services SA
- 11.1.3.1. Company Overview
- 11.1.3.2. Products
- 11.1.3.3. Company Financials
- 11.1.3.4. SWOT Analysis
- 11.1.4 YXLON International Gmbh (COMET Group)
- 11.1.4.1. Company Overview
- 11.1.4.2. Products
- 11.1.4.3. Company Financials
- 11.1.4.4. SWOT Analysis
- 11.1.5 Fujifilm Corporation
- 11.1.5.1. Company Overview
- 11.1.5.2. Products
- 11.1.5.3. Company Financials
- 11.1.5.4. SWOT Analysis
- 11.1.6 GE Measurement and Control (Baker Hughes)
- 11.1.6.1. Company Overview
- 11.1.6.2. Products
- 11.1.6.3. Company Financials
- 11.1.6.4. SWOT Analysis
- 11.1.7 Karl Storz Ndtec Gmbh
- 11.1.7.1. Company Overview
- 11.1.7.2. Products
- 11.1.7.3. Company Financials
- 11.1.7.4. SWOT Analysis
- 11.1.8 Bureau Veritas SA
- 11.1.8.1. Company Overview
- 11.1.8.2. Products
- 11.1.8.3. Company Financials
- 11.1.8.4. SWOT Analysis
- 11.1.9 Olympus Corporation
- 11.1.9.1. Company Overview
- 11.1.9.2. Products
- 11.1.9.3. Company Financials
- 11.1.9.4. SWOT Analysis
- 11.1.10 Magnaflux Corp
- 11.1.10.1. Company Overview
- 11.1.10.2. Products
- 11.1.10.3. Company Financials
- 11.1.10.4. SWOT Analysis
- 11.1.11 Magnetic Analysis Corporation
- 11.1.11.1. Company Overview
- 11.1.11.2. Products
- 11.1.11.3. Company Financials
- 11.1.11.4. SWOT Analysis
- 11.1.1 Intertek Group PLC
- 11.2. Market Entropy
- 11.2.1 Company's Key Areas Served
- 11.2.2 Recent Developments
- 11.3. Company Market Share Analysis 2025
- 11.3.1 Top 5 Companies Market Share Analysis
- 11.3.2 Top 3 Companies Market Share Analysis
- 11.4. List of Potential Customers
- 12. Research Methodology
List of Figures
- Figure 1: Global Non-Destructive Testing in Oil and Gas Industry Revenue Breakdown (billion, %) by Region 2025 & 2033
- Figure 2: North America Non-Destructive Testing in Oil and Gas Industry Revenue (billion), by Type 2025 & 2033
- Figure 3: North America Non-Destructive Testing in Oil and Gas Industry Revenue Share (%), by Type 2025 & 2033
- Figure 4: North America Non-Destructive Testing in Oil and Gas Industry Revenue (billion), by Type 2025 & 2033
- Figure 5: North America Non-Destructive Testing in Oil and Gas Industry Revenue Share (%), by Type 2025 & 2033
- Figure 6: North America Non-Destructive Testing in Oil and Gas Industry Revenue (billion), by Technique 2025 & 2033
- Figure 7: North America Non-Destructive Testing in Oil and Gas Industry Revenue Share (%), by Technique 2025 & 2033
- Figure 8: North America Non-Destructive Testing in Oil and Gas Industry Revenue (billion), by Country 2025 & 2033
- Figure 9: North America Non-Destructive Testing in Oil and Gas Industry Revenue Share (%), by Country 2025 & 2033
- Figure 10: Europe Non-Destructive Testing in Oil and Gas Industry Revenue (billion), by Type 2025 & 2033
- Figure 11: Europe Non-Destructive Testing in Oil and Gas Industry Revenue Share (%), by Type 2025 & 2033
- Figure 12: Europe Non-Destructive Testing in Oil and Gas Industry Revenue (billion), by Type 2025 & 2033
- Figure 13: Europe Non-Destructive Testing in Oil and Gas Industry Revenue Share (%), by Type 2025 & 2033
- Figure 14: Europe Non-Destructive Testing in Oil and Gas Industry Revenue (billion), by Technique 2025 & 2033
- Figure 15: Europe Non-Destructive Testing in Oil and Gas Industry Revenue Share (%), by Technique 2025 & 2033
- Figure 16: Europe Non-Destructive Testing in Oil and Gas Industry Revenue (billion), by Country 2025 & 2033
- Figure 17: Europe Non-Destructive Testing in Oil and Gas Industry Revenue Share (%), by Country 2025 & 2033
- Figure 18: Asia Pacific Non-Destructive Testing in Oil and Gas Industry Revenue (billion), by Type 2025 & 2033
- Figure 19: Asia Pacific Non-Destructive Testing in Oil and Gas Industry Revenue Share (%), by Type 2025 & 2033
- Figure 20: Asia Pacific Non-Destructive Testing in Oil and Gas Industry Revenue (billion), by Type 2025 & 2033
- Figure 21: Asia Pacific Non-Destructive Testing in Oil and Gas Industry Revenue Share (%), by Type 2025 & 2033
- Figure 22: Asia Pacific Non-Destructive Testing in Oil and Gas Industry Revenue (billion), by Technique 2025 & 2033
- Figure 23: Asia Pacific Non-Destructive Testing in Oil and Gas Industry Revenue Share (%), by Technique 2025 & 2033
- Figure 24: Asia Pacific Non-Destructive Testing in Oil and Gas Industry Revenue (billion), by Country 2025 & 2033
- Figure 25: Asia Pacific Non-Destructive Testing in Oil and Gas Industry Revenue Share (%), by Country 2025 & 2033
- Figure 26: Rest of the World Non-Destructive Testing in Oil and Gas Industry Revenue (billion), by Type 2025 & 2033
- Figure 27: Rest of the World Non-Destructive Testing in Oil and Gas Industry Revenue Share (%), by Type 2025 & 2033
- Figure 28: Rest of the World Non-Destructive Testing in Oil and Gas Industry Revenue (billion), by Type 2025 & 2033
- Figure 29: Rest of the World Non-Destructive Testing in Oil and Gas Industry Revenue Share (%), by Type 2025 & 2033
- Figure 30: Rest of the World Non-Destructive Testing in Oil and Gas Industry Revenue (billion), by Technique 2025 & 2033
- Figure 31: Rest of the World Non-Destructive Testing in Oil and Gas Industry Revenue Share (%), by Technique 2025 & 2033
- Figure 32: Rest of the World Non-Destructive Testing in Oil and Gas Industry Revenue (billion), by Country 2025 & 2033
- Figure 33: Rest of the World Non-Destructive Testing in Oil and Gas Industry Revenue Share (%), by Country 2025 & 2033
List of Tables
- Table 1: Global Non-Destructive Testing in Oil and Gas Industry Revenue billion Forecast, by Type 2020 & 2033
- Table 2: Global Non-Destructive Testing in Oil and Gas Industry Revenue billion Forecast, by Type 2020 & 2033
- Table 3: Global Non-Destructive Testing in Oil and Gas Industry Revenue billion Forecast, by Technique 2020 & 2033
- Table 4: Global Non-Destructive Testing in Oil and Gas Industry Revenue billion Forecast, by Region 2020 & 2033
- Table 5: Global Non-Destructive Testing in Oil and Gas Industry Revenue billion Forecast, by Type 2020 & 2033
- Table 6: Global Non-Destructive Testing in Oil and Gas Industry Revenue billion Forecast, by Type 2020 & 2033
- Table 7: Global Non-Destructive Testing in Oil and Gas Industry Revenue billion Forecast, by Technique 2020 & 2033
- Table 8: Global Non-Destructive Testing in Oil and Gas Industry Revenue billion Forecast, by Country 2020 & 2033
- Table 9: Global Non-Destructive Testing in Oil and Gas Industry Revenue billion Forecast, by Type 2020 & 2033
- Table 10: Global Non-Destructive Testing in Oil and Gas Industry Revenue billion Forecast, by Type 2020 & 2033
- Table 11: Global Non-Destructive Testing in Oil and Gas Industry Revenue billion Forecast, by Technique 2020 & 2033
- Table 12: Global Non-Destructive Testing in Oil and Gas Industry Revenue billion Forecast, by Country 2020 & 2033
- Table 13: Global Non-Destructive Testing in Oil and Gas Industry Revenue billion Forecast, by Type 2020 & 2033
- Table 14: Global Non-Destructive Testing in Oil and Gas Industry Revenue billion Forecast, by Type 2020 & 2033
- Table 15: Global Non-Destructive Testing in Oil and Gas Industry Revenue billion Forecast, by Technique 2020 & 2033
- Table 16: Global Non-Destructive Testing in Oil and Gas Industry Revenue billion Forecast, by Country 2020 & 2033
- Table 17: Global Non-Destructive Testing in Oil and Gas Industry Revenue billion Forecast, by Type 2020 & 2033
- Table 18: Global Non-Destructive Testing in Oil and Gas Industry Revenue billion Forecast, by Type 2020 & 2033
- Table 19: Global Non-Destructive Testing in Oil and Gas Industry Revenue billion Forecast, by Technique 2020 & 2033
- Table 20: Global Non-Destructive Testing in Oil and Gas Industry Revenue billion Forecast, by Country 2020 & 2033
Frequently Asked Questions
1. What is the projected Compound Annual Growth Rate (CAGR) of the Non-Destructive Testing in Oil and Gas Industry?
The projected CAGR is approximately 8.8%.
2. Which companies are prominent players in the Non-Destructive Testing in Oil and Gas Industry?
Key companies in the market include Intertek Group PLC, Zetec In, Applus Services SA, YXLON International Gmbh (COMET Group), Fujifilm Corporation, GE Measurement and Control (Baker Hughes), Karl Storz Ndtec Gmbh, Bureau Veritas SA, Olympus Corporation, Magnaflux Corp, Magnetic Analysis Corporation.
3. What are the main segments of the Non-Destructive Testing in Oil and Gas Industry?
The market segments include Type, Type, Technique.
4. Can you provide details about the market size?
The market size is estimated to be USD 4.06 billion as of 2022.
5. What are some drivers contributing to market growth?
Rising need to run refinery assets at full cap; Upstream sector expected to gain momentum in key markets.
6. What are the notable trends driving market growth?
The Rising Usage of Drones in the Market.
7. Are there any restraints impacting market growth?
; High Initial Cost During First Time Setup is Challenging the Market Growth.
8. Can you provide examples of recent developments in the market?
September 2022 : Waygate Technologies introduced the Ruby|plate 240 calibration phantom for industrial computed tomography (CT). Features high-resolution insights and captures extremely accurate and effective calibration bodies to determine the exact voxel size and allows operators to detect any deviation quickly and non-destructively in geometry.
9. What pricing options are available for accessing the report?
Pricing options include single-user, multi-user, and enterprise licenses priced at USD 4750, USD 5250, and USD 8750 respectively.
10. Is the market size provided in terms of value or volume?
The market size is provided in terms of value, measured in billion.
11. Are there any specific market keywords associated with the report?
Yes, the market keyword associated with the report is "Non-Destructive Testing in Oil and Gas Industry," which aids in identifying and referencing the specific market segment covered.
12. How do I determine which pricing option suits my needs best?
The pricing options vary based on user requirements and access needs. Individual users may opt for single-user licenses, while businesses requiring broader access may choose multi-user or enterprise licenses for cost-effective access to the report.
13. Are there any additional resources or data provided in the Non-Destructive Testing in Oil and Gas Industry report?
While the report offers comprehensive insights, it's advisable to review the specific contents or supplementary materials provided to ascertain if additional resources or data are available.
14. How can I stay updated on further developments or reports in the Non-Destructive Testing in Oil and Gas Industry?
To stay informed about further developments, trends, and reports in the Non-Destructive Testing in Oil and Gas Industry, consider subscribing to industry newsletters, following relevant companies and organizations, or regularly checking reputable industry news sources and publications.
Methodology
Step 1 - Identification of Relevant Samples Size from Population Database


Step 2 - Approaches for Defining Global Market Size (Value, Volume* & Price*)

Note*: In applicable scenarios
Step 3 - Data Sources
Primary Research
- Web Analytics
- Survey Reports
- Research Institute
- Latest Research Reports
- Opinion Leaders
Secondary Research
- Annual Reports
- White Paper
- Latest Press Release
- Industry Association
- Paid Database
- Investor Presentations

Step 4 - Data Triangulation
Involves using different sources of information in order to increase the validity of a study
These sources are likely to be stakeholders in a program - participants, other researchers, program staff, other community members, and so on.
Then we put all data in single framework & apply various statistical tools to find out the dynamic on the market.
During the analysis stage, feedback from the stakeholder groups would be compared to determine areas of agreement as well as areas of divergence