
Key Insights
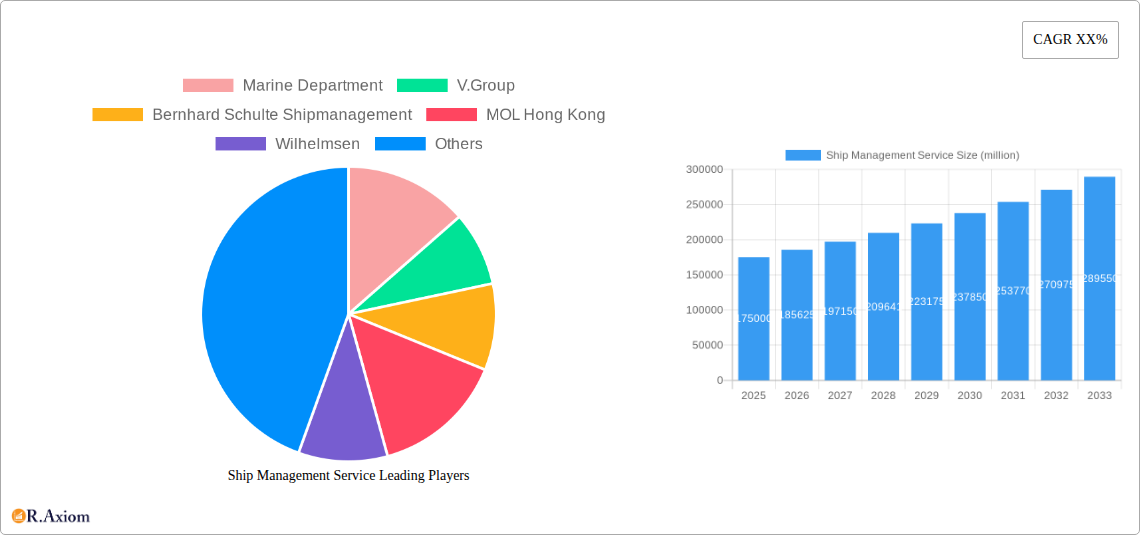
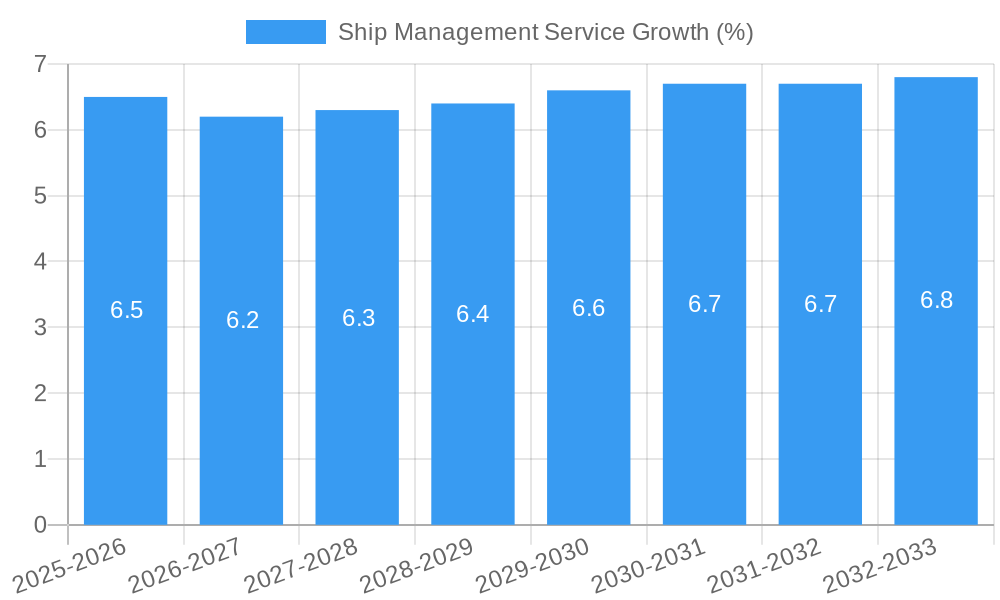
The global ship management service market is poised for significant expansion, projected to reach approximately $175 billion by 2025 and exhibit a compound annual growth rate (CAGR) of around 6.5% through 2033. This robust growth is fueled by increasing complexities in maritime regulations, the burgeoning demand for specialized vessels like LNG carriers and container ships, and the continuous need for operational efficiency and cost optimization across diverse shipping segments. The growing emphasis on stringent environmental compliance, safety standards, and the adoption of advanced digital technologies in fleet operations further bolster market momentum. Key drivers include the rising volume of global trade, necessitating larger and more efficiently managed fleets, and the strategic outsourcing of technical and commercial ship management functions by shipowners to specialized service providers. This trend is particularly pronounced in regions with high maritime activity and a strong presence of shipping companies seeking to leverage expertise and economies of scale.
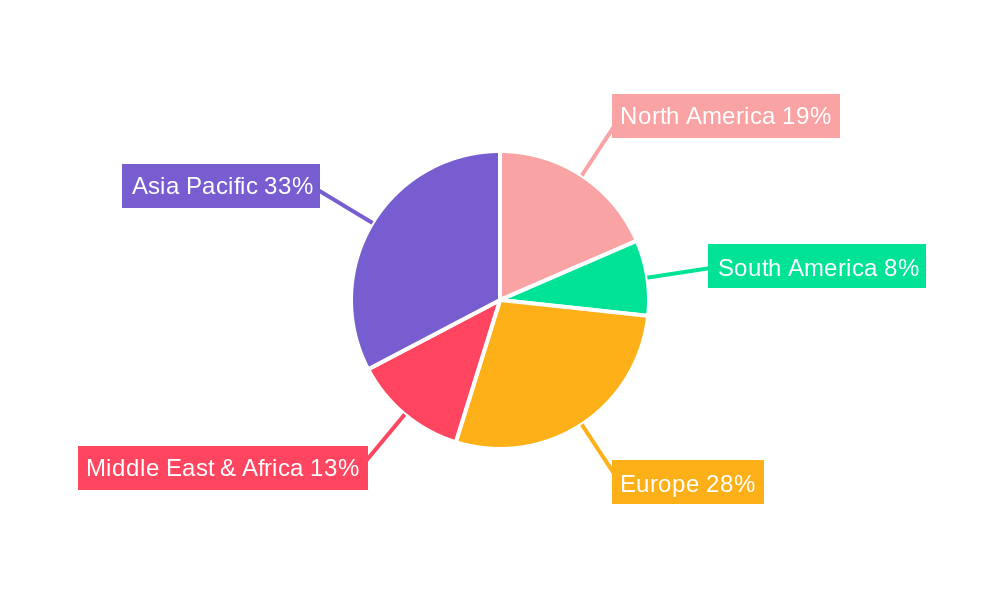
The market is segmented by application into Dry Bulk Carrier, Container Ship, and Tanker Shipping, with Container Ships likely to represent a substantial share due to the ongoing boom in global e-commerce and trade volumes. Operational Ship Management and Commercial Ship Management form the core service types, with both experiencing steady demand. Geographically, the Asia Pacific region is anticipated to emerge as a dominant force, driven by China's extensive shipbuilding capabilities and expanding fleet, alongside significant maritime trade hubs in Southeast Asia and India. Europe, with its well-established shipping legacy and stringent regulatory framework, will remain a crucial market, while North America and other regions contribute steadily. Restraints such as high operational costs, geopolitical uncertainties affecting trade routes, and the initial investment required for technological integration may temper growth, but the overarching trend points towards a dynamic and expanding ship management service sector.
This comprehensive report offers an in-depth analysis of the global Ship Management Service market, encompassing a detailed examination of market dynamics, growth drivers, segmentation, and strategic outlook. Spanning the study period of 2019–2033, with a focus on the base year 2025 and forecast period 2025–2033, this report provides actionable insights for industry stakeholders, including shipowners, operators, service providers, and investors. We delve into critical aspects such as market concentration, technological advancements, regulatory landscapes, and the competitive ecosystem, armed with robust data and analysis to guide your strategic decisions.
Ship Management Service Market Concentration & Innovation
The global Ship Management Service market is characterized by a moderate to high level of concentration, with a significant portion of the market share held by established players. In 2025, the top ten companies are projected to control approximately 65% of the market revenue, estimated at over five hundred million dollars. Innovation is a key differentiator, driven by the increasing demand for advanced technological solutions for efficiency, safety, and environmental compliance. Key innovation drivers include the adoption of digitalization, automation, big data analytics for predictive maintenance, and the implementation of greener shipping technologies. Regulatory frameworks, such as those from the International Maritime Organization (IMO), are continuously evolving, pushing for stricter environmental standards and safety protocols, thereby influencing service offerings and operational practices. Product substitutes are limited, with the core services being essential for vessel operation, but alternative service models, such as in-house management versus outsourced solutions, present a form of substitution. End-user trends indicate a growing preference for integrated and customized ship management solutions that encompass both operational and commercial aspects, aiming to optimize operational costs and enhance profitability. Mergers and acquisitions (M&A) activity is a notable trend, with an estimated total deal value of over one hundred million dollars in the historical period (2019-2024), as larger entities seek to consolidate their market position, expand their service portfolios, and achieve economies of scale.
Ship Management Service Industry Trends & Insights
The global Ship Management Service market is experiencing robust growth, projected to witness a Compound Annual Growth Rate (CAGR) of approximately 7.5% during the forecast period of 2025–2033. This expansion is propelled by several key market growth drivers. The surge in global trade volumes, particularly in emerging economies, directly translates to an increased demand for shipping services and, consequently, professional ship management. The growing complexity of vessel operations, coupled with stringent international regulations concerning safety, security, and environmental protection (e.g., emissions reduction targets), necessitates specialized expertise and advanced management capabilities, further fueling the demand for outsourced ship management services. Technological disruptions are rapidly reshaping the industry. The adoption of digital technologies, including the Internet of Things (IoT) for real-time monitoring, artificial intelligence (AI) for optimizing routes and fuel consumption, and blockchain for enhanced transparency and supply chain management, is becoming indispensable. These innovations not only improve operational efficiency but also contribute to cost savings and enhanced vessel performance. Consumer preferences are evolving towards integrated service providers who can offer a comprehensive suite of solutions, encompassing technical management, crew management, commercial management, and increasingly, digital services. This shift towards a one-stop-shop approach is a significant trend. Competitive dynamics are intensifying, with a constant focus on service quality, cost-effectiveness, and technological integration. Companies are investing heavily in R&D to stay ahead of the curve, and strategic partnerships are becoming common to leverage complementary strengths. Market penetration of specialized digital solutions is expected to reach over 60% by 2033, indicating a significant shift in how ship management services are delivered and consumed. The overall market size in 2025 is estimated to be over ten billion dollars, with substantial growth anticipated in the coming years, driven by these intertwined trends.
Dominant Markets & Segments in Ship Management Service
The global Ship Management Service market exhibits distinct regional dominance and segment preferences. North America and Europe currently represent the largest markets, accounting for over 50% of the total market revenue in 2025, driven by established shipping industries, stringent regulatory compliance, and a high adoption rate of advanced management technologies. Asia-Pacific is the fastest-growing region, with an anticipated CAGR of over 8% due to the expansion of maritime trade, increasing shipbuilding activities, and a growing number of shipowners seeking professional management solutions. Within this region, China and Singapore are emerging as significant hubs.
Application Segmentation Dominance:
- Container Ship: This segment is a dominant force, projected to account for over 35% of the market share in 2025. The sheer volume of global containerized trade, coupled with the complexity of managing large fleets of container vessels, necessitates sophisticated operational and commercial management. Key drivers include the growth of e-commerce and global supply chains.
- Tanker Shipping: Holding a substantial market share of approximately 30%, tanker shipping remains a critical segment. The global demand for oil, gas, and chemical transportation, coupled with the highly specialized safety and environmental requirements for managing these vessels, drives the demand for expert ship management services. Economic policies influencing energy consumption and production significantly impact this segment.
- Dry Bulk Carrier: This segment, representing around 25% of the market, is driven by the global demand for commodities such as iron ore, coal, and grains. The cyclical nature of commodity markets and the vast number of dry bulk vessels worldwide contribute to its significance. Infrastructure development in emerging economies is a key driver.
- Others: This segment, encompassing specialized vessels like LNG carriers, offshore support vessels, and ferries, is growing steadily, driven by niche market demands and technological advancements in specific vessel types.
Type Segmentation Dominance:
- Operational Ship Management: This remains the cornerstone of ship management, with an estimated market share of over 60% in 2025. It encompasses all technical aspects of vessel operation, including maintenance, repair, safety, and compliance. The increasing complexity of vessel technology and stringent safety regulations are major drivers.
- Commercial Ship Management: This segment, accounting for approximately 35% of the market, focuses on the commercial aspects of vessel operation, including chartering, marketing, and financial management. The pursuit of optimized profitability and efficient vessel utilization drives its importance.
Ship Management Service Product Developments
Product developments in the Ship Management Service market are increasingly focused on digitalization, automation, and sustainability. Companies are launching advanced fleet management platforms that integrate real-time data analytics for predictive maintenance, optimizing fuel efficiency, and enhancing crew welfare. The competitive advantage lies in offering integrated solutions that streamline operations, reduce costs, and ensure compliance with evolving environmental regulations. Emerging technologies like AI-powered route optimization and remote vessel monitoring are gaining traction, allowing for more efficient and proactive management.
Report Scope & Segmentation Analysis
This report provides a granular analysis of the Ship Management Service market, segmented across key applications and management types.
- Dry Bulk Carrier: This segment encompasses the management of vessels transporting dry bulk commodities. The market is projected for a CAGR of approximately 6.8% from 2025 to 2033, with a market size estimated at over two billion dollars in 2025. Competitive dynamics are driven by operational efficiency and cost-effectiveness.
- Container Ship: Management of container vessels is a significant segment, expected to grow at a CAGR of around 7.2% during the forecast period, with a market size exceeding three billion dollars in 2025. Growth is fueled by global trade and e-commerce.
- Tanker Shipping: This segment, crucial for energy transportation, is projected for a CAGR of approximately 7.0%, with a market size of over three billion dollars in 2025. Safety and environmental compliance are paramount.
- Others: This segment includes specialized vessels, with an anticipated CAGR of 7.7% and a market size of over one billion dollars in 2025, driven by niche demands and technological innovation.
- Operational Ship Management: This type of management is expected to maintain a dominant share, growing at a CAGR of around 7.3%, with a market size exceeding seven billion dollars in 2025. The focus is on technical expertise and regulatory adherence.
- Commercial Ship Management: This segment is projected for a CAGR of about 6.9%, with a market size of over three billion dollars in 2025. Its growth is tied to optimizing vessel profitability and market access.
Key Drivers of Ship Management Service Growth
The growth of the Ship Management Service market is underpinned by several compelling factors. Technological advancements are at the forefront, with the widespread adoption of digitalization, AI, and IoT leading to enhanced operational efficiency, predictive maintenance, and significant cost savings. Increasing global trade volumes, particularly in emerging markets, directly translate into higher demand for shipping services and, consequently, professional ship management. Stringent environmental regulations, such as IMO 2020 and future decarbonization targets, necessitate specialized expertise and investment in sustainable technologies, pushing shipowners towards outsourced solutions. Economic growth and energy demand continue to fuel the tanker and dry bulk segments, while sophistication in vessel technology requires specialized technical know-how that many owners find more cost-effective to outsource.
Challenges in the Ship Management Service Sector
Despite the robust growth, the Ship Management Service sector faces several challenges. Navigating complex and evolving regulatory frameworks across different jurisdictions requires constant vigilance and expertise, posing a significant compliance burden. Geopolitical instability and trade disputes can disrupt shipping routes and impact cargo volumes, leading to uncertainty and operational challenges. Shortages of skilled maritime labor remain a persistent issue, impacting crew retention and operational continuity. Cybersecurity threats are an increasing concern, as the digital transformation of shipping operations opens new vulnerabilities. Furthermore, intense price competition among service providers can put pressure on profit margins, particularly for standard services.
Emerging Opportunities in Ship Management Service
The Ship Management Service market is ripe with emerging opportunities. The growing demand for greener shipping solutions presents a significant avenue for growth, with opportunities in managing vessels powered by alternative fuels and implementing energy-efficient technologies. The digitalization of the maritime industry continues to create opportunities for providers offering advanced data analytics, AI-driven decision-making tools, and integrated fleet management systems. The expansion of new trade routes and emerging economies offers untapped market potential. Furthermore, the increasing complexity of offshore energy exploration and production is driving demand for specialized offshore vessel management services. The trend towards boutique and specialized management services catering to niche segments also represents a significant opportunity for differentiation.
Leading Players in the Ship Management Service Market
- Marine Department
- V.Group
- Bernhard Schulte Shipmanagement
- MOL Hong Kong
- Wilhelmsen
- MISC Group
- Seacon Shipping Group
- Synergy
- Matrix
- Humboldt
- Tamar
- Crowley
- OSM Thome
- Fleet Management
- AW Ship Management
- MTT Shipping
- Uniteam Marine
- TOTE Services
- Uni-Asia Group
Key Developments in Ship Management Service Industry
- 2023: Increased focus on digitalization and AI integration for enhanced fleet performance and predictive maintenance across major players.
- 2023: Significant M&A activity, with consolidations aimed at expanding service portfolios and global reach.
- 2022: Growing adoption of decarbonization technologies and alternative fuel solutions in ship management strategies.
- 2022: Enhanced cybersecurity measures implemented in response to rising threats in the maritime sector.
- 2021: Renewed emphasis on crew welfare and mental health support, driven by industry-wide challenges.
- 2020: Adaptation to new IMO regulations and increased focus on emissions reduction strategies.
- 2019: Initial stages of widespread adoption of IoT devices for real-time vessel monitoring and data collection.
Strategic Outlook for Ship Management Service Market
The strategic outlook for the Ship Management Service market remains exceptionally positive, driven by sustained global trade growth and the imperative for operational efficiency and environmental compliance. Companies that invest in and effectively leverage cutting-edge digital technologies, such as AI and big data analytics, will be best positioned to capitalize on future opportunities. The increasing demand for sustainable shipping solutions presents a significant growth catalyst, encouraging the development and management of vessels utilizing alternative fuels and eco-friendly technologies. Furthermore, strategic partnerships and targeted M&A activities will continue to shape the competitive landscape, enabling companies to expand their service offerings, geographic reach, and technological capabilities. Proactive adaptation to evolving regulatory frameworks and a strong focus on talent development will be crucial for long-term success in this dynamic market.
Ship Management Service Segmentation
-
1. Application
- 1.1. Dry Bulk Carrier
- 1.2. Container Ship
- 1.3. Tanker Shipping
- 1.4. Others
-
2. Types
- 2.1. Operational Ship Management
- 2.2. Commercial Ship Management
Ship Management Service Segmentation By Geography
-
1. North America
- 1.1. United States
- 1.2. Canada
- 1.3. Mexico
-
2. South America
- 2.1. Brazil
- 2.2. Argentina
- 2.3. Rest of South America
-
3. Europe
- 3.1. United Kingdom
- 3.2. Germany
- 3.3. France
- 3.4. Italy
- 3.5. Spain
- 3.6. Russia
- 3.7. Benelux
- 3.8. Nordics
- 3.9. Rest of Europe
-
4. Middle East & Africa
- 4.1. Turkey
- 4.2. Israel
- 4.3. GCC
- 4.4. North Africa
- 4.5. South Africa
- 4.6. Rest of Middle East & Africa
-
5. Asia Pacific
- 5.1. China
- 5.2. India
- 5.3. Japan
- 5.4. South Korea
- 5.5. ASEAN
- 5.6. Oceania
- 5.7. Rest of Asia Pacific
Ship Management Service REPORT HIGHLIGHTS
| Aspects | Details |
|---|---|
| Study Period | 2019-2033 |
| Base Year | 2024 |
| Estimated Year | 2025 |
| Forecast Period | 2025-2033 |
| Historical Period | 2019-2024 |
| Growth Rate | CAGR of XX% from 2019-2033 |
| Segmentation |
|
Table of Contents
- 1. Introduction
- 1.1. Research Scope
- 1.2. Market Segmentation
- 1.3. Research Methodology
- 1.4. Definitions and Assumptions
- 2. Executive Summary
- 2.1. Introduction
- 3. Market Dynamics
- 3.1. Introduction
- 3.2. Market Drivers
- 3.3. Market Restrains
- 3.4. Market Trends
- 4. Market Factor Analysis
- 4.1. Porters Five Forces
- 4.2. Supply/Value Chain
- 4.3. PESTEL analysis
- 4.4. Market Entropy
- 4.5. Patent/Trademark Analysis
- 5. Global Ship Management Service Analysis, Insights and Forecast, 2019-2031
- 5.1. Market Analysis, Insights and Forecast - by Application
- 5.1.1. Dry Bulk Carrier
- 5.1.2. Container Ship
- 5.1.3. Tanker Shipping
- 5.1.4. Others
- 5.2. Market Analysis, Insights and Forecast - by Types
- 5.2.1. Operational Ship Management
- 5.2.2. Commercial Ship Management
- 5.3. Market Analysis, Insights and Forecast - by Region
- 5.3.1. North America
- 5.3.2. South America
- 5.3.3. Europe
- 5.3.4. Middle East & Africa
- 5.3.5. Asia Pacific
- 5.1. Market Analysis, Insights and Forecast - by Application
- 6. North America Ship Management Service Analysis, Insights and Forecast, 2019-2031
- 6.1. Market Analysis, Insights and Forecast - by Application
- 6.1.1. Dry Bulk Carrier
- 6.1.2. Container Ship
- 6.1.3. Tanker Shipping
- 6.1.4. Others
- 6.2. Market Analysis, Insights and Forecast - by Types
- 6.2.1. Operational Ship Management
- 6.2.2. Commercial Ship Management
- 6.1. Market Analysis, Insights and Forecast - by Application
- 7. South America Ship Management Service Analysis, Insights and Forecast, 2019-2031
- 7.1. Market Analysis, Insights and Forecast - by Application
- 7.1.1. Dry Bulk Carrier
- 7.1.2. Container Ship
- 7.1.3. Tanker Shipping
- 7.1.4. Others
- 7.2. Market Analysis, Insights and Forecast - by Types
- 7.2.1. Operational Ship Management
- 7.2.2. Commercial Ship Management
- 7.1. Market Analysis, Insights and Forecast - by Application
- 8. Europe Ship Management Service Analysis, Insights and Forecast, 2019-2031
- 8.1. Market Analysis, Insights and Forecast - by Application
- 8.1.1. Dry Bulk Carrier
- 8.1.2. Container Ship
- 8.1.3. Tanker Shipping
- 8.1.4. Others
- 8.2. Market Analysis, Insights and Forecast - by Types
- 8.2.1. Operational Ship Management
- 8.2.2. Commercial Ship Management
- 8.1. Market Analysis, Insights and Forecast - by Application
- 9. Middle East & Africa Ship Management Service Analysis, Insights and Forecast, 2019-2031
- 9.1. Market Analysis, Insights and Forecast - by Application
- 9.1.1. Dry Bulk Carrier
- 9.1.2. Container Ship
- 9.1.3. Tanker Shipping
- 9.1.4. Others
- 9.2. Market Analysis, Insights and Forecast - by Types
- 9.2.1. Operational Ship Management
- 9.2.2. Commercial Ship Management
- 9.1. Market Analysis, Insights and Forecast - by Application
- 10. Asia Pacific Ship Management Service Analysis, Insights and Forecast, 2019-2031
- 10.1. Market Analysis, Insights and Forecast - by Application
- 10.1.1. Dry Bulk Carrier
- 10.1.2. Container Ship
- 10.1.3. Tanker Shipping
- 10.1.4. Others
- 10.2. Market Analysis, Insights and Forecast - by Types
- 10.2.1. Operational Ship Management
- 10.2.2. Commercial Ship Management
- 10.1. Market Analysis, Insights and Forecast - by Application
- 11. Competitive Analysis
- 11.1. Global Market Share Analysis 2024
- 11.2. Company Profiles
- 11.2.1 Marine Department
- 11.2.1.1. Overview
- 11.2.1.2. Products
- 11.2.1.3. SWOT Analysis
- 11.2.1.4. Recent Developments
- 11.2.1.5. Financials (Based on Availability)
- 11.2.2 V.Group
- 11.2.2.1. Overview
- 11.2.2.2. Products
- 11.2.2.3. SWOT Analysis
- 11.2.2.4. Recent Developments
- 11.2.2.5. Financials (Based on Availability)
- 11.2.3 Bernhard Schulte Shipmanagement
- 11.2.3.1. Overview
- 11.2.3.2. Products
- 11.2.3.3. SWOT Analysis
- 11.2.3.4. Recent Developments
- 11.2.3.5. Financials (Based on Availability)
- 11.2.4 MOL Hong Kong
- 11.2.4.1. Overview
- 11.2.4.2. Products
- 11.2.4.3. SWOT Analysis
- 11.2.4.4. Recent Developments
- 11.2.4.5. Financials (Based on Availability)
- 11.2.5 Wilhelmsen
- 11.2.5.1. Overview
- 11.2.5.2. Products
- 11.2.5.3. SWOT Analysis
- 11.2.5.4. Recent Developments
- 11.2.5.5. Financials (Based on Availability)
- 11.2.6 MISC Group
- 11.2.6.1. Overview
- 11.2.6.2. Products
- 11.2.6.3. SWOT Analysis
- 11.2.6.4. Recent Developments
- 11.2.6.5. Financials (Based on Availability)
- 11.2.7 Seacon Shipping Group
- 11.2.7.1. Overview
- 11.2.7.2. Products
- 11.2.7.3. SWOT Analysis
- 11.2.7.4. Recent Developments
- 11.2.7.5. Financials (Based on Availability)
- 11.2.8 Synergy
- 11.2.8.1. Overview
- 11.2.8.2. Products
- 11.2.8.3. SWOT Analysis
- 11.2.8.4. Recent Developments
- 11.2.8.5. Financials (Based on Availability)
- 11.2.9 Matrix
- 11.2.9.1. Overview
- 11.2.9.2. Products
- 11.2.9.3. SWOT Analysis
- 11.2.9.4. Recent Developments
- 11.2.9.5. Financials (Based on Availability)
- 11.2.10 Humboldt
- 11.2.10.1. Overview
- 11.2.10.2. Products
- 11.2.10.3. SWOT Analysis
- 11.2.10.4. Recent Developments
- 11.2.10.5. Financials (Based on Availability)
- 11.2.11 Tamar
- 11.2.11.1. Overview
- 11.2.11.2. Products
- 11.2.11.3. SWOT Analysis
- 11.2.11.4. Recent Developments
- 11.2.11.5. Financials (Based on Availability)
- 11.2.12 Crowley
- 11.2.12.1. Overview
- 11.2.12.2. Products
- 11.2.12.3. SWOT Analysis
- 11.2.12.4. Recent Developments
- 11.2.12.5. Financials (Based on Availability)
- 11.2.13 OSM Thome
- 11.2.13.1. Overview
- 11.2.13.2. Products
- 11.2.13.3. SWOT Analysis
- 11.2.13.4. Recent Developments
- 11.2.13.5. Financials (Based on Availability)
- 11.2.14 Fleet Management
- 11.2.14.1. Overview
- 11.2.14.2. Products
- 11.2.14.3. SWOT Analysis
- 11.2.14.4. Recent Developments
- 11.2.14.5. Financials (Based on Availability)
- 11.2.15 AW Ship Management
- 11.2.15.1. Overview
- 11.2.15.2. Products
- 11.2.15.3. SWOT Analysis
- 11.2.15.4. Recent Developments
- 11.2.15.5. Financials (Based on Availability)
- 11.2.16 MTT Shipping
- 11.2.16.1. Overview
- 11.2.16.2. Products
- 11.2.16.3. SWOT Analysis
- 11.2.16.4. Recent Developments
- 11.2.16.5. Financials (Based on Availability)
- 11.2.17 Uniteam Marine
- 11.2.17.1. Overview
- 11.2.17.2. Products
- 11.2.17.3. SWOT Analysis
- 11.2.17.4. Recent Developments
- 11.2.17.5. Financials (Based on Availability)
- 11.2.18 TOTE Services
- 11.2.18.1. Overview
- 11.2.18.2. Products
- 11.2.18.3. SWOT Analysis
- 11.2.18.4. Recent Developments
- 11.2.18.5. Financials (Based on Availability)
- 11.2.19 Uni-Asia Group
- 11.2.19.1. Overview
- 11.2.19.2. Products
- 11.2.19.3. SWOT Analysis
- 11.2.19.4. Recent Developments
- 11.2.19.5. Financials (Based on Availability)
- 11.2.1 Marine Department
List of Figures
- Figure 1: Global Ship Management Service Revenue Breakdown (million, %) by Region 2024 & 2032
- Figure 2: North America Ship Management Service Revenue (million), by Application 2024 & 2032
- Figure 3: North America Ship Management Service Revenue Share (%), by Application 2024 & 2032
- Figure 4: North America Ship Management Service Revenue (million), by Types 2024 & 2032
- Figure 5: North America Ship Management Service Revenue Share (%), by Types 2024 & 2032
- Figure 6: North America Ship Management Service Revenue (million), by Country 2024 & 2032
- Figure 7: North America Ship Management Service Revenue Share (%), by Country 2024 & 2032
- Figure 8: South America Ship Management Service Revenue (million), by Application 2024 & 2032
- Figure 9: South America Ship Management Service Revenue Share (%), by Application 2024 & 2032
- Figure 10: South America Ship Management Service Revenue (million), by Types 2024 & 2032
- Figure 11: South America Ship Management Service Revenue Share (%), by Types 2024 & 2032
- Figure 12: South America Ship Management Service Revenue (million), by Country 2024 & 2032
- Figure 13: South America Ship Management Service Revenue Share (%), by Country 2024 & 2032
- Figure 14: Europe Ship Management Service Revenue (million), by Application 2024 & 2032
- Figure 15: Europe Ship Management Service Revenue Share (%), by Application 2024 & 2032
- Figure 16: Europe Ship Management Service Revenue (million), by Types 2024 & 2032
- Figure 17: Europe Ship Management Service Revenue Share (%), by Types 2024 & 2032
- Figure 18: Europe Ship Management Service Revenue (million), by Country 2024 & 2032
- Figure 19: Europe Ship Management Service Revenue Share (%), by Country 2024 & 2032
- Figure 20: Middle East & Africa Ship Management Service Revenue (million), by Application 2024 & 2032
- Figure 21: Middle East & Africa Ship Management Service Revenue Share (%), by Application 2024 & 2032
- Figure 22: Middle East & Africa Ship Management Service Revenue (million), by Types 2024 & 2032
- Figure 23: Middle East & Africa Ship Management Service Revenue Share (%), by Types 2024 & 2032
- Figure 24: Middle East & Africa Ship Management Service Revenue (million), by Country 2024 & 2032
- Figure 25: Middle East & Africa Ship Management Service Revenue Share (%), by Country 2024 & 2032
- Figure 26: Asia Pacific Ship Management Service Revenue (million), by Application 2024 & 2032
- Figure 27: Asia Pacific Ship Management Service Revenue Share (%), by Application 2024 & 2032
- Figure 28: Asia Pacific Ship Management Service Revenue (million), by Types 2024 & 2032
- Figure 29: Asia Pacific Ship Management Service Revenue Share (%), by Types 2024 & 2032
- Figure 30: Asia Pacific Ship Management Service Revenue (million), by Country 2024 & 2032
- Figure 31: Asia Pacific Ship Management Service Revenue Share (%), by Country 2024 & 2032
List of Tables
- Table 1: Global Ship Management Service Revenue million Forecast, by Region 2019 & 2032
- Table 2: Global Ship Management Service Revenue million Forecast, by Application 2019 & 2032
- Table 3: Global Ship Management Service Revenue million Forecast, by Types 2019 & 2032
- Table 4: Global Ship Management Service Revenue million Forecast, by Region 2019 & 2032
- Table 5: Global Ship Management Service Revenue million Forecast, by Application 2019 & 2032
- Table 6: Global Ship Management Service Revenue million Forecast, by Types 2019 & 2032
- Table 7: Global Ship Management Service Revenue million Forecast, by Country 2019 & 2032
- Table 8: United States Ship Management Service Revenue (million) Forecast, by Application 2019 & 2032
- Table 9: Canada Ship Management Service Revenue (million) Forecast, by Application 2019 & 2032
- Table 10: Mexico Ship Management Service Revenue (million) Forecast, by Application 2019 & 2032
- Table 11: Global Ship Management Service Revenue million Forecast, by Application 2019 & 2032
- Table 12: Global Ship Management Service Revenue million Forecast, by Types 2019 & 2032
- Table 13: Global Ship Management Service Revenue million Forecast, by Country 2019 & 2032
- Table 14: Brazil Ship Management Service Revenue (million) Forecast, by Application 2019 & 2032
- Table 15: Argentina Ship Management Service Revenue (million) Forecast, by Application 2019 & 2032
- Table 16: Rest of South America Ship Management Service Revenue (million) Forecast, by Application 2019 & 2032
- Table 17: Global Ship Management Service Revenue million Forecast, by Application 2019 & 2032
- Table 18: Global Ship Management Service Revenue million Forecast, by Types 2019 & 2032
- Table 19: Global Ship Management Service Revenue million Forecast, by Country 2019 & 2032
- Table 20: United Kingdom Ship Management Service Revenue (million) Forecast, by Application 2019 & 2032
- Table 21: Germany Ship Management Service Revenue (million) Forecast, by Application 2019 & 2032
- Table 22: France Ship Management Service Revenue (million) Forecast, by Application 2019 & 2032
- Table 23: Italy Ship Management Service Revenue (million) Forecast, by Application 2019 & 2032
- Table 24: Spain Ship Management Service Revenue (million) Forecast, by Application 2019 & 2032
- Table 25: Russia Ship Management Service Revenue (million) Forecast, by Application 2019 & 2032
- Table 26: Benelux Ship Management Service Revenue (million) Forecast, by Application 2019 & 2032
- Table 27: Nordics Ship Management Service Revenue (million) Forecast, by Application 2019 & 2032
- Table 28: Rest of Europe Ship Management Service Revenue (million) Forecast, by Application 2019 & 2032
- Table 29: Global Ship Management Service Revenue million Forecast, by Application 2019 & 2032
- Table 30: Global Ship Management Service Revenue million Forecast, by Types 2019 & 2032
- Table 31: Global Ship Management Service Revenue million Forecast, by Country 2019 & 2032
- Table 32: Turkey Ship Management Service Revenue (million) Forecast, by Application 2019 & 2032
- Table 33: Israel Ship Management Service Revenue (million) Forecast, by Application 2019 & 2032
- Table 34: GCC Ship Management Service Revenue (million) Forecast, by Application 2019 & 2032
- Table 35: North Africa Ship Management Service Revenue (million) Forecast, by Application 2019 & 2032
- Table 36: South Africa Ship Management Service Revenue (million) Forecast, by Application 2019 & 2032
- Table 37: Rest of Middle East & Africa Ship Management Service Revenue (million) Forecast, by Application 2019 & 2032
- Table 38: Global Ship Management Service Revenue million Forecast, by Application 2019 & 2032
- Table 39: Global Ship Management Service Revenue million Forecast, by Types 2019 & 2032
- Table 40: Global Ship Management Service Revenue million Forecast, by Country 2019 & 2032
- Table 41: China Ship Management Service Revenue (million) Forecast, by Application 2019 & 2032
- Table 42: India Ship Management Service Revenue (million) Forecast, by Application 2019 & 2032
- Table 43: Japan Ship Management Service Revenue (million) Forecast, by Application 2019 & 2032
- Table 44: South Korea Ship Management Service Revenue (million) Forecast, by Application 2019 & 2032
- Table 45: ASEAN Ship Management Service Revenue (million) Forecast, by Application 2019 & 2032
- Table 46: Oceania Ship Management Service Revenue (million) Forecast, by Application 2019 & 2032
- Table 47: Rest of Asia Pacific Ship Management Service Revenue (million) Forecast, by Application 2019 & 2032
Frequently Asked Questions
1. What is the projected Compound Annual Growth Rate (CAGR) of the Ship Management Service?
The projected CAGR is approximately XX%.
2. Which companies are prominent players in the Ship Management Service?
Key companies in the market include Marine Department, V.Group, Bernhard Schulte Shipmanagement, MOL Hong Kong, Wilhelmsen, MISC Group, Seacon Shipping Group, Synergy, Matrix, Humboldt, Tamar, Crowley, OSM Thome, Fleet Management, AW Ship Management, MTT Shipping, Uniteam Marine, TOTE Services, Uni-Asia Group.
3. What are the main segments of the Ship Management Service?
The market segments include Application, Types.
4. Can you provide details about the market size?
The market size is estimated to be USD XXX million as of 2022.
5. What are some drivers contributing to market growth?
N/A
6. What are the notable trends driving market growth?
N/A
7. Are there any restraints impacting market growth?
N/A
8. Can you provide examples of recent developments in the market?
N/A
9. What pricing options are available for accessing the report?
Pricing options include single-user, multi-user, and enterprise licenses priced at USD 3950.00, USD 5925.00, and USD 7900.00 respectively.
10. Is the market size provided in terms of value or volume?
The market size is provided in terms of value, measured in million.
11. Are there any specific market keywords associated with the report?
Yes, the market keyword associated with the report is "Ship Management Service," which aids in identifying and referencing the specific market segment covered.
12. How do I determine which pricing option suits my needs best?
The pricing options vary based on user requirements and access needs. Individual users may opt for single-user licenses, while businesses requiring broader access may choose multi-user or enterprise licenses for cost-effective access to the report.
13. Are there any additional resources or data provided in the Ship Management Service report?
While the report offers comprehensive insights, it's advisable to review the specific contents or supplementary materials provided to ascertain if additional resources or data are available.
14. How can I stay updated on further developments or reports in the Ship Management Service?
To stay informed about further developments, trends, and reports in the Ship Management Service, consider subscribing to industry newsletters, following relevant companies and organizations, or regularly checking reputable industry news sources and publications.
Methodology
Step 1 - Identification of Relevant Samples Size from Population Database


Step 2 - Approaches for Defining Global Market Size (Value, Volume* & Price*)

Note*: In applicable scenarios
Step 3 - Data Sources
Primary Research
- Web Analytics
- Survey Reports
- Research Institute
- Latest Research Reports
- Opinion Leaders
Secondary Research
- Annual Reports
- White Paper
- Latest Press Release
- Industry Association
- Paid Database
- Investor Presentations

Step 4 - Data Triangulation
Involves using different sources of information in order to increase the validity of a study
These sources are likely to be stakeholders in a program - participants, other researchers, program staff, other community members, and so on.
Then we put all data in single framework & apply various statistical tools to find out the dynamic on the market.
During the analysis stage, feedback from the stakeholder groups would be compared to determine areas of agreement as well as areas of divergence


