
Key Insights
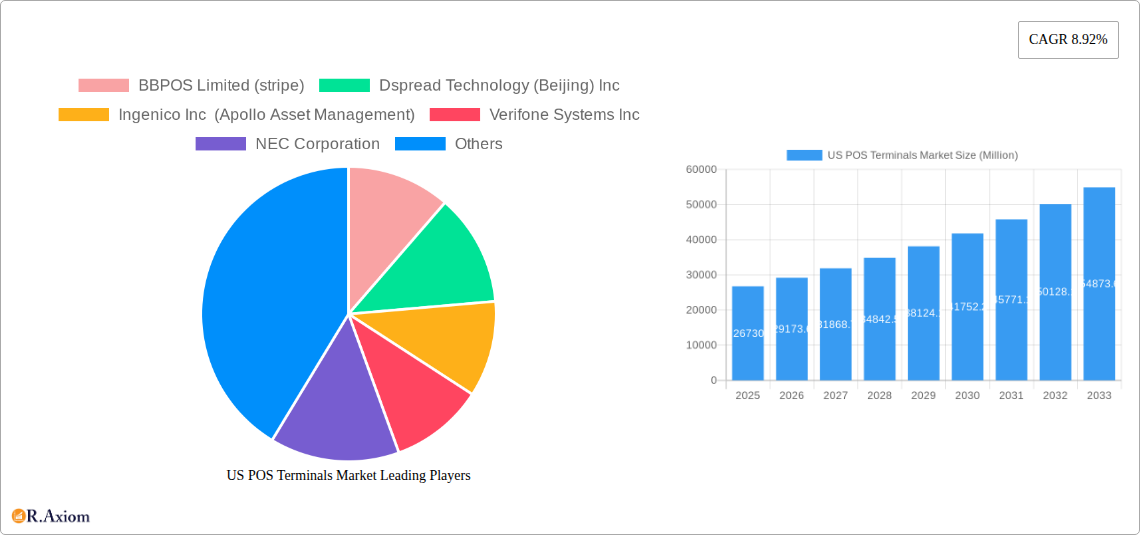
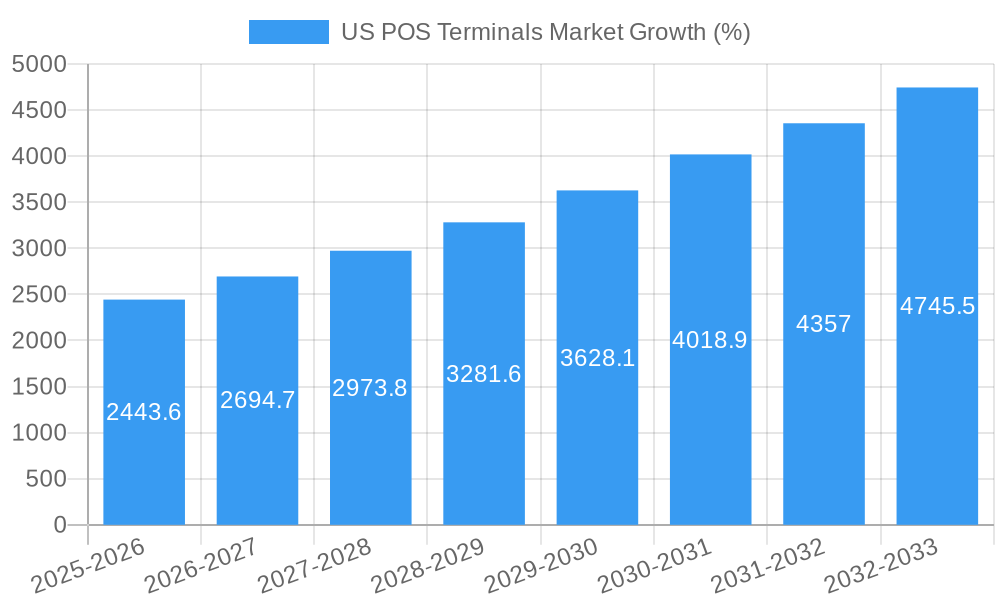
The US Point-of-Sale (POS) terminal market, valued at $26.73 billion in 2025, is poised for robust growth, projected to expand at a Compound Annual Growth Rate (CAGR) of 8.92% from 2025 to 2033. This growth is fueled by several key factors. The increasing adoption of digital payment methods across various industries like retail, hospitality, and healthcare is a significant driver. Consumers' preference for contactless payments, accelerated by the pandemic, continues to fuel demand for advanced POS systems. Furthermore, the rising need for efficient inventory management, improved customer service, and enhanced data analytics capabilities within businesses is driving the shift towards sophisticated POS terminals. The market is segmented by end-user industry (retail dominating), component (hardware, software, and services), and type (fixed and mobile/portable systems). Competition is fierce, with established players like Verifone and Ingenico alongside emerging companies like Square and BBPOS vying for market share through innovative features, integration capabilities, and competitive pricing strategies. The ongoing development of integrated payment solutions that streamline operations and provide valuable business insights contributes to the market's overall growth trajectory.
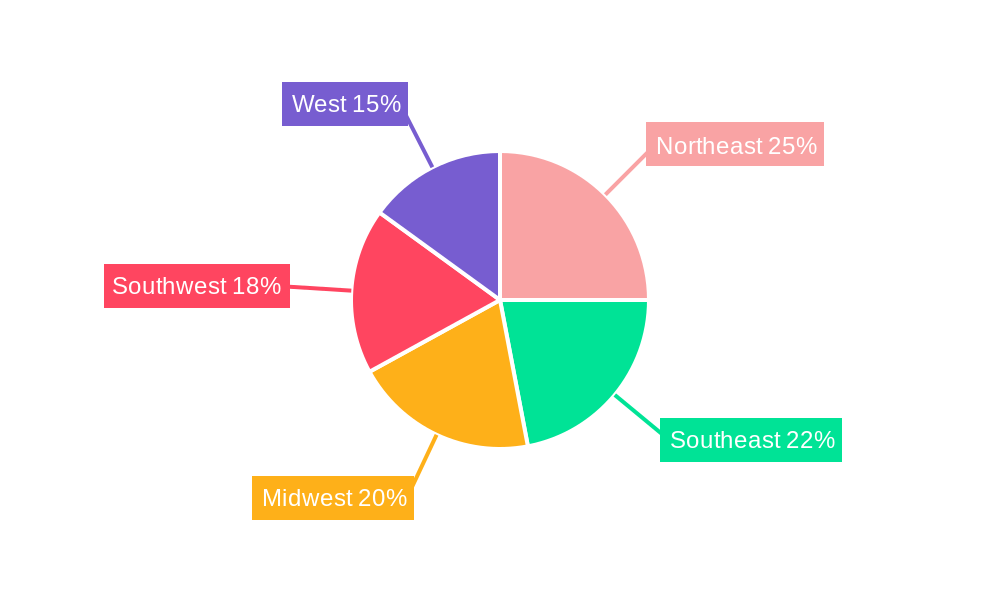
The regional breakdown within the US market shows strong performance across all regions (Northeast, Southeast, Midwest, Southwest, and West), reflecting widespread adoption across the country. However, regions with higher concentrations of retail businesses and a robust hospitality sector are likely to experience faster growth. While security concerns and the initial investment costs associated with upgrading to newer POS systems represent potential restraints, the long-term benefits in terms of operational efficiency, data-driven decision-making, and enhanced customer experience are outweighing these challenges. The market is expected to witness continuous innovation, with a focus on cloud-based solutions, improved security features, and greater integration with existing business systems, promising a dynamic landscape over the forecast period.
US POS Terminals Market: A Comprehensive Report (2019-2033)
This detailed report provides a comprehensive analysis of the US POS terminals market, covering market size, growth drivers, challenges, key players, and future outlook. The study period spans from 2019 to 2033, with 2025 as the base and estimated year. The report offers actionable insights for industry stakeholders, investors, and businesses operating within this dynamic sector.
US POS Terminals Market Concentration & Innovation
The US POS terminals market exhibits a moderately concentrated landscape, with key players holding significant market share. However, the market is also witnessing considerable innovation driven by technological advancements, evolving consumer preferences, and regulatory changes. The market share of the top five players is estimated to be around xx%, with Verifone Systems Inc and Square Capital LLC (Block Inc) holding leading positions. Mergers and acquisitions (M&A) have played a crucial role in shaping the market dynamics. Recent M&A deals valued at xx Million demonstrate the ongoing consolidation trend.
- Key Innovation Drivers: Cloud-based POS systems, mobile POS solutions, integration with loyalty programs and CRM systems, biometric authentication, and advanced security features.
- Regulatory Framework: PCI DSS compliance and data privacy regulations significantly impact the market.
- Product Substitutes: Digital wallets and contactless payment methods represent emerging substitutes.
- End-User Trends: Demand for integrated solutions offering enhanced functionality and streamlined operations is increasing.
- M&A Activity: Strategic acquisitions and mergers are reshaping the competitive landscape, fostering innovation and expanding market reach. For instance, the acquisition of xx by xx for xx Million in 2024 significantly altered the competitive landscape.
US POS Terminals Market Industry Trends & Insights
The US POS terminals market is experiencing robust growth, driven by the increasing adoption of digital payment methods, the expansion of e-commerce, and the rising demand for efficient point-of-sale solutions across various industries. The market is witnessing a significant shift towards mobile and cloud-based POS systems, fueled by the convenience and flexibility they offer. Consumer preferences are increasingly focused on seamless user experiences, integrated functionalities, and enhanced security features. The market is projected to achieve a Compound Annual Growth Rate (CAGR) of xx% during the forecast period (2025-2033). Market penetration is steadily rising, particularly among small and medium-sized businesses (SMBs) seeking to upgrade their payment processing capabilities. Technological disruptions, such as the introduction of new payment technologies and the increasing adoption of Artificial Intelligence (AI) and machine learning are creating new opportunities and competitive dynamics within the market.
Dominant Markets & Segments in US POS Terminals Market
The Retail segment dominates the US POS terminals market, driven by high transaction volumes and the need for efficient checkout processes. The hardware segment holds the largest market share due to the significant investment required in purchasing POS terminals. Within the POS terminal types, fixed Point-of-sale systems continue to be the dominant category, although the Mobile/Portable segment is experiencing the fastest growth due to its flexibility and portability.
- Retail Segment Drivers: High transaction volumes, growing adoption of omnichannel strategies, and demand for integrated inventory management systems.
- Hardware Segment Drivers: Advancements in processing speed, security features, and integration capabilities.
- Fixed Point-of-sale Systems Drivers: Reliability, established infrastructure, and ease of integration with existing systems.
- Mobile/Portable POS Systems Drivers: Flexibility, portability, and cost-effectiveness for mobile businesses.
US POS Terminals Market Product Developments
Recent product innovations focus on enhancing security, improving user experience, and integrating advanced functionalities. Cloud-based POS systems offer scalability and remote management capabilities, while mobile POS solutions cater to the growing demand for mobility and flexibility. Key technological trends include the integration of AI and machine learning for fraud detection and personalized customer experiences. The market is witnessing a shift towards subscription-based models, offering businesses flexible and cost-effective payment options.
Report Scope & Segmentation Analysis
This report segments the US POS terminals market by end-user industry (Retail, Hospitality, Healthcare, Other End-user Industries), component (Hardware, Software, Services), and type (Fixed Point-of-sale Systems, Mobile/Portable Point-of-sale Systems). Each segment is analyzed in detail, providing market size, growth projections, and competitive dynamics. The Retail segment is expected to maintain its dominance, while the Mobile/Portable POS systems segment will experience the highest growth rate. The software and services segments are expected to witness significant growth, driven by increased demand for integrated solutions and managed services.
Key Drivers of US POS Terminals Market Growth
Several factors contribute to the market's growth: increasing adoption of digital payments, expanding e-commerce, growing demand for integrated POS solutions, technological advancements (e.g., contactless payments, mobile POS), and government initiatives promoting digitalization. The rising need for efficient inventory management and customer relationship management further fuels market expansion.
Challenges in the US POS Terminals Market Sector
The market faces challenges like stringent data security regulations (e.g., PCI DSS compliance), high initial investment costs for businesses, the need for continuous software updates, and intense competition among vendors. Supply chain disruptions, particularly in the wake of global events, can impact the availability and pricing of POS terminals.
Emerging Opportunities in US POS Terminals Market
The market presents opportunities in areas like integrated payment gateways, advanced analytics for business insights, omnichannel commerce support, and the integration of loyalty programs. Expansion into underserved markets and the growing adoption of cloud-based and mobile POS systems offer significant potential. The increasing adoption of AI-powered solutions for fraud prevention and customer service also presents substantial opportunities.
Leading Players in the US POS Terminals Market Market
- BBPOS Limited (stripe) [BBPOS Website]
- Dspread Technology (Beijing) Inc
- Ingenico Inc (Apollo Asset Management) [Ingenico Website]
- Verifone Systems Inc [Verifone Website]
- NEC Corporation [NEC Website]
- SZZT Electronics Co Ltd
- Usa Technologies (Cantaloupe Inc ) [Cantaloupe Website]
- Square Capital LLC (Block Inc) [Square Website]
- PAX Technology Ltd [PAX Website]
- Castles Technology
Key Developments in US POS Terminals Market Industry
- June 2023: US Bank and Elavon launched the Talech Terminal payment solution, a simplified POS system for small businesses.
- January 2024: PAR Technology launched the PAR Wave POS Terminal, designed for the restaurant industry with a focus on functionality, performance, security, and innovative design.
Strategic Outlook for US POS Terminals Market Market
The US POS terminals market is poised for continued growth, driven by technological advancements, changing consumer preferences, and the increasing adoption of digital payments across various industries. The focus on cloud-based solutions, integrated functionalities, and enhanced security features will shape the market's future. Opportunities abound for companies that can deliver innovative, user-friendly, and secure POS solutions that cater to the evolving needs of businesses of all sizes.
US POS Terminals Market Segmentation
-
1. Component
- 1.1. Hardware
- 1.2. Software
- 1.3. Services
-
2. Type
- 2.1. Fixed Point-of-sale Systems
- 2.2. Mobile/Portable Point-of-sale Systems
-
3. End-user Industry
- 3.1. Retail
- 3.2. Hospitality
- 3.3. Healthcare
- 3.4. Other End-user Industries
US POS Terminals Market Segmentation By Geography
-
1. North America
- 1.1. United States
- 1.2. Canada
- 1.3. Mexico
-
2. South America
- 2.1. Brazil
- 2.2. Argentina
- 2.3. Rest of South America
-
3. Europe
- 3.1. United Kingdom
- 3.2. Germany
- 3.3. France
- 3.4. Italy
- 3.5. Spain
- 3.6. Russia
- 3.7. Benelux
- 3.8. Nordics
- 3.9. Rest of Europe
-
4. Middle East & Africa
- 4.1. Turkey
- 4.2. Israel
- 4.3. GCC
- 4.4. North Africa
- 4.5. South Africa
- 4.6. Rest of Middle East & Africa
-
5. Asia Pacific
- 5.1. China
- 5.2. India
- 5.3. Japan
- 5.4. South Korea
- 5.5. ASEAN
- 5.6. Oceania
- 5.7. Rest of Asia Pacific
US POS Terminals Market REPORT HIGHLIGHTS
| Aspects | Details |
|---|---|
| Study Period | 2019-2033 |
| Base Year | 2024 |
| Estimated Year | 2025 |
| Forecast Period | 2025-2033 |
| Historical Period | 2019-2024 |
| Growth Rate | CAGR of 8.92% from 2019-2033 |
| Segmentation |
|
Table of Contents
- 1. Introduction
- 1.1. Research Scope
- 1.2. Market Segmentation
- 1.3. Research Methodology
- 1.4. Definitions and Assumptions
- 2. Executive Summary
- 2.1. Introduction
- 3. Market Dynamics
- 3.1. Introduction
- 3.2. Market Drivers
- 3.2.1. Growing Investments in POS and Digitalization in the Payment Industry; Growing Demand for Contactless Payments; Increasing Demand for More Secured Payment Options
- 3.3. Market Restrains
- 3.3.1. Security Concerns Related to Cyber Attacks and Data Breaches; Lack of Robust and Reliable Infrastructure in Remote Regions
- 3.4. Market Trends
- 3.4.1. The Retail Segment is Expected to Grow Significantly
- 4. Market Factor Analysis
- 4.1. Porters Five Forces
- 4.2. Supply/Value Chain
- 4.3. PESTEL analysis
- 4.4. Market Entropy
- 4.5. Patent/Trademark Analysis
- 5. Global US POS Terminals Market Analysis, Insights and Forecast, 2019-2031
- 5.1. Market Analysis, Insights and Forecast - by Component
- 5.1.1. Hardware
- 5.1.2. Software
- 5.1.3. Services
- 5.2. Market Analysis, Insights and Forecast - by Type
- 5.2.1. Fixed Point-of-sale Systems
- 5.2.2. Mobile/Portable Point-of-sale Systems
- 5.3. Market Analysis, Insights and Forecast - by End-user Industry
- 5.3.1. Retail
- 5.3.2. Hospitality
- 5.3.3. Healthcare
- 5.3.4. Other End-user Industries
- 5.4. Market Analysis, Insights and Forecast - by Region
- 5.4.1. North America
- 5.4.2. South America
- 5.4.3. Europe
- 5.4.4. Middle East & Africa
- 5.4.5. Asia Pacific
- 5.1. Market Analysis, Insights and Forecast - by Component
- 6. North America US POS Terminals Market Analysis, Insights and Forecast, 2019-2031
- 6.1. Market Analysis, Insights and Forecast - by Component
- 6.1.1. Hardware
- 6.1.2. Software
- 6.1.3. Services
- 6.2. Market Analysis, Insights and Forecast - by Type
- 6.2.1. Fixed Point-of-sale Systems
- 6.2.2. Mobile/Portable Point-of-sale Systems
- 6.3. Market Analysis, Insights and Forecast - by End-user Industry
- 6.3.1. Retail
- 6.3.2. Hospitality
- 6.3.3. Healthcare
- 6.3.4. Other End-user Industries
- 6.1. Market Analysis, Insights and Forecast - by Component
- 7. South America US POS Terminals Market Analysis, Insights and Forecast, 2019-2031
- 7.1. Market Analysis, Insights and Forecast - by Component
- 7.1.1. Hardware
- 7.1.2. Software
- 7.1.3. Services
- 7.2. Market Analysis, Insights and Forecast - by Type
- 7.2.1. Fixed Point-of-sale Systems
- 7.2.2. Mobile/Portable Point-of-sale Systems
- 7.3. Market Analysis, Insights and Forecast - by End-user Industry
- 7.3.1. Retail
- 7.3.2. Hospitality
- 7.3.3. Healthcare
- 7.3.4. Other End-user Industries
- 7.1. Market Analysis, Insights and Forecast - by Component
- 8. Europe US POS Terminals Market Analysis, Insights and Forecast, 2019-2031
- 8.1. Market Analysis, Insights and Forecast - by Component
- 8.1.1. Hardware
- 8.1.2. Software
- 8.1.3. Services
- 8.2. Market Analysis, Insights and Forecast - by Type
- 8.2.1. Fixed Point-of-sale Systems
- 8.2.2. Mobile/Portable Point-of-sale Systems
- 8.3. Market Analysis, Insights and Forecast - by End-user Industry
- 8.3.1. Retail
- 8.3.2. Hospitality
- 8.3.3. Healthcare
- 8.3.4. Other End-user Industries
- 8.1. Market Analysis, Insights and Forecast - by Component
- 9. Middle East & Africa US POS Terminals Market Analysis, Insights and Forecast, 2019-2031
- 9.1. Market Analysis, Insights and Forecast - by Component
- 9.1.1. Hardware
- 9.1.2. Software
- 9.1.3. Services
- 9.2. Market Analysis, Insights and Forecast - by Type
- 9.2.1. Fixed Point-of-sale Systems
- 9.2.2. Mobile/Portable Point-of-sale Systems
- 9.3. Market Analysis, Insights and Forecast - by End-user Industry
- 9.3.1. Retail
- 9.3.2. Hospitality
- 9.3.3. Healthcare
- 9.3.4. Other End-user Industries
- 9.1. Market Analysis, Insights and Forecast - by Component
- 10. Asia Pacific US POS Terminals Market Analysis, Insights and Forecast, 2019-2031
- 10.1. Market Analysis, Insights and Forecast - by Component
- 10.1.1. Hardware
- 10.1.2. Software
- 10.1.3. Services
- 10.2. Market Analysis, Insights and Forecast - by Type
- 10.2.1. Fixed Point-of-sale Systems
- 10.2.2. Mobile/Portable Point-of-sale Systems
- 10.3. Market Analysis, Insights and Forecast - by End-user Industry
- 10.3.1. Retail
- 10.3.2. Hospitality
- 10.3.3. Healthcare
- 10.3.4. Other End-user Industries
- 10.1. Market Analysis, Insights and Forecast - by Component
- 11. Northeast US POS Terminals Market Analysis, Insights and Forecast, 2019-2031
- 12. Southeast US POS Terminals Market Analysis, Insights and Forecast, 2019-2031
- 13. Midwest US POS Terminals Market Analysis, Insights and Forecast, 2019-2031
- 14. Southwest US POS Terminals Market Analysis, Insights and Forecast, 2019-2031
- 15. West US POS Terminals Market Analysis, Insights and Forecast, 2019-2031
- 16. Competitive Analysis
- 16.1. Global Market Share Analysis 2024
- 16.2. Company Profiles
- 16.2.1 BBPOS Limited (stripe)
- 16.2.1.1. Overview
- 16.2.1.2. Products
- 16.2.1.3. SWOT Analysis
- 16.2.1.4. Recent Developments
- 16.2.1.5. Financials (Based on Availability)
- 16.2.2 Dspread Technology (Beijing) Inc
- 16.2.2.1. Overview
- 16.2.2.2. Products
- 16.2.2.3. SWOT Analysis
- 16.2.2.4. Recent Developments
- 16.2.2.5. Financials (Based on Availability)
- 16.2.3 Ingenico Inc (Apollo Asset Management)
- 16.2.3.1. Overview
- 16.2.3.2. Products
- 16.2.3.3. SWOT Analysis
- 16.2.3.4. Recent Developments
- 16.2.3.5. Financials (Based on Availability)
- 16.2.4 Verifone Systems Inc
- 16.2.4.1. Overview
- 16.2.4.2. Products
- 16.2.4.3. SWOT Analysis
- 16.2.4.4. Recent Developments
- 16.2.4.5. Financials (Based on Availability)
- 16.2.5 NEC Corporation
- 16.2.5.1. Overview
- 16.2.5.2. Products
- 16.2.5.3. SWOT Analysis
- 16.2.5.4. Recent Developments
- 16.2.5.5. Financials (Based on Availability)
- 16.2.6 SZZT Electronics Co Ltd
- 16.2.6.1. Overview
- 16.2.6.2. Products
- 16.2.6.3. SWOT Analysis
- 16.2.6.4. Recent Developments
- 16.2.6.5. Financials (Based on Availability)
- 16.2.7 Usa Technologies (Cantaloupe Inc )
- 16.2.7.1. Overview
- 16.2.7.2. Products
- 16.2.7.3. SWOT Analysis
- 16.2.7.4. Recent Developments
- 16.2.7.5. Financials (Based on Availability)
- 16.2.8 Square Capital LLC (Block Inc
- 16.2.8.1. Overview
- 16.2.8.2. Products
- 16.2.8.3. SWOT Analysis
- 16.2.8.4. Recent Developments
- 16.2.8.5. Financials (Based on Availability)
- 16.2.9 PAX Technology Ltd
- 16.2.9.1. Overview
- 16.2.9.2. Products
- 16.2.9.3. SWOT Analysis
- 16.2.9.4. Recent Developments
- 16.2.9.5. Financials (Based on Availability)
- 16.2.10 Castles Technology
- 16.2.10.1. Overview
- 16.2.10.2. Products
- 16.2.10.3. SWOT Analysis
- 16.2.10.4. Recent Developments
- 16.2.10.5. Financials (Based on Availability)
- 16.2.1 BBPOS Limited (stripe)
List of Figures
- Figure 1: Global US POS Terminals Market Revenue Breakdown (Million, %) by Region 2024 & 2032
- Figure 2: United states US POS Terminals Market Revenue (Million), by Country 2024 & 2032
- Figure 3: United states US POS Terminals Market Revenue Share (%), by Country 2024 & 2032
- Figure 4: North America US POS Terminals Market Revenue (Million), by Component 2024 & 2032
- Figure 5: North America US POS Terminals Market Revenue Share (%), by Component 2024 & 2032
- Figure 6: North America US POS Terminals Market Revenue (Million), by Type 2024 & 2032
- Figure 7: North America US POS Terminals Market Revenue Share (%), by Type 2024 & 2032
- Figure 8: North America US POS Terminals Market Revenue (Million), by End-user Industry 2024 & 2032
- Figure 9: North America US POS Terminals Market Revenue Share (%), by End-user Industry 2024 & 2032
- Figure 10: North America US POS Terminals Market Revenue (Million), by Country 2024 & 2032
- Figure 11: North America US POS Terminals Market Revenue Share (%), by Country 2024 & 2032
- Figure 12: South America US POS Terminals Market Revenue (Million), by Component 2024 & 2032
- Figure 13: South America US POS Terminals Market Revenue Share (%), by Component 2024 & 2032
- Figure 14: South America US POS Terminals Market Revenue (Million), by Type 2024 & 2032
- Figure 15: South America US POS Terminals Market Revenue Share (%), by Type 2024 & 2032
- Figure 16: South America US POS Terminals Market Revenue (Million), by End-user Industry 2024 & 2032
- Figure 17: South America US POS Terminals Market Revenue Share (%), by End-user Industry 2024 & 2032
- Figure 18: South America US POS Terminals Market Revenue (Million), by Country 2024 & 2032
- Figure 19: South America US POS Terminals Market Revenue Share (%), by Country 2024 & 2032
- Figure 20: Europe US POS Terminals Market Revenue (Million), by Component 2024 & 2032
- Figure 21: Europe US POS Terminals Market Revenue Share (%), by Component 2024 & 2032
- Figure 22: Europe US POS Terminals Market Revenue (Million), by Type 2024 & 2032
- Figure 23: Europe US POS Terminals Market Revenue Share (%), by Type 2024 & 2032
- Figure 24: Europe US POS Terminals Market Revenue (Million), by End-user Industry 2024 & 2032
- Figure 25: Europe US POS Terminals Market Revenue Share (%), by End-user Industry 2024 & 2032
- Figure 26: Europe US POS Terminals Market Revenue (Million), by Country 2024 & 2032
- Figure 27: Europe US POS Terminals Market Revenue Share (%), by Country 2024 & 2032
- Figure 28: Middle East & Africa US POS Terminals Market Revenue (Million), by Component 2024 & 2032
- Figure 29: Middle East & Africa US POS Terminals Market Revenue Share (%), by Component 2024 & 2032
- Figure 30: Middle East & Africa US POS Terminals Market Revenue (Million), by Type 2024 & 2032
- Figure 31: Middle East & Africa US POS Terminals Market Revenue Share (%), by Type 2024 & 2032
- Figure 32: Middle East & Africa US POS Terminals Market Revenue (Million), by End-user Industry 2024 & 2032
- Figure 33: Middle East & Africa US POS Terminals Market Revenue Share (%), by End-user Industry 2024 & 2032
- Figure 34: Middle East & Africa US POS Terminals Market Revenue (Million), by Country 2024 & 2032
- Figure 35: Middle East & Africa US POS Terminals Market Revenue Share (%), by Country 2024 & 2032
- Figure 36: Asia Pacific US POS Terminals Market Revenue (Million), by Component 2024 & 2032
- Figure 37: Asia Pacific US POS Terminals Market Revenue Share (%), by Component 2024 & 2032
- Figure 38: Asia Pacific US POS Terminals Market Revenue (Million), by Type 2024 & 2032
- Figure 39: Asia Pacific US POS Terminals Market Revenue Share (%), by Type 2024 & 2032
- Figure 40: Asia Pacific US POS Terminals Market Revenue (Million), by End-user Industry 2024 & 2032
- Figure 41: Asia Pacific US POS Terminals Market Revenue Share (%), by End-user Industry 2024 & 2032
- Figure 42: Asia Pacific US POS Terminals Market Revenue (Million), by Country 2024 & 2032
- Figure 43: Asia Pacific US POS Terminals Market Revenue Share (%), by Country 2024 & 2032
List of Tables
- Table 1: Global US POS Terminals Market Revenue Million Forecast, by Region 2019 & 2032
- Table 2: Global US POS Terminals Market Revenue Million Forecast, by Component 2019 & 2032
- Table 3: Global US POS Terminals Market Revenue Million Forecast, by Type 2019 & 2032
- Table 4: Global US POS Terminals Market Revenue Million Forecast, by End-user Industry 2019 & 2032
- Table 5: Global US POS Terminals Market Revenue Million Forecast, by Region 2019 & 2032
- Table 6: Global US POS Terminals Market Revenue Million Forecast, by Country 2019 & 2032
- Table 7: Northeast US POS Terminals Market Revenue (Million) Forecast, by Application 2019 & 2032
- Table 8: Southeast US POS Terminals Market Revenue (Million) Forecast, by Application 2019 & 2032
- Table 9: Midwest US POS Terminals Market Revenue (Million) Forecast, by Application 2019 & 2032
- Table 10: Southwest US POS Terminals Market Revenue (Million) Forecast, by Application 2019 & 2032
- Table 11: West US POS Terminals Market Revenue (Million) Forecast, by Application 2019 & 2032
- Table 12: Global US POS Terminals Market Revenue Million Forecast, by Component 2019 & 2032
- Table 13: Global US POS Terminals Market Revenue Million Forecast, by Type 2019 & 2032
- Table 14: Global US POS Terminals Market Revenue Million Forecast, by End-user Industry 2019 & 2032
- Table 15: Global US POS Terminals Market Revenue Million Forecast, by Country 2019 & 2032
- Table 16: United States US POS Terminals Market Revenue (Million) Forecast, by Application 2019 & 2032
- Table 17: Canada US POS Terminals Market Revenue (Million) Forecast, by Application 2019 & 2032
- Table 18: Mexico US POS Terminals Market Revenue (Million) Forecast, by Application 2019 & 2032
- Table 19: Global US POS Terminals Market Revenue Million Forecast, by Component 2019 & 2032
- Table 20: Global US POS Terminals Market Revenue Million Forecast, by Type 2019 & 2032
- Table 21: Global US POS Terminals Market Revenue Million Forecast, by End-user Industry 2019 & 2032
- Table 22: Global US POS Terminals Market Revenue Million Forecast, by Country 2019 & 2032
- Table 23: Brazil US POS Terminals Market Revenue (Million) Forecast, by Application 2019 & 2032
- Table 24: Argentina US POS Terminals Market Revenue (Million) Forecast, by Application 2019 & 2032
- Table 25: Rest of South America US POS Terminals Market Revenue (Million) Forecast, by Application 2019 & 2032
- Table 26: Global US POS Terminals Market Revenue Million Forecast, by Component 2019 & 2032
- Table 27: Global US POS Terminals Market Revenue Million Forecast, by Type 2019 & 2032
- Table 28: Global US POS Terminals Market Revenue Million Forecast, by End-user Industry 2019 & 2032
- Table 29: Global US POS Terminals Market Revenue Million Forecast, by Country 2019 & 2032
- Table 30: United Kingdom US POS Terminals Market Revenue (Million) Forecast, by Application 2019 & 2032
- Table 31: Germany US POS Terminals Market Revenue (Million) Forecast, by Application 2019 & 2032
- Table 32: France US POS Terminals Market Revenue (Million) Forecast, by Application 2019 & 2032
- Table 33: Italy US POS Terminals Market Revenue (Million) Forecast, by Application 2019 & 2032
- Table 34: Spain US POS Terminals Market Revenue (Million) Forecast, by Application 2019 & 2032
- Table 35: Russia US POS Terminals Market Revenue (Million) Forecast, by Application 2019 & 2032
- Table 36: Benelux US POS Terminals Market Revenue (Million) Forecast, by Application 2019 & 2032
- Table 37: Nordics US POS Terminals Market Revenue (Million) Forecast, by Application 2019 & 2032
- Table 38: Rest of Europe US POS Terminals Market Revenue (Million) Forecast, by Application 2019 & 2032
- Table 39: Global US POS Terminals Market Revenue Million Forecast, by Component 2019 & 2032
- Table 40: Global US POS Terminals Market Revenue Million Forecast, by Type 2019 & 2032
- Table 41: Global US POS Terminals Market Revenue Million Forecast, by End-user Industry 2019 & 2032
- Table 42: Global US POS Terminals Market Revenue Million Forecast, by Country 2019 & 2032
- Table 43: Turkey US POS Terminals Market Revenue (Million) Forecast, by Application 2019 & 2032
- Table 44: Israel US POS Terminals Market Revenue (Million) Forecast, by Application 2019 & 2032
- Table 45: GCC US POS Terminals Market Revenue (Million) Forecast, by Application 2019 & 2032
- Table 46: North Africa US POS Terminals Market Revenue (Million) Forecast, by Application 2019 & 2032
- Table 47: South Africa US POS Terminals Market Revenue (Million) Forecast, by Application 2019 & 2032
- Table 48: Rest of Middle East & Africa US POS Terminals Market Revenue (Million) Forecast, by Application 2019 & 2032
- Table 49: Global US POS Terminals Market Revenue Million Forecast, by Component 2019 & 2032
- Table 50: Global US POS Terminals Market Revenue Million Forecast, by Type 2019 & 2032
- Table 51: Global US POS Terminals Market Revenue Million Forecast, by End-user Industry 2019 & 2032
- Table 52: Global US POS Terminals Market Revenue Million Forecast, by Country 2019 & 2032
- Table 53: China US POS Terminals Market Revenue (Million) Forecast, by Application 2019 & 2032
- Table 54: India US POS Terminals Market Revenue (Million) Forecast, by Application 2019 & 2032
- Table 55: Japan US POS Terminals Market Revenue (Million) Forecast, by Application 2019 & 2032
- Table 56: South Korea US POS Terminals Market Revenue (Million) Forecast, by Application 2019 & 2032
- Table 57: ASEAN US POS Terminals Market Revenue (Million) Forecast, by Application 2019 & 2032
- Table 58: Oceania US POS Terminals Market Revenue (Million) Forecast, by Application 2019 & 2032
- Table 59: Rest of Asia Pacific US POS Terminals Market Revenue (Million) Forecast, by Application 2019 & 2032
Frequently Asked Questions
1. What is the projected Compound Annual Growth Rate (CAGR) of the US POS Terminals Market?
The projected CAGR is approximately 8.92%.
2. Which companies are prominent players in the US POS Terminals Market?
Key companies in the market include BBPOS Limited (stripe), Dspread Technology (Beijing) Inc, Ingenico Inc (Apollo Asset Management), Verifone Systems Inc, NEC Corporation, SZZT Electronics Co Ltd, Usa Technologies (Cantaloupe Inc ), Square Capital LLC (Block Inc, PAX Technology Ltd, Castles Technology.
3. What are the main segments of the US POS Terminals Market?
The market segments include Component, Type, End-user Industry.
4. Can you provide details about the market size?
The market size is estimated to be USD 26.73 Million as of 2022.
5. What are some drivers contributing to market growth?
Growing Investments in POS and Digitalization in the Payment Industry; Growing Demand for Contactless Payments; Increasing Demand for More Secured Payment Options.
6. What are the notable trends driving market growth?
The Retail Segment is Expected to Grow Significantly.
7. Are there any restraints impacting market growth?
Security Concerns Related to Cyber Attacks and Data Breaches; Lack of Robust and Reliable Infrastructure in Remote Regions.
8. Can you provide examples of recent developments in the market?
January 2024 - PAR Technology launched PAR Wave POS Terminal to meet future restaurant industry needs, seamlessly blending functionality, performance, security, and innovative design. PAR recognizes the growing significance of these aspects in restaurant operations and strives to provide solutions that harmonize with the evolving landscape. The technology can run complex software efficiently, offering reliability for diverse operational needs.
9. What pricing options are available for accessing the report?
Pricing options include single-user, multi-user, and enterprise licenses priced at USD 3800, USD 4500, and USD 5800 respectively.
10. Is the market size provided in terms of value or volume?
The market size is provided in terms of value, measured in Million.
11. Are there any specific market keywords associated with the report?
Yes, the market keyword associated with the report is "US POS Terminals Market," which aids in identifying and referencing the specific market segment covered.
12. How do I determine which pricing option suits my needs best?
The pricing options vary based on user requirements and access needs. Individual users may opt for single-user licenses, while businesses requiring broader access may choose multi-user or enterprise licenses for cost-effective access to the report.
13. Are there any additional resources or data provided in the US POS Terminals Market report?
While the report offers comprehensive insights, it's advisable to review the specific contents or supplementary materials provided to ascertain if additional resources or data are available.
14. How can I stay updated on further developments or reports in the US POS Terminals Market?
To stay informed about further developments, trends, and reports in the US POS Terminals Market, consider subscribing to industry newsletters, following relevant companies and organizations, or regularly checking reputable industry news sources and publications.
Methodology
Step 1 - Identification of Relevant Samples Size from Population Database


Step 2 - Approaches for Defining Global Market Size (Value, Volume* & Price*)

Note*: In applicable scenarios
Step 3 - Data Sources
Primary Research
- Web Analytics
- Survey Reports
- Research Institute
- Latest Research Reports
- Opinion Leaders
Secondary Research
- Annual Reports
- White Paper
- Latest Press Release
- Industry Association
- Paid Database
- Investor Presentations

Step 4 - Data Triangulation
Involves using different sources of information in order to increase the validity of a study
These sources are likely to be stakeholders in a program - participants, other researchers, program staff, other community members, and so on.
Then we put all data in single framework & apply various statistical tools to find out the dynamic on the market.
During the analysis stage, feedback from the stakeholder groups would be compared to determine areas of agreement as well as areas of divergence


