
Key Insights
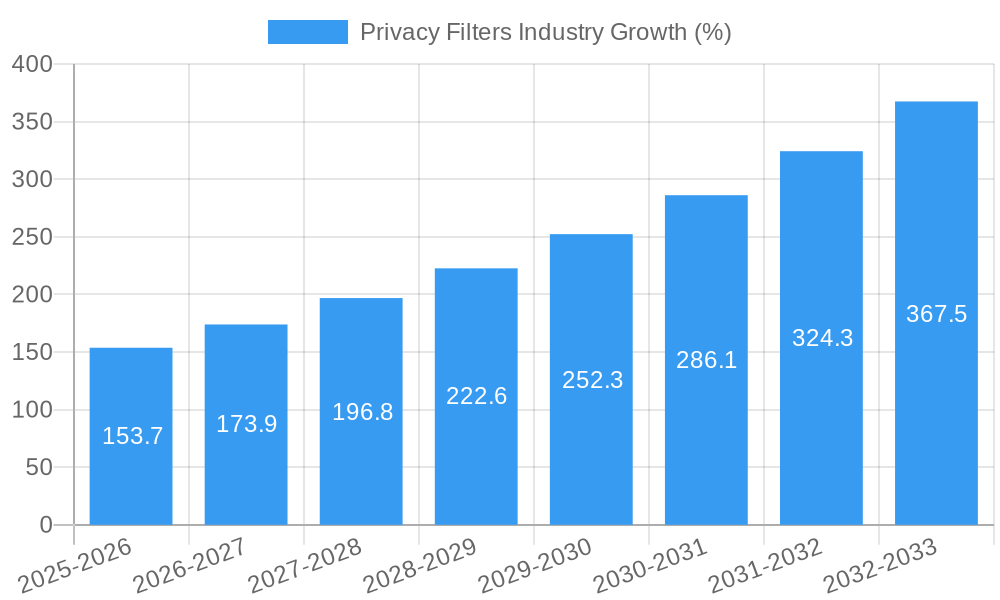
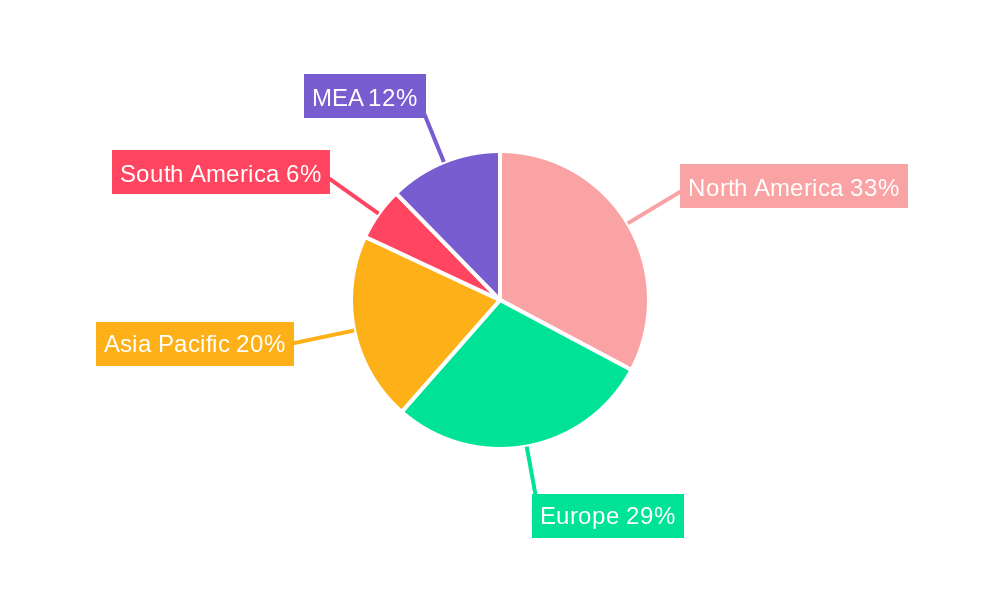
The global privacy filter market, valued at $1.22 billion in 2025, is projected to experience robust growth, driven by a compound annual growth rate (CAGR) of 12.96% from 2025 to 2033. This expansion is fueled by several key factors. The increasing concerns regarding data breaches and digital privacy, particularly within sensitive sectors like finance, healthcare, and government, are creating a heightened demand for privacy filters across various devices. The rising adoption of laptops, smartphones, and tablets in professional and personal settings further amplifies this demand. Moreover, technological advancements leading to more efficient and user-friendly privacy filter designs, including both adhesive and magnetic options, are contributing to market growth. Different application needs, ranging from basic screen protection to advanced anti-glare and privacy features, are also driving market segmentation and innovation. North America and Europe currently dominate the market due to high technological adoption and strong regulatory frameworks concerning data protection. However, the Asia-Pacific region is expected to witness significant growth in the coming years, driven by increasing digitalization and rising disposable incomes.
While the market presents significant opportunities, certain challenges exist. The relatively high cost of advanced privacy filters compared to standard screen protectors could hinder wider adoption, particularly in price-sensitive markets. Competition among established players and emerging entrants also necessitates continuous innovation and strategic partnerships to maintain market share. Furthermore, the need for consistent user education on the benefits and proper usage of privacy filters remains crucial for sustained market growth. The market segmentation by application (laptops, monitors, smartphones, tablets), feature (adhesive, magnetic, others), and end-user industry (financial institutions, educational institutions, etc.) offers companies opportunities for targeted product development and marketing strategies to capitalize on specific market needs. The continued focus on improving product quality, expanding distribution channels, and developing innovative solutions will be key for sustained success in this rapidly evolving market.
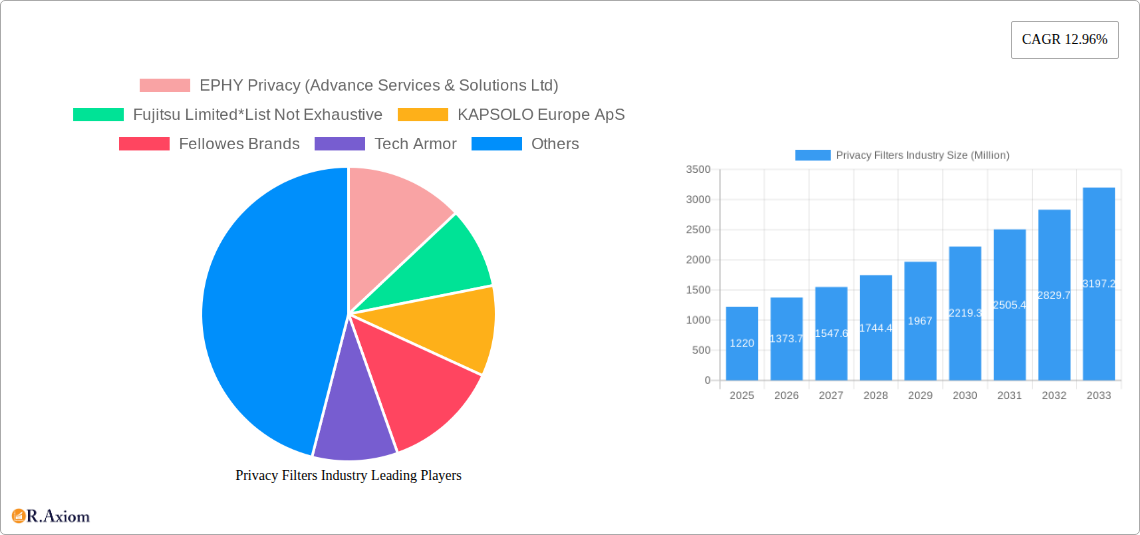
Privacy Filters Industry: A Comprehensive Market Report (2019-2033)
This in-depth report provides a comprehensive analysis of the global privacy filters industry, covering market size, growth projections, key players, and emerging trends from 2019 to 2033. The study encompasses detailed segmentation by application (laptop, monitor, smartphones, tablets), feature (adhesive, magnetic, other), and end-user industry (financial institutions, educational institutions, legal firms, government, healthcare, and others). With a base year of 2025 and a forecast period of 2025-2033, this report is an invaluable resource for industry stakeholders, investors, and strategic decision-makers. The report includes detailed analysis of key players such as EPHY Privacy (Advance Services & Solutions Ltd), Fujitsu Limited, KAPSOLO Europe ApS, Fellowes Brands, Tech Armor, 3M Company, Upscreen (Bedifol GmbH), Dell Inc, Targus, Kensington Computer Products Group (ACCO Brands), and MoniFilm (Right Group Co Ltd), but the list is not exhaustive. The total market value is projected to reach xx Million by 2033.
Privacy Filters Industry Market Concentration & Innovation
The privacy filters market exhibits a moderately concentrated landscape, with a few major players holding significant market share. The top 5 companies account for approximately xx% of the global revenue, while numerous smaller players cater to niche segments or regional markets. Market share data for 2024 suggests that 3M Company holds the largest share, followed by Fellowes Brands and Dell Inc. Innovation is driven by the increasing demand for enhanced privacy and security, particularly in the corporate and government sectors. Key innovations include improved filter materials, advanced adhesive technologies, and integration with smart devices. Regulatory frameworks, particularly data privacy regulations like GDPR, are impacting product development and market access. Product substitutes, such as software-based privacy solutions, pose a challenge. However, the demand for physical privacy filters remains robust due to the enhanced security they offer against visual hacking attempts. Mergers and acquisitions (M&A) activity has been relatively moderate. Notable transactions include B. Riley Financial's acquisition of Targus in October 2022, for a value of xx Million, expanding Targus's presence in laptop accessories, including privacy filters. Furthermore, the partnership between GPO Plus and Tech Armor in November 2022 signifies an expansion of Tech Armor's reach to brick-and-mortar retail spaces.
Privacy Filters Industry Industry Trends & Insights
The global privacy filters market is experiencing robust growth, driven primarily by rising concerns over data breaches and visual hacking. The compound annual growth rate (CAGR) during the forecast period (2025-2033) is estimated to be xx%. This growth is fueled by increasing adoption of laptops, smartphones, and tablets across diverse end-user industries. Market penetration is highest in developed economies, with North America and Europe currently leading the market. However, significant growth potential exists in developing economies where the adoption of technology and data security awareness are rapidly increasing. Technological disruptions, such as the development of more effective filter materials and improved screen technologies that enhance privacy, are further driving market expansion. Consumer preference for sleek designs and easy-to-apply filters is also shaping product development. Competitive dynamics are characterized by intense rivalry among established players and the emergence of new entrants offering innovative products and services. The shift towards remote working and increasing reliance on digital devices are creating high demand for effective privacy solutions for various applications.
Dominant Markets & Segments in Privacy Filters Industry
- Leading Region: North America currently holds the largest market share, driven by high technology adoption, strong data privacy regulations, and a high concentration of major companies in the sector.
- Leading Country: The United States dominates the North American market.
- Leading Application Segment: Laptops and monitors represent the largest application segments due to widespread usage in offices and homes.
- Leading Feature Segment: Adhesive-based filters maintain a dominant market share due to ease of application and affordability.
- Leading End-User Industry: Financial institutions, government agencies, and legal firms constitute significant end-user segments owing to stringent data security requirements.
The dominance of North America is attributed to factors such as established technological infrastructure, robust data privacy regulations, and high consumer awareness regarding data security. The large number of companies headquartered in this region, as well as high spending on IT infrastructure contribute to the market dominance. Similarly, the preference for laptop and monitor privacy filters reflects the high penetration of these devices across various sectors and the importance of securing sensitive information on these devices. Stricter data privacy regulations are enforcing the adoption of these filters.
Privacy Filters Industry Product Developments
Recent product innovations in the privacy filters industry have focused on improving filter material quality, enhancing ease of application, and creating more aesthetically pleasing designs. Manufacturers are increasingly incorporating advanced technologies like anti-glare and anti-fingerprint coatings, while also exploring sustainable and recyclable materials. The development of magnetic and frameless filters reflects the growing demand for simple application and a seamless look. These innovations are crucial in ensuring market fit by responding to evolving consumer needs and preferences, thereby boosting market penetration.
Report Scope & Segmentation Analysis
This report segments the privacy filters market based on application (laptops, monitors, smartphones, tablets), feature (adhesive, magnetic, other features), and end-user industry (financial institutions, educational institutions, legal firms, government, healthcare, and other industries). Growth projections are provided for each segment, along with analysis of competitive dynamics. The market size for each segment is estimated for the historical period (2019-2024), base year (2025), and forecast period (2025-2033). The analysis includes market share and the competitive landscape for each segment.
Key Drivers of Privacy Filters Industry Growth
The privacy filters industry is experiencing growth fueled by several factors: rising concerns about data breaches and visual hacking, increasing adoption of digital devices across various sectors, stringent data privacy regulations (like GDPR), and the increasing popularity of remote work. The development of innovative filter materials and technologies is also boosting market growth. Furthermore, increasing awareness of visual hacking and data breaches, especially in highly regulated industries, is driving demand for these filters.
Challenges in the Privacy Filters Industry Sector
The privacy filters market faces several challenges. These include the emergence of software-based alternatives, fluctuations in raw material prices affecting manufacturing costs, and intense competition among established players. Supply chain disruptions and the potential for counterfeit products also pose significant risks. The xx Million impact on the market from supply chain issues is anticipated to increase demand.
Emerging Opportunities in Privacy Filters Industry
The privacy filters industry presents numerous opportunities. These include expanding into emerging markets, developing innovative product designs such as curved screen filters, and the potential for integration with smart devices and IoT applications. The increasing adoption of advanced technologies, such as AI and machine learning, in privacy filter development also offers significant opportunities for growth and differentiation.
Leading Players in the Privacy Filters Industry Market
- EPHY Privacy (Advance Services & Solutions Ltd)
- Fujitsu Limited
- KAPSOLO Europe ApS
- Fellowes Brands
- Tech Armor
- 3M Company
- Upscreen (Bedifol GmbH)
- Dell Inc
- Targus
- Kensington Computer Products Group (ACCO Brands)
- MoniFilm (Right Group Co Ltd)
Key Developments in Privacy Filters Industry Industry
- November 2022: GPOPlus signed a master services agreement with Tech Armor, expanding Tech Armor's distribution network to include brick-and-mortar retailers.
- October 2022: B. Riley Financial acquired Targus, a leading manufacturer of laptop cases and accessories, including privacy filters. This acquisition significantly bolsters Targus's position in the market and expands its product portfolio.
Strategic Outlook for Privacy Filters Industry Market
The future of the privacy filters market looks bright. Continued growth is anticipated, driven by increasing concerns about data security, expanding digitalization across all sectors, and the development of more sophisticated filter technologies. Companies focusing on innovation, strategic partnerships, and efficient supply chain management are well-positioned to capitalize on the considerable market opportunities. The expanding adoption of privacy filters in various industries and applications suggests a promising and robust market outlook.
Privacy Filters Industry Segmentation
-
1. Application
- 1.1. Laptops
- 1.2. Monitors
- 1.3. Smartphones
- 1.4. Tablets
-
2. Feature
- 2.1. Adhesive
- 2.2. Magnetic
- 2.3. Other Features
-
3. End-user Industry
- 3.1. Financial Institution
- 3.2. Educational Institution
- 3.3. Legal Firm
- 3.4. Government
- 3.5. Healthcare
- 3.6. Other End User Industries
Privacy Filters Industry Segmentation By Geography
- 1. North America
- 2. Europe
- 3. Asia
- 4. Australia and New Zealand
- 5. Latin America
- 6. Middle East and Africa
Privacy Filters Industry REPORT HIGHLIGHTS
| Aspects | Details |
|---|---|
| Study Period | 2019-2033 |
| Base Year | 2024 |
| Estimated Year | 2025 |
| Forecast Period | 2025-2033 |
| Historical Period | 2019-2024 |
| Growth Rate | CAGR of 12.96% from 2019-2033 |
| Segmentation |
|
Table of Contents
- 1. Introduction
- 1.1. Research Scope
- 1.2. Market Segmentation
- 1.3. Research Methodology
- 1.4. Definitions and Assumptions
- 2. Executive Summary
- 2.1. Introduction
- 3. Market Dynamics
- 3.1. Introduction
- 3.2. Market Drivers
- 3.2.1. Optical Comfort and Device Protection; Rising Data Privacy and Security Concerns
- 3.3. Market Restrains
- 3.3.1. Lack of Awareness about the Privacy Filters among the Users
- 3.4. Market Trends
- 3.4.1. Financial Institutions to Hold Major Share
- 4. Market Factor Analysis
- 4.1. Porters Five Forces
- 4.2. Supply/Value Chain
- 4.3. PESTEL analysis
- 4.4. Market Entropy
- 4.5. Patent/Trademark Analysis
- 5. Global Privacy Filters Industry Analysis, Insights and Forecast, 2019-2031
- 5.1. Market Analysis, Insights and Forecast - by Application
- 5.1.1. Laptops
- 5.1.2. Monitors
- 5.1.3. Smartphones
- 5.1.4. Tablets
- 5.2. Market Analysis, Insights and Forecast - by Feature
- 5.2.1. Adhesive
- 5.2.2. Magnetic
- 5.2.3. Other Features
- 5.3. Market Analysis, Insights and Forecast - by End-user Industry
- 5.3.1. Financial Institution
- 5.3.2. Educational Institution
- 5.3.3. Legal Firm
- 5.3.4. Government
- 5.3.5. Healthcare
- 5.3.6. Other End User Industries
- 5.4. Market Analysis, Insights and Forecast - by Region
- 5.4.1. North America
- 5.4.2. Europe
- 5.4.3. Asia
- 5.4.4. Australia and New Zealand
- 5.4.5. Latin America
- 5.4.6. Middle East and Africa
- 5.1. Market Analysis, Insights and Forecast - by Application
- 6. North America Privacy Filters Industry Analysis, Insights and Forecast, 2019-2031
- 6.1. Market Analysis, Insights and Forecast - by Application
- 6.1.1. Laptops
- 6.1.2. Monitors
- 6.1.3. Smartphones
- 6.1.4. Tablets
- 6.2. Market Analysis, Insights and Forecast - by Feature
- 6.2.1. Adhesive
- 6.2.2. Magnetic
- 6.2.3. Other Features
- 6.3. Market Analysis, Insights and Forecast - by End-user Industry
- 6.3.1. Financial Institution
- 6.3.2. Educational Institution
- 6.3.3. Legal Firm
- 6.3.4. Government
- 6.3.5. Healthcare
- 6.3.6. Other End User Industries
- 6.1. Market Analysis, Insights and Forecast - by Application
- 7. Europe Privacy Filters Industry Analysis, Insights and Forecast, 2019-2031
- 7.1. Market Analysis, Insights and Forecast - by Application
- 7.1.1. Laptops
- 7.1.2. Monitors
- 7.1.3. Smartphones
- 7.1.4. Tablets
- 7.2. Market Analysis, Insights and Forecast - by Feature
- 7.2.1. Adhesive
- 7.2.2. Magnetic
- 7.2.3. Other Features
- 7.3. Market Analysis, Insights and Forecast - by End-user Industry
- 7.3.1. Financial Institution
- 7.3.2. Educational Institution
- 7.3.3. Legal Firm
- 7.3.4. Government
- 7.3.5. Healthcare
- 7.3.6. Other End User Industries
- 7.1. Market Analysis, Insights and Forecast - by Application
- 8. Asia Privacy Filters Industry Analysis, Insights and Forecast, 2019-2031
- 8.1. Market Analysis, Insights and Forecast - by Application
- 8.1.1. Laptops
- 8.1.2. Monitors
- 8.1.3. Smartphones
- 8.1.4. Tablets
- 8.2. Market Analysis, Insights and Forecast - by Feature
- 8.2.1. Adhesive
- 8.2.2. Magnetic
- 8.2.3. Other Features
- 8.3. Market Analysis, Insights and Forecast - by End-user Industry
- 8.3.1. Financial Institution
- 8.3.2. Educational Institution
- 8.3.3. Legal Firm
- 8.3.4. Government
- 8.3.5. Healthcare
- 8.3.6. Other End User Industries
- 8.1. Market Analysis, Insights and Forecast - by Application
- 9. Australia and New Zealand Privacy Filters Industry Analysis, Insights and Forecast, 2019-2031
- 9.1. Market Analysis, Insights and Forecast - by Application
- 9.1.1. Laptops
- 9.1.2. Monitors
- 9.1.3. Smartphones
- 9.1.4. Tablets
- 9.2. Market Analysis, Insights and Forecast - by Feature
- 9.2.1. Adhesive
- 9.2.2. Magnetic
- 9.2.3. Other Features
- 9.3. Market Analysis, Insights and Forecast - by End-user Industry
- 9.3.1. Financial Institution
- 9.3.2. Educational Institution
- 9.3.3. Legal Firm
- 9.3.4. Government
- 9.3.5. Healthcare
- 9.3.6. Other End User Industries
- 9.1. Market Analysis, Insights and Forecast - by Application
- 10. Latin America Privacy Filters Industry Analysis, Insights and Forecast, 2019-2031
- 10.1. Market Analysis, Insights and Forecast - by Application
- 10.1.1. Laptops
- 10.1.2. Monitors
- 10.1.3. Smartphones
- 10.1.4. Tablets
- 10.2. Market Analysis, Insights and Forecast - by Feature
- 10.2.1. Adhesive
- 10.2.2. Magnetic
- 10.2.3. Other Features
- 10.3. Market Analysis, Insights and Forecast - by End-user Industry
- 10.3.1. Financial Institution
- 10.3.2. Educational Institution
- 10.3.3. Legal Firm
- 10.3.4. Government
- 10.3.5. Healthcare
- 10.3.6. Other End User Industries
- 10.1. Market Analysis, Insights and Forecast - by Application
- 11. Middle East and Africa Privacy Filters Industry Analysis, Insights and Forecast, 2019-2031
- 11.1. Market Analysis, Insights and Forecast - by Application
- 11.1.1. Laptops
- 11.1.2. Monitors
- 11.1.3. Smartphones
- 11.1.4. Tablets
- 11.2. Market Analysis, Insights and Forecast - by Feature
- 11.2.1. Adhesive
- 11.2.2. Magnetic
- 11.2.3. Other Features
- 11.3. Market Analysis, Insights and Forecast - by End-user Industry
- 11.3.1. Financial Institution
- 11.3.2. Educational Institution
- 11.3.3. Legal Firm
- 11.3.4. Government
- 11.3.5. Healthcare
- 11.3.6. Other End User Industries
- 11.1. Market Analysis, Insights and Forecast - by Application
- 12. North America Privacy Filters Industry Analysis, Insights and Forecast, 2019-2031
- 12.1. Market Analysis, Insights and Forecast - By Country/Sub-region
- 12.1.1 United States
- 12.1.2 Canada
- 12.1.3 Mexico
- 13. Europe Privacy Filters Industry Analysis, Insights and Forecast, 2019-2031
- 13.1. Market Analysis, Insights and Forecast - By Country/Sub-region
- 13.1.1 Germany
- 13.1.2 United Kingdom
- 13.1.3 France
- 13.1.4 Spain
- 13.1.5 Italy
- 13.1.6 Spain
- 13.1.7 Belgium
- 13.1.8 Netherland
- 13.1.9 Nordics
- 13.1.10 Rest of Europe
- 14. Asia Pacific Privacy Filters Industry Analysis, Insights and Forecast, 2019-2031
- 14.1. Market Analysis, Insights and Forecast - By Country/Sub-region
- 14.1.1 China
- 14.1.2 Japan
- 14.1.3 India
- 14.1.4 South Korea
- 14.1.5 Southeast Asia
- 14.1.6 Australia
- 14.1.7 Indonesia
- 14.1.8 Phillipes
- 14.1.9 Singapore
- 14.1.10 Thailandc
- 14.1.11 Rest of Asia Pacific
- 15. South America Privacy Filters Industry Analysis, Insights and Forecast, 2019-2031
- 15.1. Market Analysis, Insights and Forecast - By Country/Sub-region
- 15.1.1 Brazil
- 15.1.2 Argentina
- 15.1.3 Peru
- 15.1.4 Chile
- 15.1.5 Colombia
- 15.1.6 Ecuador
- 15.1.7 Venezuela
- 15.1.8 Rest of South America
- 16. North America Privacy Filters Industry Analysis, Insights and Forecast, 2019-2031
- 16.1. Market Analysis, Insights and Forecast - By Country/Sub-region
- 16.1.1 United States
- 16.1.2 Canada
- 16.1.3 Mexico
- 17. MEA Privacy Filters Industry Analysis, Insights and Forecast, 2019-2031
- 17.1. Market Analysis, Insights and Forecast - By Country/Sub-region
- 17.1.1 United Arab Emirates
- 17.1.2 Saudi Arabia
- 17.1.3 South Africa
- 17.1.4 Rest of Middle East and Africa
- 18. Competitive Analysis
- 18.1. Global Market Share Analysis 2024
- 18.2. Company Profiles
- 18.2.1 EPHY Privacy (Advance Services & Solutions Ltd)
- 18.2.1.1. Overview
- 18.2.1.2. Products
- 18.2.1.3. SWOT Analysis
- 18.2.1.4. Recent Developments
- 18.2.1.5. Financials (Based on Availability)
- 18.2.2 Fujitsu Limited*List Not Exhaustive
- 18.2.2.1. Overview
- 18.2.2.2. Products
- 18.2.2.3. SWOT Analysis
- 18.2.2.4. Recent Developments
- 18.2.2.5. Financials (Based on Availability)
- 18.2.3 KAPSOLO Europe ApS
- 18.2.3.1. Overview
- 18.2.3.2. Products
- 18.2.3.3. SWOT Analysis
- 18.2.3.4. Recent Developments
- 18.2.3.5. Financials (Based on Availability)
- 18.2.4 Fellowes Brands
- 18.2.4.1. Overview
- 18.2.4.2. Products
- 18.2.4.3. SWOT Analysis
- 18.2.4.4. Recent Developments
- 18.2.4.5. Financials (Based on Availability)
- 18.2.5 Tech Armor
- 18.2.5.1. Overview
- 18.2.5.2. Products
- 18.2.5.3. SWOT Analysis
- 18.2.5.4. Recent Developments
- 18.2.5.5. Financials (Based on Availability)
- 18.2.6 3M Company
- 18.2.6.1. Overview
- 18.2.6.2. Products
- 18.2.6.3. SWOT Analysis
- 18.2.6.4. Recent Developments
- 18.2.6.5. Financials (Based on Availability)
- 18.2.7 Upscreen (Bedifol GmbH)
- 18.2.7.1. Overview
- 18.2.7.2. Products
- 18.2.7.3. SWOT Analysis
- 18.2.7.4. Recent Developments
- 18.2.7.5. Financials (Based on Availability)
- 18.2.8 Dell Inc
- 18.2.8.1. Overview
- 18.2.8.2. Products
- 18.2.8.3. SWOT Analysis
- 18.2.8.4. Recent Developments
- 18.2.8.5. Financials (Based on Availability)
- 18.2.9 Targus
- 18.2.9.1. Overview
- 18.2.9.2. Products
- 18.2.9.3. SWOT Analysis
- 18.2.9.4. Recent Developments
- 18.2.9.5. Financials (Based on Availability)
- 18.2.10 Kensington Computer Products Group (ACCO Brands)
- 18.2.10.1. Overview
- 18.2.10.2. Products
- 18.2.10.3. SWOT Analysis
- 18.2.10.4. Recent Developments
- 18.2.10.5. Financials (Based on Availability)
- 18.2.11 MoniFilm (Right Group Co Ltd)
- 18.2.11.1. Overview
- 18.2.11.2. Products
- 18.2.11.3. SWOT Analysis
- 18.2.11.4. Recent Developments
- 18.2.11.5. Financials (Based on Availability)
- 18.2.1 EPHY Privacy (Advance Services & Solutions Ltd)
List of Figures
- Figure 1: Global Privacy Filters Industry Revenue Breakdown (Million, %) by Region 2024 & 2032
- Figure 2: North America Privacy Filters Industry Revenue (Million), by Country 2024 & 2032
- Figure 3: North America Privacy Filters Industry Revenue Share (%), by Country 2024 & 2032
- Figure 4: Europe Privacy Filters Industry Revenue (Million), by Country 2024 & 2032
- Figure 5: Europe Privacy Filters Industry Revenue Share (%), by Country 2024 & 2032
- Figure 6: Asia Pacific Privacy Filters Industry Revenue (Million), by Country 2024 & 2032
- Figure 7: Asia Pacific Privacy Filters Industry Revenue Share (%), by Country 2024 & 2032
- Figure 8: South America Privacy Filters Industry Revenue (Million), by Country 2024 & 2032
- Figure 9: South America Privacy Filters Industry Revenue Share (%), by Country 2024 & 2032
- Figure 10: North America Privacy Filters Industry Revenue (Million), by Country 2024 & 2032
- Figure 11: North America Privacy Filters Industry Revenue Share (%), by Country 2024 & 2032
- Figure 12: MEA Privacy Filters Industry Revenue (Million), by Country 2024 & 2032
- Figure 13: MEA Privacy Filters Industry Revenue Share (%), by Country 2024 & 2032
- Figure 14: North America Privacy Filters Industry Revenue (Million), by Application 2024 & 2032
- Figure 15: North America Privacy Filters Industry Revenue Share (%), by Application 2024 & 2032
- Figure 16: North America Privacy Filters Industry Revenue (Million), by Feature 2024 & 2032
- Figure 17: North America Privacy Filters Industry Revenue Share (%), by Feature 2024 & 2032
- Figure 18: North America Privacy Filters Industry Revenue (Million), by End-user Industry 2024 & 2032
- Figure 19: North America Privacy Filters Industry Revenue Share (%), by End-user Industry 2024 & 2032
- Figure 20: North America Privacy Filters Industry Revenue (Million), by Country 2024 & 2032
- Figure 21: North America Privacy Filters Industry Revenue Share (%), by Country 2024 & 2032
- Figure 22: Europe Privacy Filters Industry Revenue (Million), by Application 2024 & 2032
- Figure 23: Europe Privacy Filters Industry Revenue Share (%), by Application 2024 & 2032
- Figure 24: Europe Privacy Filters Industry Revenue (Million), by Feature 2024 & 2032
- Figure 25: Europe Privacy Filters Industry Revenue Share (%), by Feature 2024 & 2032
- Figure 26: Europe Privacy Filters Industry Revenue (Million), by End-user Industry 2024 & 2032
- Figure 27: Europe Privacy Filters Industry Revenue Share (%), by End-user Industry 2024 & 2032
- Figure 28: Europe Privacy Filters Industry Revenue (Million), by Country 2024 & 2032
- Figure 29: Europe Privacy Filters Industry Revenue Share (%), by Country 2024 & 2032
- Figure 30: Asia Privacy Filters Industry Revenue (Million), by Application 2024 & 2032
- Figure 31: Asia Privacy Filters Industry Revenue Share (%), by Application 2024 & 2032
- Figure 32: Asia Privacy Filters Industry Revenue (Million), by Feature 2024 & 2032
- Figure 33: Asia Privacy Filters Industry Revenue Share (%), by Feature 2024 & 2032
- Figure 34: Asia Privacy Filters Industry Revenue (Million), by End-user Industry 2024 & 2032
- Figure 35: Asia Privacy Filters Industry Revenue Share (%), by End-user Industry 2024 & 2032
- Figure 36: Asia Privacy Filters Industry Revenue (Million), by Country 2024 & 2032
- Figure 37: Asia Privacy Filters Industry Revenue Share (%), by Country 2024 & 2032
- Figure 38: Australia and New Zealand Privacy Filters Industry Revenue (Million), by Application 2024 & 2032
- Figure 39: Australia and New Zealand Privacy Filters Industry Revenue Share (%), by Application 2024 & 2032
- Figure 40: Australia and New Zealand Privacy Filters Industry Revenue (Million), by Feature 2024 & 2032
- Figure 41: Australia and New Zealand Privacy Filters Industry Revenue Share (%), by Feature 2024 & 2032
- Figure 42: Australia and New Zealand Privacy Filters Industry Revenue (Million), by End-user Industry 2024 & 2032
- Figure 43: Australia and New Zealand Privacy Filters Industry Revenue Share (%), by End-user Industry 2024 & 2032
- Figure 44: Australia and New Zealand Privacy Filters Industry Revenue (Million), by Country 2024 & 2032
- Figure 45: Australia and New Zealand Privacy Filters Industry Revenue Share (%), by Country 2024 & 2032
- Figure 46: Latin America Privacy Filters Industry Revenue (Million), by Application 2024 & 2032
- Figure 47: Latin America Privacy Filters Industry Revenue Share (%), by Application 2024 & 2032
- Figure 48: Latin America Privacy Filters Industry Revenue (Million), by Feature 2024 & 2032
- Figure 49: Latin America Privacy Filters Industry Revenue Share (%), by Feature 2024 & 2032
- Figure 50: Latin America Privacy Filters Industry Revenue (Million), by End-user Industry 2024 & 2032
- Figure 51: Latin America Privacy Filters Industry Revenue Share (%), by End-user Industry 2024 & 2032
- Figure 52: Latin America Privacy Filters Industry Revenue (Million), by Country 2024 & 2032
- Figure 53: Latin America Privacy Filters Industry Revenue Share (%), by Country 2024 & 2032
- Figure 54: Middle East and Africa Privacy Filters Industry Revenue (Million), by Application 2024 & 2032
- Figure 55: Middle East and Africa Privacy Filters Industry Revenue Share (%), by Application 2024 & 2032
- Figure 56: Middle East and Africa Privacy Filters Industry Revenue (Million), by Feature 2024 & 2032
- Figure 57: Middle East and Africa Privacy Filters Industry Revenue Share (%), by Feature 2024 & 2032
- Figure 58: Middle East and Africa Privacy Filters Industry Revenue (Million), by End-user Industry 2024 & 2032
- Figure 59: Middle East and Africa Privacy Filters Industry Revenue Share (%), by End-user Industry 2024 & 2032
- Figure 60: Middle East and Africa Privacy Filters Industry Revenue (Million), by Country 2024 & 2032
- Figure 61: Middle East and Africa Privacy Filters Industry Revenue Share (%), by Country 2024 & 2032
List of Tables
- Table 1: Global Privacy Filters Industry Revenue Million Forecast, by Region 2019 & 2032
- Table 2: Global Privacy Filters Industry Revenue Million Forecast, by Application 2019 & 2032
- Table 3: Global Privacy Filters Industry Revenue Million Forecast, by Feature 2019 & 2032
- Table 4: Global Privacy Filters Industry Revenue Million Forecast, by End-user Industry 2019 & 2032
- Table 5: Global Privacy Filters Industry Revenue Million Forecast, by Region 2019 & 2032
- Table 6: Global Privacy Filters Industry Revenue Million Forecast, by Country 2019 & 2032
- Table 7: United States Privacy Filters Industry Revenue (Million) Forecast, by Application 2019 & 2032
- Table 8: Canada Privacy Filters Industry Revenue (Million) Forecast, by Application 2019 & 2032
- Table 9: Mexico Privacy Filters Industry Revenue (Million) Forecast, by Application 2019 & 2032
- Table 10: Global Privacy Filters Industry Revenue Million Forecast, by Country 2019 & 2032
- Table 11: Germany Privacy Filters Industry Revenue (Million) Forecast, by Application 2019 & 2032
- Table 12: United Kingdom Privacy Filters Industry Revenue (Million) Forecast, by Application 2019 & 2032
- Table 13: France Privacy Filters Industry Revenue (Million) Forecast, by Application 2019 & 2032
- Table 14: Spain Privacy Filters Industry Revenue (Million) Forecast, by Application 2019 & 2032
- Table 15: Italy Privacy Filters Industry Revenue (Million) Forecast, by Application 2019 & 2032
- Table 16: Spain Privacy Filters Industry Revenue (Million) Forecast, by Application 2019 & 2032
- Table 17: Belgium Privacy Filters Industry Revenue (Million) Forecast, by Application 2019 & 2032
- Table 18: Netherland Privacy Filters Industry Revenue (Million) Forecast, by Application 2019 & 2032
- Table 19: Nordics Privacy Filters Industry Revenue (Million) Forecast, by Application 2019 & 2032
- Table 20: Rest of Europe Privacy Filters Industry Revenue (Million) Forecast, by Application 2019 & 2032
- Table 21: Global Privacy Filters Industry Revenue Million Forecast, by Country 2019 & 2032
- Table 22: China Privacy Filters Industry Revenue (Million) Forecast, by Application 2019 & 2032
- Table 23: Japan Privacy Filters Industry Revenue (Million) Forecast, by Application 2019 & 2032
- Table 24: India Privacy Filters Industry Revenue (Million) Forecast, by Application 2019 & 2032
- Table 25: South Korea Privacy Filters Industry Revenue (Million) Forecast, by Application 2019 & 2032
- Table 26: Southeast Asia Privacy Filters Industry Revenue (Million) Forecast, by Application 2019 & 2032
- Table 27: Australia Privacy Filters Industry Revenue (Million) Forecast, by Application 2019 & 2032
- Table 28: Indonesia Privacy Filters Industry Revenue (Million) Forecast, by Application 2019 & 2032
- Table 29: Phillipes Privacy Filters Industry Revenue (Million) Forecast, by Application 2019 & 2032
- Table 30: Singapore Privacy Filters Industry Revenue (Million) Forecast, by Application 2019 & 2032
- Table 31: Thailandc Privacy Filters Industry Revenue (Million) Forecast, by Application 2019 & 2032
- Table 32: Rest of Asia Pacific Privacy Filters Industry Revenue (Million) Forecast, by Application 2019 & 2032
- Table 33: Global Privacy Filters Industry Revenue Million Forecast, by Country 2019 & 2032
- Table 34: Brazil Privacy Filters Industry Revenue (Million) Forecast, by Application 2019 & 2032
- Table 35: Argentina Privacy Filters Industry Revenue (Million) Forecast, by Application 2019 & 2032
- Table 36: Peru Privacy Filters Industry Revenue (Million) Forecast, by Application 2019 & 2032
- Table 37: Chile Privacy Filters Industry Revenue (Million) Forecast, by Application 2019 & 2032
- Table 38: Colombia Privacy Filters Industry Revenue (Million) Forecast, by Application 2019 & 2032
- Table 39: Ecuador Privacy Filters Industry Revenue (Million) Forecast, by Application 2019 & 2032
- Table 40: Venezuela Privacy Filters Industry Revenue (Million) Forecast, by Application 2019 & 2032
- Table 41: Rest of South America Privacy Filters Industry Revenue (Million) Forecast, by Application 2019 & 2032
- Table 42: Global Privacy Filters Industry Revenue Million Forecast, by Country 2019 & 2032
- Table 43: United States Privacy Filters Industry Revenue (Million) Forecast, by Application 2019 & 2032
- Table 44: Canada Privacy Filters Industry Revenue (Million) Forecast, by Application 2019 & 2032
- Table 45: Mexico Privacy Filters Industry Revenue (Million) Forecast, by Application 2019 & 2032
- Table 46: Global Privacy Filters Industry Revenue Million Forecast, by Country 2019 & 2032
- Table 47: United Arab Emirates Privacy Filters Industry Revenue (Million) Forecast, by Application 2019 & 2032
- Table 48: Saudi Arabia Privacy Filters Industry Revenue (Million) Forecast, by Application 2019 & 2032
- Table 49: South Africa Privacy Filters Industry Revenue (Million) Forecast, by Application 2019 & 2032
- Table 50: Rest of Middle East and Africa Privacy Filters Industry Revenue (Million) Forecast, by Application 2019 & 2032
- Table 51: Global Privacy Filters Industry Revenue Million Forecast, by Application 2019 & 2032
- Table 52: Global Privacy Filters Industry Revenue Million Forecast, by Feature 2019 & 2032
- Table 53: Global Privacy Filters Industry Revenue Million Forecast, by End-user Industry 2019 & 2032
- Table 54: Global Privacy Filters Industry Revenue Million Forecast, by Country 2019 & 2032
- Table 55: Global Privacy Filters Industry Revenue Million Forecast, by Application 2019 & 2032
- Table 56: Global Privacy Filters Industry Revenue Million Forecast, by Feature 2019 & 2032
- Table 57: Global Privacy Filters Industry Revenue Million Forecast, by End-user Industry 2019 & 2032
- Table 58: Global Privacy Filters Industry Revenue Million Forecast, by Country 2019 & 2032
- Table 59: Global Privacy Filters Industry Revenue Million Forecast, by Application 2019 & 2032
- Table 60: Global Privacy Filters Industry Revenue Million Forecast, by Feature 2019 & 2032
- Table 61: Global Privacy Filters Industry Revenue Million Forecast, by End-user Industry 2019 & 2032
- Table 62: Global Privacy Filters Industry Revenue Million Forecast, by Country 2019 & 2032
- Table 63: Global Privacy Filters Industry Revenue Million Forecast, by Application 2019 & 2032
- Table 64: Global Privacy Filters Industry Revenue Million Forecast, by Feature 2019 & 2032
- Table 65: Global Privacy Filters Industry Revenue Million Forecast, by End-user Industry 2019 & 2032
- Table 66: Global Privacy Filters Industry Revenue Million Forecast, by Country 2019 & 2032
- Table 67: Global Privacy Filters Industry Revenue Million Forecast, by Application 2019 & 2032
- Table 68: Global Privacy Filters Industry Revenue Million Forecast, by Feature 2019 & 2032
- Table 69: Global Privacy Filters Industry Revenue Million Forecast, by End-user Industry 2019 & 2032
- Table 70: Global Privacy Filters Industry Revenue Million Forecast, by Country 2019 & 2032
- Table 71: Global Privacy Filters Industry Revenue Million Forecast, by Application 2019 & 2032
- Table 72: Global Privacy Filters Industry Revenue Million Forecast, by Feature 2019 & 2032
- Table 73: Global Privacy Filters Industry Revenue Million Forecast, by End-user Industry 2019 & 2032
- Table 74: Global Privacy Filters Industry Revenue Million Forecast, by Country 2019 & 2032
Frequently Asked Questions
1. What is the projected Compound Annual Growth Rate (CAGR) of the Privacy Filters Industry?
The projected CAGR is approximately 12.96%.
2. Which companies are prominent players in the Privacy Filters Industry?
Key companies in the market include EPHY Privacy (Advance Services & Solutions Ltd), Fujitsu Limited*List Not Exhaustive, KAPSOLO Europe ApS, Fellowes Brands, Tech Armor, 3M Company, Upscreen (Bedifol GmbH), Dell Inc, Targus, Kensington Computer Products Group (ACCO Brands), MoniFilm (Right Group Co Ltd).
3. What are the main segments of the Privacy Filters Industry?
The market segments include Application, Feature, End-user Industry.
4. Can you provide details about the market size?
The market size is estimated to be USD 1.22 Million as of 2022.
5. What are some drivers contributing to market growth?
Optical Comfort and Device Protection; Rising Data Privacy and Security Concerns.
6. What are the notable trends driving market growth?
Financial Institutions to Hold Major Share.
7. Are there any restraints impacting market growth?
Lack of Awareness about the Privacy Filters among the Users.
8. Can you provide examples of recent developments in the market?
November 2022- GPOPlus, a distribution company, signed a master services agreement with Tech Armor. Tech Armor's sales are Direct to Consumer (DTC). With this collaboration, DISTRO+ (GPOX's distribution division and GPO for specialty retailers) will expand its b2b business by selling to wholesalers and its nationwide network. This results in helping customers who want to buy Tech Armor products will be able to do so at their local retailer rather than only online.
9. What pricing options are available for accessing the report?
Pricing options include single-user, multi-user, and enterprise licenses priced at USD 4750, USD 5250, and USD 8750 respectively.
10. Is the market size provided in terms of value or volume?
The market size is provided in terms of value, measured in Million.
11. Are there any specific market keywords associated with the report?
Yes, the market keyword associated with the report is "Privacy Filters Industry," which aids in identifying and referencing the specific market segment covered.
12. How do I determine which pricing option suits my needs best?
The pricing options vary based on user requirements and access needs. Individual users may opt for single-user licenses, while businesses requiring broader access may choose multi-user or enterprise licenses for cost-effective access to the report.
13. Are there any additional resources or data provided in the Privacy Filters Industry report?
While the report offers comprehensive insights, it's advisable to review the specific contents or supplementary materials provided to ascertain if additional resources or data are available.
14. How can I stay updated on further developments or reports in the Privacy Filters Industry?
To stay informed about further developments, trends, and reports in the Privacy Filters Industry, consider subscribing to industry newsletters, following relevant companies and organizations, or regularly checking reputable industry news sources and publications.
Methodology
Step 1 - Identification of Relevant Samples Size from Population Database


Step 2 - Approaches for Defining Global Market Size (Value, Volume* & Price*)

Note*: In applicable scenarios
Step 3 - Data Sources
Primary Research
- Web Analytics
- Survey Reports
- Research Institute
- Latest Research Reports
- Opinion Leaders
Secondary Research
- Annual Reports
- White Paper
- Latest Press Release
- Industry Association
- Paid Database
- Investor Presentations

Step 4 - Data Triangulation
Involves using different sources of information in order to increase the validity of a study
These sources are likely to be stakeholders in a program - participants, other researchers, program staff, other community members, and so on.
Then we put all data in single framework & apply various statistical tools to find out the dynamic on the market.
During the analysis stage, feedback from the stakeholder groups would be compared to determine areas of agreement as well as areas of divergence


