
Key Insights
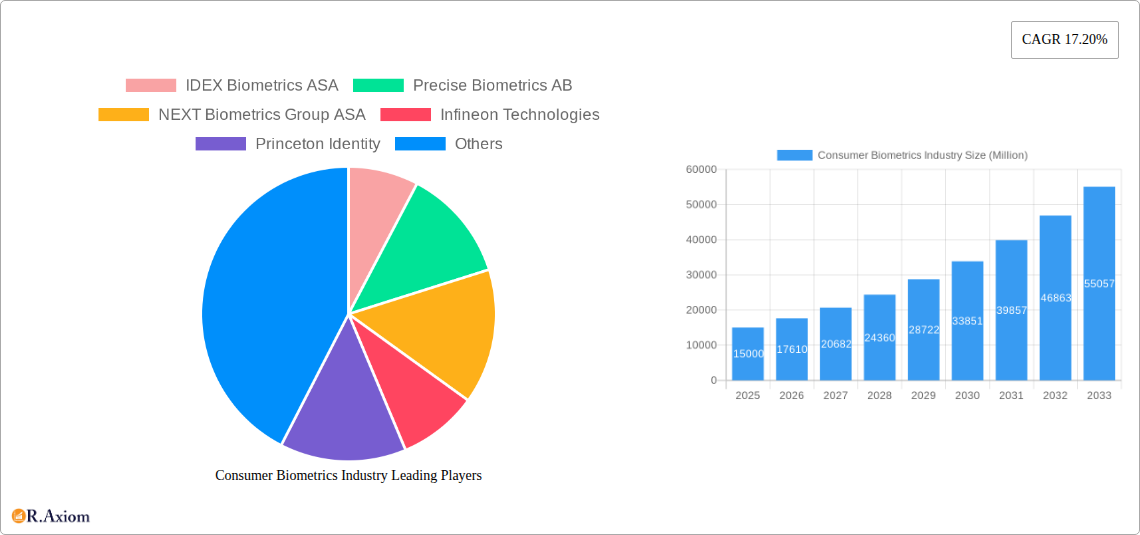
The consumer biometrics market is experiencing robust growth, projected to reach a substantial size by 2033, driven by a 17.20% Compound Annual Growth Rate (CAGR) from 2025 to 2033. This expansion is fueled by several key factors. The increasing adoption of smartphones, wearables, and IoT devices necessitates secure and convenient authentication methods, making biometric technologies highly attractive. Furthermore, advancements in sensing technology, particularly in fingerprint, face, and iris recognition, are leading to more accurate, reliable, and user-friendly systems. Government regulations promoting data privacy and security are also bolstering market demand, as biometric authentication offers a strong alternative to traditional password-based systems. The automotive sector is another significant growth driver, with biometric access and driver identification becoming increasingly prevalent features in high-end vehicles and gradually filtering down to more affordable models. Competition amongst established players like Apple, Qualcomm, and Infineon, along with emerging innovative companies, is fostering rapid innovation and driving down costs, making biometric technology accessible to a wider consumer base.
However, challenges remain. Data privacy concerns and the potential for security breaches, though mitigated by robust encryption and authentication protocols, continue to be a factor influencing market adoption. The high initial investment required for implementation, particularly for large-scale deployments in sectors like automotive or government infrastructure, can also act as a restraint for some businesses. Overcoming these challenges through robust security measures, consumer education, and cost-effective solutions will be crucial for realizing the full potential of this rapidly expanding market. The market segmentation by sensing module (fingerprint, face, iris) and end-user (smartphones, automotive, wearables, etc.) highlights diverse application areas and the need for tailored solutions to cater to specific market needs. Geographical expansion, particularly in developing economies with rising smartphone penetration, presents significant opportunities for future growth.
This in-depth report provides a comprehensive analysis of the Consumer Biometrics Industry, offering invaluable insights for stakeholders, investors, and industry professionals. Covering the period from 2019 to 2033, with a focus on 2025, this report meticulously examines market trends, growth drivers, challenges, and emerging opportunities. The report leverages extensive data analysis to provide accurate market sizing and forecasts, allowing for informed strategic decision-making. The study segments the market by sensing module (fingerprint, face recognition, eye/iris recognition) and end-user (automotive, smartphone/tablet, PC/laptop, wearables, IoT devices, other end-users), providing a granular understanding of the market landscape.
Consumer Biometrics Industry Market Concentration & Innovation
The consumer biometrics market exhibits a moderately concentrated landscape, with several key players holding significant market share. In 2025, the top five companies are estimated to control approximately xx% of the market. However, the market is witnessing increasing innovation, driven by advancements in sensor technology, AI algorithms, and miniaturization. Regulatory frameworks, particularly concerning data privacy and security, are evolving, impacting market dynamics. Product substitution, primarily through alternative authentication methods, poses a moderate threat. End-user preferences are shifting towards seamless and secure biometric authentication experiences, while M&A activity remains robust. Significant deals, totaling approximately $xx Million in 2024, have reshaped the competitive landscape, leading to both consolidation and diversification within the industry.
- Market Share Concentration (2025): Top 5 players: xx%
- M&A Deal Value (2024): Approximately $xx Million
- Key Innovation Drivers: Miniaturization, AI-powered algorithms, enhanced security features.
- Regulatory Landscape: GDPR, CCPA, and other regional regulations significantly impact data privacy and security standards.
Consumer Biometrics Industry Industry Trends & Insights
The consumer biometrics market is experiencing robust growth, driven by the increasing demand for secure authentication across various applications. The market is projected to achieve a CAGR of xx% during the forecast period (2025-2033), reaching a market value of $xx Million by 2033. This growth is fueled by the rising adoption of smartphones, wearables, and IoT devices, each integrating biometric authentication for enhanced security and user experience. Technological disruptions, including advancements in 3D facial recognition and in-display fingerprint sensors, are continuously shaping market dynamics. Consumer preferences are shifting towards contactless and more convenient biometric solutions. Competitive dynamics are characterized by intense innovation, strategic partnerships, and mergers & acquisitions. Market penetration rates for biometric authentication in smartphones are expected to reach xx% by 2033.

Dominant Markets & Segments in Consumer Biometrics Industry
The smartphone/tablet segment dominates the consumer biometrics market, accounting for xx% of the total market value in 2025. This is driven by high smartphone penetration rates, particularly in developed economies, and the increasing integration of biometric features in premium and mid-range devices. The fingerprint sensing module is the leading segment by sensing module, capturing xx% of the market share due to its mature technology, cost-effectiveness, and widespread adoption. Geographically, North America and Asia-Pacific are the leading regions, with strong consumer electronics adoption rates and substantial investments in biometric technologies.
- Dominant Segment (By End-User): Smartphone/Tablet
- Dominant Segment (By Sensing Module): Fingerprint
- Key Drivers (Smartphone/Tablet): High smartphone penetration, rising consumer demand for enhanced security.
- Key Drivers (Fingerprint): Maturity of technology, cost-effectiveness, widespread consumer acceptance.
- Dominant Region: North America and Asia-Pacific (due to strong consumer electronics markets).
Consumer Biometrics Industry Product Developments
Recent product innovations include increasingly sophisticated fingerprint sensors that offer improved accuracy and security, 3D facial recognition systems that overcome spoofing vulnerabilities, and advanced eye/iris recognition technologies that are less susceptible to environmental conditions. The focus is on seamless integration into devices and user-friendly interfaces. Competitive advantages are gained through superior accuracy, speed, security features, power efficiency, and miniaturization of biometric sensors.
Report Scope & Segmentation Analysis
This report segments the consumer biometrics market by sensing module (fingerprint, face recognition, eye/iris recognition) and end-user (automotive, smartphone/tablet, PC/laptop, wearables, IoT devices, other end-users). Each segment's growth projections, market size, and competitive landscape are analyzed. The fingerprint segment is expected to maintain significant growth due to its established technology and cost-effectiveness, while face recognition and eye/iris recognition are anticipated to experience substantial growth due to increased demand for advanced security features and contactless authentication. The smartphone/tablet segment is expected to be the largest, followed by wearables and IoT devices. Competitive dynamics vary across segments, with differing levels of concentration and technological advancement.
Key Drivers of Consumer Biometrics Industry Growth
Several factors are driving the growth of the consumer biometrics industry: increasing demand for enhanced security and privacy, rising adoption of smartphones and other connected devices, technological advancements in sensor technology and AI algorithms, favorable government regulations promoting biometric authentication, and decreasing costs of biometric components.
Challenges in the Consumer Biometrics Industry Sector
The consumer biometrics industry faces challenges such as concerns about data privacy and security breaches, high initial investment costs for adopting new technologies, technical complexities of integrating biometric systems into diverse devices, and the risk of spoofing and other security vulnerabilities impacting reliability and market trust. These factors have resulted in market growth limitations estimated at xx% annually in the past 5 years.
Emerging Opportunities in Consumer Biometrics Industry
Emerging opportunities include the growing adoption of biometrics in diverse applications such as automotive, healthcare, and access control, the development of more accurate and secure authentication technologies, the integration of biometrics with other security features, and the emergence of new market segments such as contactless payments and smart home security.
Leading Players in the Consumer Biometrics Industry Market
- IDEX Biometrics ASA
- Precise Biometrics AB
- NEXT Biometrics Group ASA
- Infineon Technologies
- Princeton Identity
- Omnivision Technologies
- Egis Technologies Inc
- STMicroelectronics NV
- Qualcomm Incorporated
- ON Semiconductor
- Synaptics Inc
- LG Innotek Co Ltd
- Idemia France SAS
- Knowles Electronics LLC
- Apple Inc
- Shenzhen Goodix Technology Co Ltd
- Assa Abloy AB
Key Developments in Consumer Biometrics Industry Industry
- Q4 2022: Apple launches improved Face ID technology in its latest iPhone models.
- Q2 2023: IDEX Biometrics secures a major contract for fingerprint sensors in a new line of Android smartphones.
- Q3 2023: Precise Biometrics announces a partnership with a leading automotive manufacturer to integrate its fingerprint authentication system in vehicles.
Strategic Outlook for Consumer Biometrics Industry Market
The consumer biometrics market is poised for continued expansion driven by ongoing technological innovation, increasing demand for secure authentication across diverse applications, and the rising adoption of smartphones and other connected devices. New opportunities are emerging in areas such as in-display fingerprint sensors, advanced 3D facial recognition, and improved eye/iris scanning. The market is expected to witness further consolidation through mergers and acquisitions as companies strive to strengthen their market position and expand their product portfolios. The focus on enhanced security, privacy, and user experience will remain key drivers of market growth.
Consumer Biometrics Industry Segmentation
-
1. Sensing Module
- 1.1. Fingerprint
- 1.2. Face Recognition
- 1.3. Eye/Iris Recognition
-
2. End Users
- 2.1. Automotive
- 2.2. Smartphone/Tablet
- 2.3. Pc/Laptop
- 2.4. Wearables
- 2.5. IoT Devices
- 2.6. Other End Users
Consumer Biometrics Industry Segmentation By Geography
- 1. North America: United States Canada Mexico
- 2. Europe: Germany: France: Italy: United Kingdom Netherlands Rest of Europe
- 3. Asia Pacific: China, Japan, India, South Korea, Taiwan, Australia, Rest of Asia-Pacific
- 4. South America : Brazil, Argentina, Rest of South America
- 5. MEA: Middle East, Africa

Consumer Biometrics Industry REPORT HIGHLIGHTS
| Aspects | Details |
|---|---|
| Study Period | 2019-2033 |
| Base Year | 2024 |
| Estimated Year | 2025 |
| Forecast Period | 2025-2033 |
| Historical Period | 2019-2024 |
| Growth Rate | CAGR of 17.20% from 2019-2033 |
| Segmentation |
|
Table of Contents
- 1. Introduction
- 1.1. Research Scope
- 1.2. Market Segmentation
- 1.3. Research Methodology
- 1.4. Definitions and Assumptions
- 2. Executive Summary
- 2.1. Introduction
- 3. Market Dynamics
- 3.1. Introduction
- 3.2. Market Drivers
- 3.2.1. ; Widening Applications of Biometrics; Technological Advancements in Biometrics
- 3.3. Market Restrains
- 3.3.1. ; Data Security and Privacy Concerns
- 3.4. Market Trends
- 3.4.1. Fingerprint Sensing Modules to Hold the Major Share
- 4. Market Factor Analysis
- 4.1. Porters Five Forces
- 4.2. Supply/Value Chain
- 4.3. PESTEL analysis
- 4.4. Market Entropy
- 4.5. Patent/Trademark Analysis
- 5. Global Consumer Biometrics Industry Analysis, Insights and Forecast, 2019-2031
- 5.1. Market Analysis, Insights and Forecast - by Sensing Module
- 5.1.1. Fingerprint
- 5.1.2. Face Recognition
- 5.1.3. Eye/Iris Recognition
- 5.2. Market Analysis, Insights and Forecast - by End Users
- 5.2.1. Automotive
- 5.2.2. Smartphone/Tablet
- 5.2.3. Pc/Laptop
- 5.2.4. Wearables
- 5.2.5. IoT Devices
- 5.2.6. Other End Users
- 5.3. Market Analysis, Insights and Forecast - by Region
- 5.3.1. North America: United States Canada Mexico
- 5.3.2. Europe: Germany: France: Italy: United Kingdom Netherlands Rest of Europe
- 5.3.3. Asia Pacific: China, Japan, India, South Korea, Taiwan, Australia, Rest of Asia-Pacific
- 5.3.4. South America : Brazil, Argentina, Rest of South America
- 5.3.5. MEA: Middle East, Africa
- 5.1. Market Analysis, Insights and Forecast - by Sensing Module
- 6. North America: United States Canada Mexico Consumer Biometrics Industry Analysis, Insights and Forecast, 2019-2031
- 6.1. Market Analysis, Insights and Forecast - by Sensing Module
- 6.1.1. Fingerprint
- 6.1.2. Face Recognition
- 6.1.3. Eye/Iris Recognition
- 6.2. Market Analysis, Insights and Forecast - by End Users
- 6.2.1. Automotive
- 6.2.2. Smartphone/Tablet
- 6.2.3. Pc/Laptop
- 6.2.4. Wearables
- 6.2.5. IoT Devices
- 6.2.6. Other End Users
- 6.1. Market Analysis, Insights and Forecast - by Sensing Module
- 7. Europe: Germany: France: Italy: United Kingdom Netherlands Rest of Europe Consumer Biometrics Industry Analysis, Insights and Forecast, 2019-2031
- 7.1. Market Analysis, Insights and Forecast - by Sensing Module
- 7.1.1. Fingerprint
- 7.1.2. Face Recognition
- 7.1.3. Eye/Iris Recognition
- 7.2. Market Analysis, Insights and Forecast - by End Users
- 7.2.1. Automotive
- 7.2.2. Smartphone/Tablet
- 7.2.3. Pc/Laptop
- 7.2.4. Wearables
- 7.2.5. IoT Devices
- 7.2.6. Other End Users
- 7.1. Market Analysis, Insights and Forecast - by Sensing Module
- 8. Asia Pacific: China, Japan, India, South Korea, Taiwan, Australia, Rest of Asia-Pacific Consumer Biometrics Industry Analysis, Insights and Forecast, 2019-2031
- 8.1. Market Analysis, Insights and Forecast - by Sensing Module
- 8.1.1. Fingerprint
- 8.1.2. Face Recognition
- 8.1.3. Eye/Iris Recognition
- 8.2. Market Analysis, Insights and Forecast - by End Users
- 8.2.1. Automotive
- 8.2.2. Smartphone/Tablet
- 8.2.3. Pc/Laptop
- 8.2.4. Wearables
- 8.2.5. IoT Devices
- 8.2.6. Other End Users
- 8.1. Market Analysis, Insights and Forecast - by Sensing Module
- 9. South America : Brazil, Argentina, Rest of South America Consumer Biometrics Industry Analysis, Insights and Forecast, 2019-2031
- 9.1. Market Analysis, Insights and Forecast - by Sensing Module
- 9.1.1. Fingerprint
- 9.1.2. Face Recognition
- 9.1.3. Eye/Iris Recognition
- 9.2. Market Analysis, Insights and Forecast - by End Users
- 9.2.1. Automotive
- 9.2.2. Smartphone/Tablet
- 9.2.3. Pc/Laptop
- 9.2.4. Wearables
- 9.2.5. IoT Devices
- 9.2.6. Other End Users
- 9.1. Market Analysis, Insights and Forecast - by Sensing Module
- 10. MEA: Middle East, Africa Consumer Biometrics Industry Analysis, Insights and Forecast, 2019-2031
- 10.1. Market Analysis, Insights and Forecast - by Sensing Module
- 10.1.1. Fingerprint
- 10.1.2. Face Recognition
- 10.1.3. Eye/Iris Recognition
- 10.2. Market Analysis, Insights and Forecast - by End Users
- 10.2.1. Automotive
- 10.2.2. Smartphone/Tablet
- 10.2.3. Pc/Laptop
- 10.2.4. Wearables
- 10.2.5. IoT Devices
- 10.2.6. Other End Users
- 10.1. Market Analysis, Insights and Forecast - by Sensing Module
- 11. North America Consumer Biometrics Industry Analysis, Insights and Forecast, 2019-2031
- 11.1. Market Analysis, Insights and Forecast - By Country/Sub-region
- 11.1.1 United States
- 11.1.2 Canada
- 11.1.3 Mexico
- 12. Europe Consumer Biometrics Industry Analysis, Insights and Forecast, 2019-2031
- 12.1. Market Analysis, Insights and Forecast - By Country/Sub-region
- 12.1.1 Germany
- 12.1.2 United Kingdom
- 12.1.3 France
- 12.1.4 Spain
- 12.1.5 Italy
- 12.1.6 Spain
- 12.1.7 Belgium
- 12.1.8 Netherland
- 12.1.9 Nordics
- 12.1.10 Rest of Europe
- 13. Asia Pacific Consumer Biometrics Industry Analysis, Insights and Forecast, 2019-2031
- 13.1. Market Analysis, Insights and Forecast - By Country/Sub-region
- 13.1.1 China
- 13.1.2 Japan
- 13.1.3 India
- 13.1.4 South Korea
- 13.1.5 Southeast Asia
- 13.1.6 Australia
- 13.1.7 Indonesia
- 13.1.8 Phillipes
- 13.1.9 Singapore
- 13.1.10 Thailandc
- 13.1.11 Rest of Asia Pacific
- 14. South America Consumer Biometrics Industry Analysis, Insights and Forecast, 2019-2031
- 14.1. Market Analysis, Insights and Forecast - By Country/Sub-region
- 14.1.1 Brazil
- 14.1.2 Argentina
- 14.1.3 Peru
- 14.1.4 Chile
- 14.1.5 Colombia
- 14.1.6 Ecuador
- 14.1.7 Venezuela
- 14.1.8 Rest of South America
- 15. North America Consumer Biometrics Industry Analysis, Insights and Forecast, 2019-2031
- 15.1. Market Analysis, Insights and Forecast - By Country/Sub-region
- 15.1.1 United States
- 15.1.2 Canada
- 15.1.3 Mexico
- 16. MEA Consumer Biometrics Industry Analysis, Insights and Forecast, 2019-2031
- 16.1. Market Analysis, Insights and Forecast - By Country/Sub-region
- 16.1.1 United Arab Emirates
- 16.1.2 Saudi Arabia
- 16.1.3 South Africa
- 16.1.4 Rest of Middle East and Africa
- 17. Competitive Analysis
- 17.1. Global Market Share Analysis 2024
- 17.2. Company Profiles
- 17.2.1 IDEX Biometrics ASA
- 17.2.1.1. Overview
- 17.2.1.2. Products
- 17.2.1.3. SWOT Analysis
- 17.2.1.4. Recent Developments
- 17.2.1.5. Financials (Based on Availability)
- 17.2.2 Precise Biometrics AB
- 17.2.2.1. Overview
- 17.2.2.2. Products
- 17.2.2.3. SWOT Analysis
- 17.2.2.4. Recent Developments
- 17.2.2.5. Financials (Based on Availability)
- 17.2.3 NEXT Biometrics Group ASA
- 17.2.3.1. Overview
- 17.2.3.2. Products
- 17.2.3.3. SWOT Analysis
- 17.2.3.4. Recent Developments
- 17.2.3.5. Financials (Based on Availability)
- 17.2.4 Infineon Technologies
- 17.2.4.1. Overview
- 17.2.4.2. Products
- 17.2.4.3. SWOT Analysis
- 17.2.4.4. Recent Developments
- 17.2.4.5. Financials (Based on Availability)
- 17.2.5 Princeton Identity
- 17.2.5.1. Overview
- 17.2.5.2. Products
- 17.2.5.3. SWOT Analysis
- 17.2.5.4. Recent Developments
- 17.2.5.5. Financials (Based on Availability)
- 17.2.6 Omnivision Technologies
- 17.2.6.1. Overview
- 17.2.6.2. Products
- 17.2.6.3. SWOT Analysis
- 17.2.6.4. Recent Developments
- 17.2.6.5. Financials (Based on Availability)
- 17.2.7 Egis Technologies Inc
- 17.2.7.1. Overview
- 17.2.7.2. Products
- 17.2.7.3. SWOT Analysis
- 17.2.7.4. Recent Developments
- 17.2.7.5. Financials (Based on Availability)
- 17.2.8 STMicroelectronics NV
- 17.2.8.1. Overview
- 17.2.8.2. Products
- 17.2.8.3. SWOT Analysis
- 17.2.8.4. Recent Developments
- 17.2.8.5. Financials (Based on Availability)
- 17.2.9 Qualcomm Incorporated
- 17.2.9.1. Overview
- 17.2.9.2. Products
- 17.2.9.3. SWOT Analysis
- 17.2.9.4. Recent Developments
- 17.2.9.5. Financials (Based on Availability)
- 17.2.10 ON Semiconductor
- 17.2.10.1. Overview
- 17.2.10.2. Products
- 17.2.10.3. SWOT Analysis
- 17.2.10.4. Recent Developments
- 17.2.10.5. Financials (Based on Availability)
- 17.2.11 Synaptics Inc
- 17.2.11.1. Overview
- 17.2.11.2. Products
- 17.2.11.3. SWOT Analysis
- 17.2.11.4. Recent Developments
- 17.2.11.5. Financials (Based on Availability)
- 17.2.12 LG Innotek Co Ltd
- 17.2.12.1. Overview
- 17.2.12.2. Products
- 17.2.12.3. SWOT Analysis
- 17.2.12.4. Recent Developments
- 17.2.12.5. Financials (Based on Availability)
- 17.2.13 Idemia France SAS
- 17.2.13.1. Overview
- 17.2.13.2. Products
- 17.2.13.3. SWOT Analysis
- 17.2.13.4. Recent Developments
- 17.2.13.5. Financials (Based on Availability)
- 17.2.14 Knowles Electronics LLC
- 17.2.14.1. Overview
- 17.2.14.2. Products
- 17.2.14.3. SWOT Analysis
- 17.2.14.4. Recent Developments
- 17.2.14.5. Financials (Based on Availability)
- 17.2.15 Apple Inc
- 17.2.15.1. Overview
- 17.2.15.2. Products
- 17.2.15.3. SWOT Analysis
- 17.2.15.4. Recent Developments
- 17.2.15.5. Financials (Based on Availability)
- 17.2.16 Shenzhen Goodix Technology Co Ltd
- 17.2.16.1. Overview
- 17.2.16.2. Products
- 17.2.16.3. SWOT Analysis
- 17.2.16.4. Recent Developments
- 17.2.16.5. Financials (Based on Availability)
- 17.2.17 Assa Abloy AB
- 17.2.17.1. Overview
- 17.2.17.2. Products
- 17.2.17.3. SWOT Analysis
- 17.2.17.4. Recent Developments
- 17.2.17.5. Financials (Based on Availability)
- 17.2.1 IDEX Biometrics ASA
List of Figures
- Figure 1: Global Consumer Biometrics Industry Revenue Breakdown (Million, %) by Region 2024 & 2032
- Figure 2: North America Consumer Biometrics Industry Revenue (Million), by Country 2024 & 2032
- Figure 3: North America Consumer Biometrics Industry Revenue Share (%), by Country 2024 & 2032
- Figure 4: Europe Consumer Biometrics Industry Revenue (Million), by Country 2024 & 2032
- Figure 5: Europe Consumer Biometrics Industry Revenue Share (%), by Country 2024 & 2032
- Figure 6: Asia Pacific Consumer Biometrics Industry Revenue (Million), by Country 2024 & 2032
- Figure 7: Asia Pacific Consumer Biometrics Industry Revenue Share (%), by Country 2024 & 2032
- Figure 8: South America Consumer Biometrics Industry Revenue (Million), by Country 2024 & 2032
- Figure 9: South America Consumer Biometrics Industry Revenue Share (%), by Country 2024 & 2032
- Figure 10: North America Consumer Biometrics Industry Revenue (Million), by Country 2024 & 2032
- Figure 11: North America Consumer Biometrics Industry Revenue Share (%), by Country 2024 & 2032
- Figure 12: MEA Consumer Biometrics Industry Revenue (Million), by Country 2024 & 2032
- Figure 13: MEA Consumer Biometrics Industry Revenue Share (%), by Country 2024 & 2032
- Figure 14: North America: United States Canada Mexico Consumer Biometrics Industry Revenue (Million), by Sensing Module 2024 & 2032
- Figure 15: North America: United States Canada Mexico Consumer Biometrics Industry Revenue Share (%), by Sensing Module 2024 & 2032
- Figure 16: North America: United States Canada Mexico Consumer Biometrics Industry Revenue (Million), by End Users 2024 & 2032
- Figure 17: North America: United States Canada Mexico Consumer Biometrics Industry Revenue Share (%), by End Users 2024 & 2032
- Figure 18: North America: United States Canada Mexico Consumer Biometrics Industry Revenue (Million), by Country 2024 & 2032
- Figure 19: North America: United States Canada Mexico Consumer Biometrics Industry Revenue Share (%), by Country 2024 & 2032
- Figure 20: Europe: Germany: France: Italy: United Kingdom Netherlands Rest of Europe Consumer Biometrics Industry Revenue (Million), by Sensing Module 2024 & 2032
- Figure 21: Europe: Germany: France: Italy: United Kingdom Netherlands Rest of Europe Consumer Biometrics Industry Revenue Share (%), by Sensing Module 2024 & 2032
- Figure 22: Europe: Germany: France: Italy: United Kingdom Netherlands Rest of Europe Consumer Biometrics Industry Revenue (Million), by End Users 2024 & 2032
- Figure 23: Europe: Germany: France: Italy: United Kingdom Netherlands Rest of Europe Consumer Biometrics Industry Revenue Share (%), by End Users 2024 & 2032
- Figure 24: Europe: Germany: France: Italy: United Kingdom Netherlands Rest of Europe Consumer Biometrics Industry Revenue (Million), by Country 2024 & 2032
- Figure 25: Europe: Germany: France: Italy: United Kingdom Netherlands Rest of Europe Consumer Biometrics Industry Revenue Share (%), by Country 2024 & 2032
- Figure 26: Asia Pacific: China, Japan, India, South Korea, Taiwan, Australia, Rest of Asia-Pacific Consumer Biometrics Industry Revenue (Million), by Sensing Module 2024 & 2032
- Figure 27: Asia Pacific: China, Japan, India, South Korea, Taiwan, Australia, Rest of Asia-Pacific Consumer Biometrics Industry Revenue Share (%), by Sensing Module 2024 & 2032
- Figure 28: Asia Pacific: China, Japan, India, South Korea, Taiwan, Australia, Rest of Asia-Pacific Consumer Biometrics Industry Revenue (Million), by End Users 2024 & 2032
- Figure 29: Asia Pacific: China, Japan, India, South Korea, Taiwan, Australia, Rest of Asia-Pacific Consumer Biometrics Industry Revenue Share (%), by End Users 2024 & 2032
- Figure 30: Asia Pacific: China, Japan, India, South Korea, Taiwan, Australia, Rest of Asia-Pacific Consumer Biometrics Industry Revenue (Million), by Country 2024 & 2032
- Figure 31: Asia Pacific: China, Japan, India, South Korea, Taiwan, Australia, Rest of Asia-Pacific Consumer Biometrics Industry Revenue Share (%), by Country 2024 & 2032
- Figure 32: South America : Brazil, Argentina, Rest of South America Consumer Biometrics Industry Revenue (Million), by Sensing Module 2024 & 2032
- Figure 33: South America : Brazil, Argentina, Rest of South America Consumer Biometrics Industry Revenue Share (%), by Sensing Module 2024 & 2032
- Figure 34: South America : Brazil, Argentina, Rest of South America Consumer Biometrics Industry Revenue (Million), by End Users 2024 & 2032
- Figure 35: South America : Brazil, Argentina, Rest of South America Consumer Biometrics Industry Revenue Share (%), by End Users 2024 & 2032
- Figure 36: South America : Brazil, Argentina, Rest of South America Consumer Biometrics Industry Revenue (Million), by Country 2024 & 2032
- Figure 37: South America : Brazil, Argentina, Rest of South America Consumer Biometrics Industry Revenue Share (%), by Country 2024 & 2032
- Figure 38: MEA: Middle East, Africa Consumer Biometrics Industry Revenue (Million), by Sensing Module 2024 & 2032
- Figure 39: MEA: Middle East, Africa Consumer Biometrics Industry Revenue Share (%), by Sensing Module 2024 & 2032
- Figure 40: MEA: Middle East, Africa Consumer Biometrics Industry Revenue (Million), by End Users 2024 & 2032
- Figure 41: MEA: Middle East, Africa Consumer Biometrics Industry Revenue Share (%), by End Users 2024 & 2032
- Figure 42: MEA: Middle East, Africa Consumer Biometrics Industry Revenue (Million), by Country 2024 & 2032
- Figure 43: MEA: Middle East, Africa Consumer Biometrics Industry Revenue Share (%), by Country 2024 & 2032
List of Tables
- Table 1: Global Consumer Biometrics Industry Revenue Million Forecast, by Region 2019 & 2032
- Table 2: Global Consumer Biometrics Industry Revenue Million Forecast, by Sensing Module 2019 & 2032
- Table 3: Global Consumer Biometrics Industry Revenue Million Forecast, by End Users 2019 & 2032
- Table 4: Global Consumer Biometrics Industry Revenue Million Forecast, by Region 2019 & 2032
- Table 5: Global Consumer Biometrics Industry Revenue Million Forecast, by Country 2019 & 2032
- Table 6: United States Consumer Biometrics Industry Revenue (Million) Forecast, by Application 2019 & 2032
- Table 7: Canada Consumer Biometrics Industry Revenue (Million) Forecast, by Application 2019 & 2032
- Table 8: Mexico Consumer Biometrics Industry Revenue (Million) Forecast, by Application 2019 & 2032
- Table 9: Global Consumer Biometrics Industry Revenue Million Forecast, by Country 2019 & 2032
- Table 10: Germany Consumer Biometrics Industry Revenue (Million) Forecast, by Application 2019 & 2032
- Table 11: United Kingdom Consumer Biometrics Industry Revenue (Million) Forecast, by Application 2019 & 2032
- Table 12: France Consumer Biometrics Industry Revenue (Million) Forecast, by Application 2019 & 2032
- Table 13: Spain Consumer Biometrics Industry Revenue (Million) Forecast, by Application 2019 & 2032
- Table 14: Italy Consumer Biometrics Industry Revenue (Million) Forecast, by Application 2019 & 2032
- Table 15: Spain Consumer Biometrics Industry Revenue (Million) Forecast, by Application 2019 & 2032
- Table 16: Belgium Consumer Biometrics Industry Revenue (Million) Forecast, by Application 2019 & 2032
- Table 17: Netherland Consumer Biometrics Industry Revenue (Million) Forecast, by Application 2019 & 2032
- Table 18: Nordics Consumer Biometrics Industry Revenue (Million) Forecast, by Application 2019 & 2032
- Table 19: Rest of Europe Consumer Biometrics Industry Revenue (Million) Forecast, by Application 2019 & 2032
- Table 20: Global Consumer Biometrics Industry Revenue Million Forecast, by Country 2019 & 2032
- Table 21: China Consumer Biometrics Industry Revenue (Million) Forecast, by Application 2019 & 2032
- Table 22: Japan Consumer Biometrics Industry Revenue (Million) Forecast, by Application 2019 & 2032
- Table 23: India Consumer Biometrics Industry Revenue (Million) Forecast, by Application 2019 & 2032
- Table 24: South Korea Consumer Biometrics Industry Revenue (Million) Forecast, by Application 2019 & 2032
- Table 25: Southeast Asia Consumer Biometrics Industry Revenue (Million) Forecast, by Application 2019 & 2032
- Table 26: Australia Consumer Biometrics Industry Revenue (Million) Forecast, by Application 2019 & 2032
- Table 27: Indonesia Consumer Biometrics Industry Revenue (Million) Forecast, by Application 2019 & 2032
- Table 28: Phillipes Consumer Biometrics Industry Revenue (Million) Forecast, by Application 2019 & 2032
- Table 29: Singapore Consumer Biometrics Industry Revenue (Million) Forecast, by Application 2019 & 2032
- Table 30: Thailandc Consumer Biometrics Industry Revenue (Million) Forecast, by Application 2019 & 2032
- Table 31: Rest of Asia Pacific Consumer Biometrics Industry Revenue (Million) Forecast, by Application 2019 & 2032
- Table 32: Global Consumer Biometrics Industry Revenue Million Forecast, by Country 2019 & 2032
- Table 33: Brazil Consumer Biometrics Industry Revenue (Million) Forecast, by Application 2019 & 2032
- Table 34: Argentina Consumer Biometrics Industry Revenue (Million) Forecast, by Application 2019 & 2032
- Table 35: Peru Consumer Biometrics Industry Revenue (Million) Forecast, by Application 2019 & 2032
- Table 36: Chile Consumer Biometrics Industry Revenue (Million) Forecast, by Application 2019 & 2032
- Table 37: Colombia Consumer Biometrics Industry Revenue (Million) Forecast, by Application 2019 & 2032
- Table 38: Ecuador Consumer Biometrics Industry Revenue (Million) Forecast, by Application 2019 & 2032
- Table 39: Venezuela Consumer Biometrics Industry Revenue (Million) Forecast, by Application 2019 & 2032
- Table 40: Rest of South America Consumer Biometrics Industry Revenue (Million) Forecast, by Application 2019 & 2032
- Table 41: Global Consumer Biometrics Industry Revenue Million Forecast, by Country 2019 & 2032
- Table 42: United States Consumer Biometrics Industry Revenue (Million) Forecast, by Application 2019 & 2032
- Table 43: Canada Consumer Biometrics Industry Revenue (Million) Forecast, by Application 2019 & 2032
- Table 44: Mexico Consumer Biometrics Industry Revenue (Million) Forecast, by Application 2019 & 2032
- Table 45: Global Consumer Biometrics Industry Revenue Million Forecast, by Country 2019 & 2032
- Table 46: United Arab Emirates Consumer Biometrics Industry Revenue (Million) Forecast, by Application 2019 & 2032
- Table 47: Saudi Arabia Consumer Biometrics Industry Revenue (Million) Forecast, by Application 2019 & 2032
- Table 48: South Africa Consumer Biometrics Industry Revenue (Million) Forecast, by Application 2019 & 2032
- Table 49: Rest of Middle East and Africa Consumer Biometrics Industry Revenue (Million) Forecast, by Application 2019 & 2032
- Table 50: Global Consumer Biometrics Industry Revenue Million Forecast, by Sensing Module 2019 & 2032
- Table 51: Global Consumer Biometrics Industry Revenue Million Forecast, by End Users 2019 & 2032
- Table 52: Global Consumer Biometrics Industry Revenue Million Forecast, by Country 2019 & 2032
- Table 53: Global Consumer Biometrics Industry Revenue Million Forecast, by Sensing Module 2019 & 2032
- Table 54: Global Consumer Biometrics Industry Revenue Million Forecast, by End Users 2019 & 2032
- Table 55: Global Consumer Biometrics Industry Revenue Million Forecast, by Country 2019 & 2032
- Table 56: Global Consumer Biometrics Industry Revenue Million Forecast, by Sensing Module 2019 & 2032
- Table 57: Global Consumer Biometrics Industry Revenue Million Forecast, by End Users 2019 & 2032
- Table 58: Global Consumer Biometrics Industry Revenue Million Forecast, by Country 2019 & 2032
- Table 59: Global Consumer Biometrics Industry Revenue Million Forecast, by Sensing Module 2019 & 2032
- Table 60: Global Consumer Biometrics Industry Revenue Million Forecast, by End Users 2019 & 2032
- Table 61: Global Consumer Biometrics Industry Revenue Million Forecast, by Country 2019 & 2032
- Table 62: Global Consumer Biometrics Industry Revenue Million Forecast, by Sensing Module 2019 & 2032
- Table 63: Global Consumer Biometrics Industry Revenue Million Forecast, by End Users 2019 & 2032
- Table 64: Global Consumer Biometrics Industry Revenue Million Forecast, by Country 2019 & 2032
Frequently Asked Questions
1. What is the projected Compound Annual Growth Rate (CAGR) of the Consumer Biometrics Industry?
The projected CAGR is approximately 17.20%.
2. Which companies are prominent players in the Consumer Biometrics Industry?
Key companies in the market include IDEX Biometrics ASA, Precise Biometrics AB, NEXT Biometrics Group ASA, Infineon Technologies, Princeton Identity, Omnivision Technologies, Egis Technologies Inc, STMicroelectronics NV, Qualcomm Incorporated, ON Semiconductor, Synaptics Inc, LG Innotek Co Ltd, Idemia France SAS, Knowles Electronics LLC, Apple Inc, Shenzhen Goodix Technology Co Ltd, Assa Abloy AB.
3. What are the main segments of the Consumer Biometrics Industry?
The market segments include Sensing Module, End Users.
4. Can you provide details about the market size?
The market size is estimated to be USD XX Million as of 2022.
5. What are some drivers contributing to market growth?
; Widening Applications of Biometrics; Technological Advancements in Biometrics.
6. What are the notable trends driving market growth?
Fingerprint Sensing Modules to Hold the Major Share.
7. Are there any restraints impacting market growth?
; Data Security and Privacy Concerns.
8. Can you provide examples of recent developments in the market?
N/A
9. What pricing options are available for accessing the report?
Pricing options include single-user, multi-user, and enterprise licenses priced at USD 4750, USD 5250, and USD 8750 respectively.
10. Is the market size provided in terms of value or volume?
The market size is provided in terms of value, measured in Million.
11. Are there any specific market keywords associated with the report?
Yes, the market keyword associated with the report is "Consumer Biometrics Industry," which aids in identifying and referencing the specific market segment covered.
12. How do I determine which pricing option suits my needs best?
The pricing options vary based on user requirements and access needs. Individual users may opt for single-user licenses, while businesses requiring broader access may choose multi-user or enterprise licenses for cost-effective access to the report.
13. Are there any additional resources or data provided in the Consumer Biometrics Industry report?
While the report offers comprehensive insights, it's advisable to review the specific contents or supplementary materials provided to ascertain if additional resources or data are available.
14. How can I stay updated on further developments or reports in the Consumer Biometrics Industry?
To stay informed about further developments, trends, and reports in the Consumer Biometrics Industry, consider subscribing to industry newsletters, following relevant companies and organizations, or regularly checking reputable industry news sources and publications.
Methodology
Step 1 - Identification of Relevant Samples Size from Population Database


Step 2 - Approaches for Defining Global Market Size (Value, Volume* & Price*)

Note*: In applicable scenarios
Step 3 - Data Sources
Primary Research
- Web Analytics
- Survey Reports
- Research Institute
- Latest Research Reports
- Opinion Leaders
Secondary Research
- Annual Reports
- White Paper
- Latest Press Release
- Industry Association
- Paid Database
- Investor Presentations

Step 4 - Data Triangulation
Involves using different sources of information in order to increase the validity of a study
These sources are likely to be stakeholders in a program - participants, other researchers, program staff, other community members, and so on.
Then we put all data in single framework & apply various statistical tools to find out the dynamic on the market.
During the analysis stage, feedback from the stakeholder groups would be compared to determine areas of agreement as well as areas of divergence


