
Key Insights
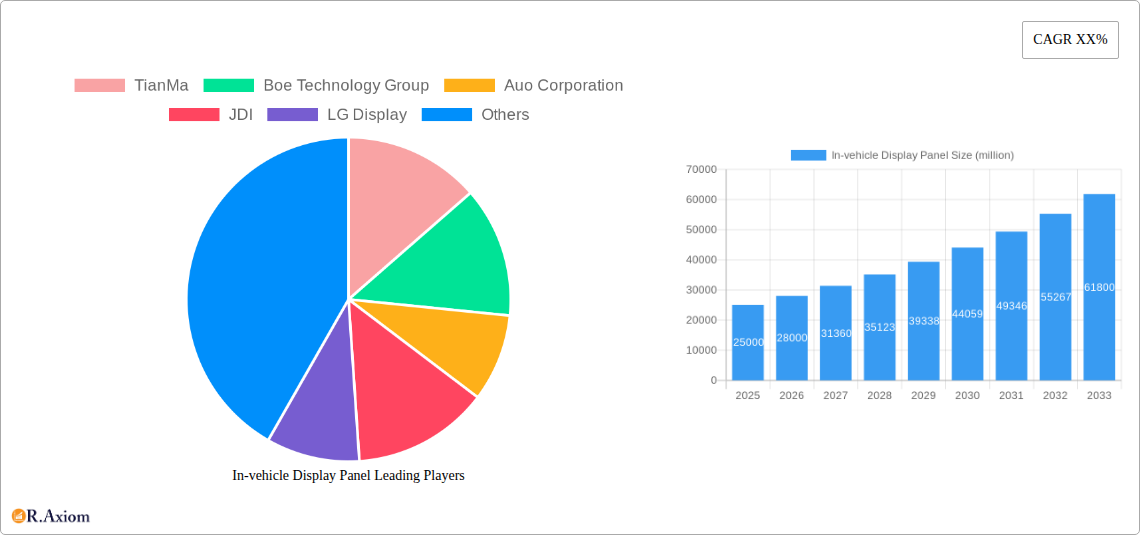
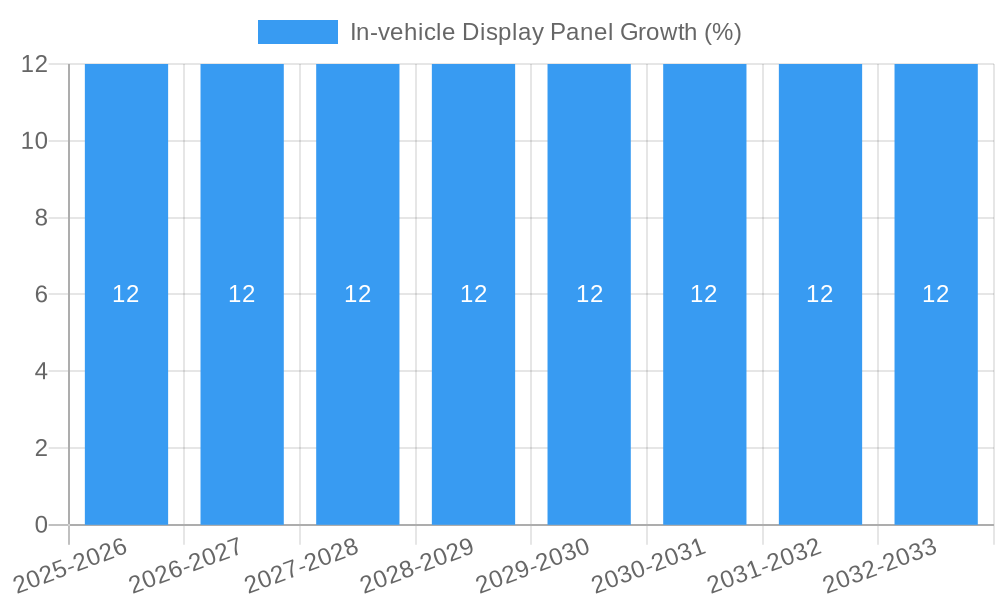
The global In-vehicle Display Panel market is projected to reach a significant valuation of approximately USD 25,000 million by 2025, with a robust Compound Annual Growth Rate (CAGR) of around 12% anticipated throughout the forecast period of 2025-2033. This substantial growth is propelled by several key drivers, most notably the escalating demand for enhanced in-car digital experiences and the increasing integration of advanced driver-assistance systems (ADAS). Consumers are increasingly seeking sophisticated infotainment systems, larger and more immersive displays, and personalized digital interfaces within their vehicles. Furthermore, regulatory mandates and evolving safety standards are pushing automakers to incorporate more advanced displays for critical information, navigation, and communication, thereby boosting market expansion. The shift towards electric vehicles (EVs) and autonomous driving technologies also plays a pivotal role, as these advancements necessitate more complex and integrated display solutions for monitoring vehicle performance, charging status, and providing a seamless user interface.
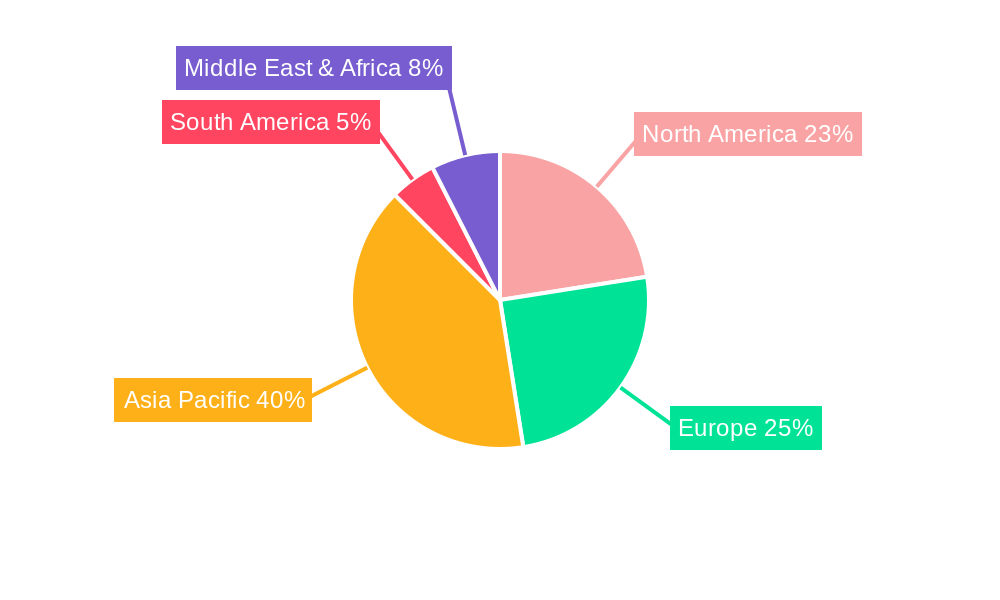
The market is characterized by dynamic trends, including the rising adoption of OLED and Mini-LED technologies for superior visual quality, improved contrast, and energy efficiency. The expansion of curved and flexible displays is also a significant trend, allowing for more ergonomic and aesthetically pleasing dashboard designs. Additionally, the integration of Artificial Intelligence (AI) and voice-controlled interfaces within these displays is becoming increasingly common, offering a more intuitive and connected user experience. However, the market faces certain restraints, such as the high cost associated with advanced display technologies and the complexities of supply chain management for these specialized components. The evolving regulatory landscape concerning data privacy and cybersecurity for connected car systems also presents a challenge. The market segmentation reveals strong growth across both Commercial Vehicle and Passenger Vehicle applications, with Center Control Display Panels and Instrument Display Panels holding substantial market share, while Heads-up Display Panels and Passenger-side Display Panels are emerging as high-growth segments due to their contribution to safety and passenger experience. Geographically, the Asia Pacific region, particularly China, is expected to dominate, followed by North America and Europe, driven by their large automotive manufacturing bases and strong consumer demand for advanced in-car technologies.
In-vehicle Display Panel Market Concentration & Innovation
The In-vehicle Display Panel market exhibits a moderate to high concentration, with key players like TianMa, Boe Technology Group, Auo Corporation, JDI, LG Display, Innolux, HKC, TCL, and Samsung dominating significant portions of the global market share. Innovation is a primary driver, fueled by the relentless pursuit of enhanced user experience, improved safety features, and the integration of advanced technologies such as OLED, Mini-LED, and flexible displays. Regulatory frameworks, particularly concerning driver distraction and automotive safety standards, are shaping product development and mandating specific display functionalities. The threat of product substitutes, while present in the form of traditional dashboard elements, is increasingly being mitigated by the superior functionality and integration capabilities of advanced in-vehicle displays. End-user trends are shifting towards larger, higher-resolution displays for infotainment and instrument clusters, as well as personalized passenger-side and rear entertainment screens, driving demand for innovative display solutions. Mergers and acquisitions (M&A) activities, though not as prevalent as in some other tech sectors, have played a role in consolidating market share and acquiring critical technological expertise. For instance, strategic partnerships and smaller acquisitions by major players aim to bolster their offerings in advanced display technologies and automotive integration. The M&A deal value is estimated to be in the range of several hundred million dollars annually, indicating a strategic, albeit measured, approach to market consolidation.
In-vehicle Display Panel Industry Trends & Insights
The In-vehicle Display Panel industry is poised for significant growth, driven by an escalating demand for advanced automotive technologies and a shift in consumer preferences towards digitally integrated vehicles. The market is experiencing a robust Compound Annual Growth Rate (CAGR) of approximately 7.5% from 2019 to 2033, with the base year of 2025 showing an estimated market size of over $35 million. This growth is propelled by several key factors. Firstly, the increasing sophistication of vehicle interiors, with a focus on creating immersive and intuitive user experiences, is a major catalyst. Consumers now expect seamless integration of navigation, entertainment, communication, and vehicle control through large, high-definition touchscreens. This demand is particularly strong in the passenger vehicle segment, where features like center console displays and instrument clusters are becoming standard, contributing to a market penetration rate exceeding 70% for advanced displays in new vehicle models.
Technological disruptions are further accelerating this trend. The adoption of advanced display technologies such as Organic Light Emitting Diode (OLED), Mini-LED, and Quantum Dot (QD) displays is enhancing visual quality, energy efficiency, and design flexibility. These technologies enable thinner, brighter, and more vibrant displays that can be seamlessly integrated into various vehicle designs, including curved and flexible panels. Furthermore, the advent of Heads-Up Displays (HUDs) is revolutionizing driver information delivery, projecting critical data directly into the driver's line of sight, thereby improving safety and reducing distraction. The market penetration of HUDs is projected to reach over 40% in premium passenger vehicles by 2030.
Consumer preferences are increasingly aligning with the capabilities offered by these advanced displays. Features such as customizable instrument clusters, personalized infotainment systems, and integrated augmented reality (AR) capabilities in HUDs are becoming highly sought after. The rise of electric vehicles (EVs) and autonomous driving technologies also plays a crucial role, necessitating sophisticated displays for monitoring vehicle status, battery management, and providing detailed situational awareness. The competitive landscape is characterized by intense innovation and strategic alliances between display manufacturers and automotive OEMs. Companies are investing heavily in research and development to offer differentiated products that meet the evolving demands of the automotive industry. The estimated market size for in-vehicle displays in 2025 is over $35 million, with projections indicating a substantial increase in the forecast period of 2025–2033.
Dominant Markets & Segments in In-vehicle Display Panel
The In-vehicle Display Panel market is experiencing robust growth driven by distinct regional dynamics and segment-specific demands. Within the Application segment, the Passenger Vehicle sector currently dominates and is projected to maintain its leading position throughout the forecast period. This dominance is underpinned by several factors. Firstly, the sheer volume of passenger vehicle production globally, exceeding 70 million units annually in recent years, provides a substantial base market. Secondly, the increasing integration of advanced display technologies as standard features in new passenger car models, driven by consumer expectations for modern infotainment, navigation, and digital instrument clusters, significantly fuels demand. Economic policies in major automotive markets, such as North America, Europe, and Asia-Pacific, that encourage technological adoption and luxury vehicle sales, further bolster this segment. Infrastructure development, including the expansion of charging networks for EVs, also indirectly supports the demand for advanced displays within passenger vehicles.
Among the Types of in-vehicle display panels, the Center Control Display Panel holds the largest market share. This is primarily due to its central role in managing most in-car functions, including infotainment, climate control, navigation, and connectivity. The trend towards larger, high-resolution touchscreens in center consoles, ranging from 10 inches to over 15 inches, is a key driver. The continued evolution of human-machine interface (HMI) designs emphasizes intuitive and feature-rich center console displays. The Instrument Display Panel is the second-largest segment, undergoing a significant transformation from traditional analog gauges to fully digital, customizable screens. The ability to display a wealth of information, including advanced driver-assistance systems (ADAS) alerts, navigation prompts, and vehicle diagnostics, makes these displays indispensable. Market penetration for digital instrument clusters is rapidly increasing, particularly in mid-range and premium passenger vehicles.
The Heads-up Display (HUD) Panel segment is experiencing the fastest growth. As safety regulations become stricter and the complexity of driving information increases, HUDs are gaining traction as a critical safety feature that minimizes driver distraction by projecting vital information onto the windshield. The technological advancements in projection technology and miniaturization are making HUDs more accessible and integrated. The Passenger-side Display Panel and Rear Entertainment Display Panel segments are also witnessing steady growth, driven by the increasing demand for personalized entertainment and productivity features in vehicles, especially in ride-sharing and premium segments. The growth of these segments is further amplified by the increasing average selling price (ASP) of vehicles, as these advanced display technologies are often bundled as optional upgrades or standard in higher trim levels.
In-vehicle Display Panel Product Developments
Product development in the in-vehicle display panel market is characterized by a relentless focus on enhancing visual fidelity, user interaction, and integration capabilities. Innovations are centered around emerging technologies like OLED and Mini-LED, offering superior contrast ratios, vibrant colors, and energy efficiency. Flexible and curved display designs are gaining traction, enabling OEMs to create more immersive and aesthetically pleasing cabin layouts. The integration of touchless gesture control and advanced haptic feedback further refines the user experience. Competitive advantages are being carved out through higher resolutions (4K and beyond), faster refresh rates, and improved sunlight readability. The market fit is evident in the growing adoption of these advanced displays across all vehicle segments, from basic infotainment to sophisticated digital cockpits.
Report Scope & Segmentation Analysis
This report encompasses a comprehensive analysis of the In-vehicle Display Panel market, segmented by Application and Type. The Application segmentation includes Commercial Vehicle and Passenger Vehicle. The Type segmentation covers Center Control Display Panel, Instrument Display Panel, Heads-up Display Panel, Passenger-side Display Panel, Rear Entertainment Display Panel, and Others. For the Commercial Vehicle segment, we project a steady growth driven by the increasing adoption of telematics and fleet management solutions, with an estimated market size of over $5 million in 2025. The Passenger Vehicle segment is expected to dominate, with a projected market size exceeding $30 million in 2025, fueled by consumer demand for advanced digital cockpits and infotainment systems.
The Center Control Display Panel is anticipated to maintain its leadership position, with a market size of over $15 million in 2025, driven by larger screen sizes and advanced functionalities. The Instrument Display Panel segment is projected to experience robust growth, reaching over $10 million in 2025, as digital clusters become standard. Heads-up Display Panel is the fastest-growing segment, with a projected market size of over $5 million in 2025, due to its safety and augmented reality capabilities. The Passenger-side Display Panel and Rear Entertainment Display Panel are expected to grow steadily, contributing over $3 million collectively to the market by 2025, catering to evolving passenger entertainment needs. The Others category, including specialized displays, will represent a smaller but significant portion of the market.
Key Drivers of In-vehicle Display Panel Growth
The growth of the In-vehicle Display Panel market is primarily driven by the escalating demand for enhanced in-car digital experiences and advanced safety features. Technological advancements, such as the widespread adoption of OLED, Mini-LED, and flexible display technologies, are enabling higher resolutions, improved brightness, and more sophisticated designs. The increasing integration of sophisticated infotainment systems, navigation, and connectivity features in vehicles by automotive OEMs directly fuels demand. Furthermore, the growing emphasis on automotive safety, particularly the implementation of Advanced Driver-Assistance Systems (ADAS) and the development of autonomous driving technologies, necessitates advanced display solutions for clear and timely information delivery. Government regulations promoting driver safety and technological adoption also play a significant role.
Challenges in the In-vehicle Display Panel Sector
Despite the strong growth trajectory, the In-vehicle Display Panel sector faces several challenges. High research and development costs associated with cutting-edge display technologies like OLED and Micro-LED can be a significant barrier to entry for smaller players. Supply chain disruptions, as seen in recent years, can impact the availability of critical components and lead to price volatility, affecting production timelines and costs. Stringent automotive safety regulations, while driving innovation, also impose complex testing and validation requirements, increasing development cycles. Intense competition among established players and emerging manufacturers can lead to price pressures and squeezed profit margins. Additionally, the rapid pace of technological evolution requires continuous investment to stay competitive, posing a challenge for maintaining profitability.
Emerging Opportunities in In-vehicle Display Panel
Emerging opportunities in the In-vehicle Display Panel market are abundant, driven by the transformative potential of future automotive trends. The burgeoning electric vehicle (EV) market presents a significant opportunity, as EVs often feature advanced digital cockpits and battery management displays. The ongoing development of autonomous driving technology will require sophisticated, multi-functional displays for conveying complex driving information and enhancing situational awareness. The integration of augmented reality (AR) into Heads-Up Displays (HUDs) and center consoles offers a pathway to more intuitive and immersive navigation and information delivery. Furthermore, the growing demand for personalized in-car experiences creates opportunities for customizable displays and interactive passenger-side screens. The expansion into emerging markets with increasing automotive penetration also represents a substantial growth avenue.
Leading Players in the In-vehicle Display Panel Market
- TianMa
- Boe Technology Group
- Auo Corporation
- JDI
- LG Display
- Innolux
- HKC
- TCL
- Samsung
Key Developments in In-vehicle Display Panel Industry
- 2023 March: LG Display announces the mass production of its advanced OLED displays for automotive applications, highlighting improved durability and energy efficiency.
- 2023 February: Samsung Display unveils a new generation of flexible AMOLED displays for automotive integration, enabling curved and borderless designs.
- 2022 December: TianMa showcases its latest generation of high-resolution automotive LCD panels, focusing on enhanced sunlight readability and power efficiency.
- 2022 November: Boe Technology Group announces significant investments in expanding its production capacity for automotive-grade displays, anticipating continued strong market demand.
- 2022 October: Auo Corporation introduces its innovative Mini-LED display technology for automotive instrument clusters, offering superior brightness and contrast.
- 2022 September: JDI demonstrates advanced automotive display solutions with integrated touch and sensing functionalities, aiming to simplify HMI.
- 2022 August: Innolux announces new partnerships with automotive OEMs to develop customized display solutions for next-generation vehicle interiors.
- 2022 July: HKC showcases its cost-effective yet high-performance LCD solutions for entry-level to mid-range automotive segments.
- 2022 June: TCL CSOT reveals advancements in its QD-OLED display technology for automotive, promising enhanced color gamut and picture quality.
Strategic Outlook for In-vehicle Display Panel Market
The strategic outlook for the In-vehicle Display Panel market remains exceptionally bright, driven by the automotive industry's ongoing digital transformation. The increasing sophistication of vehicle interiors, the relentless pursuit of enhanced safety features, and the growing consumer appetite for integrated digital experiences are powerful growth catalysts. Companies that can successfully navigate the complexities of advanced display technologies, such as OLED, Mini-LED, and flexible displays, while also demonstrating agility in responding to evolving automotive safety standards and connectivity demands, will be best positioned for success. Strategic partnerships with automotive OEMs and a focus on R&D to deliver innovative, cost-effective, and user-centric display solutions will be paramount in capturing future market share and capitalizing on the immense opportunities within this dynamic sector.
In-vehicle Display Panel Segmentation
-
1. Application
- 1.1. Commercial Vehicle
- 1.2. Passenger Vehicle
-
2. Types
- 2.1. Center Control Display Panel
- 2.2. Instrument Display Panel
- 2.3. Heads-up Display Panel
- 2.4. Passenger-side Display Panel
- 2.5. Rear Entertainment Display Panel
- 2.6. Others
In-vehicle Display Panel Segmentation By Geography
-
1. North America
- 1.1. United States
- 1.2. Canada
- 1.3. Mexico
-
2. South America
- 2.1. Brazil
- 2.2. Argentina
- 2.3. Rest of South America
-
3. Europe
- 3.1. United Kingdom
- 3.2. Germany
- 3.3. France
- 3.4. Italy
- 3.5. Spain
- 3.6. Russia
- 3.7. Benelux
- 3.8. Nordics
- 3.9. Rest of Europe
-
4. Middle East & Africa
- 4.1. Turkey
- 4.2. Israel
- 4.3. GCC
- 4.4. North Africa
- 4.5. South Africa
- 4.6. Rest of Middle East & Africa
-
5. Asia Pacific
- 5.1. China
- 5.2. India
- 5.3. Japan
- 5.4. South Korea
- 5.5. ASEAN
- 5.6. Oceania
- 5.7. Rest of Asia Pacific
In-vehicle Display Panel REPORT HIGHLIGHTS
| Aspects | Details |
|---|---|
| Study Period | 2019-2033 |
| Base Year | 2024 |
| Estimated Year | 2025 |
| Forecast Period | 2025-2033 |
| Historical Period | 2019-2024 |
| Growth Rate | CAGR of XX% from 2019-2033 |
| Segmentation |
|
Table of Contents
- 1. Introduction
- 1.1. Research Scope
- 1.2. Market Segmentation
- 1.3. Research Methodology
- 1.4. Definitions and Assumptions
- 2. Executive Summary
- 2.1. Introduction
- 3. Market Dynamics
- 3.1. Introduction
- 3.2. Market Drivers
- 3.3. Market Restrains
- 3.4. Market Trends
- 4. Market Factor Analysis
- 4.1. Porters Five Forces
- 4.2. Supply/Value Chain
- 4.3. PESTEL analysis
- 4.4. Market Entropy
- 4.5. Patent/Trademark Analysis
- 5. Global In-vehicle Display Panel Analysis, Insights and Forecast, 2019-2031
- 5.1. Market Analysis, Insights and Forecast - by Application
- 5.1.1. Commercial Vehicle
- 5.1.2. Passenger Vehicle
- 5.2. Market Analysis, Insights and Forecast - by Types
- 5.2.1. Center Control Display Panel
- 5.2.2. Instrument Display Panel
- 5.2.3. Heads-up Display Panel
- 5.2.4. Passenger-side Display Panel
- 5.2.5. Rear Entertainment Display Panel
- 5.2.6. Others
- 5.3. Market Analysis, Insights and Forecast - by Region
- 5.3.1. North America
- 5.3.2. South America
- 5.3.3. Europe
- 5.3.4. Middle East & Africa
- 5.3.5. Asia Pacific
- 5.1. Market Analysis, Insights and Forecast - by Application
- 6. North America In-vehicle Display Panel Analysis, Insights and Forecast, 2019-2031
- 6.1. Market Analysis, Insights and Forecast - by Application
- 6.1.1. Commercial Vehicle
- 6.1.2. Passenger Vehicle
- 6.2. Market Analysis, Insights and Forecast - by Types
- 6.2.1. Center Control Display Panel
- 6.2.2. Instrument Display Panel
- 6.2.3. Heads-up Display Panel
- 6.2.4. Passenger-side Display Panel
- 6.2.5. Rear Entertainment Display Panel
- 6.2.6. Others
- 6.1. Market Analysis, Insights and Forecast - by Application
- 7. South America In-vehicle Display Panel Analysis, Insights and Forecast, 2019-2031
- 7.1. Market Analysis, Insights and Forecast - by Application
- 7.1.1. Commercial Vehicle
- 7.1.2. Passenger Vehicle
- 7.2. Market Analysis, Insights and Forecast - by Types
- 7.2.1. Center Control Display Panel
- 7.2.2. Instrument Display Panel
- 7.2.3. Heads-up Display Panel
- 7.2.4. Passenger-side Display Panel
- 7.2.5. Rear Entertainment Display Panel
- 7.2.6. Others
- 7.1. Market Analysis, Insights and Forecast - by Application
- 8. Europe In-vehicle Display Panel Analysis, Insights and Forecast, 2019-2031
- 8.1. Market Analysis, Insights and Forecast - by Application
- 8.1.1. Commercial Vehicle
- 8.1.2. Passenger Vehicle
- 8.2. Market Analysis, Insights and Forecast - by Types
- 8.2.1. Center Control Display Panel
- 8.2.2. Instrument Display Panel
- 8.2.3. Heads-up Display Panel
- 8.2.4. Passenger-side Display Panel
- 8.2.5. Rear Entertainment Display Panel
- 8.2.6. Others
- 8.1. Market Analysis, Insights and Forecast - by Application
- 9. Middle East & Africa In-vehicle Display Panel Analysis, Insights and Forecast, 2019-2031
- 9.1. Market Analysis, Insights and Forecast - by Application
- 9.1.1. Commercial Vehicle
- 9.1.2. Passenger Vehicle
- 9.2. Market Analysis, Insights and Forecast - by Types
- 9.2.1. Center Control Display Panel
- 9.2.2. Instrument Display Panel
- 9.2.3. Heads-up Display Panel
- 9.2.4. Passenger-side Display Panel
- 9.2.5. Rear Entertainment Display Panel
- 9.2.6. Others
- 9.1. Market Analysis, Insights and Forecast - by Application
- 10. Asia Pacific In-vehicle Display Panel Analysis, Insights and Forecast, 2019-2031
- 10.1. Market Analysis, Insights and Forecast - by Application
- 10.1.1. Commercial Vehicle
- 10.1.2. Passenger Vehicle
- 10.2. Market Analysis, Insights and Forecast - by Types
- 10.2.1. Center Control Display Panel
- 10.2.2. Instrument Display Panel
- 10.2.3. Heads-up Display Panel
- 10.2.4. Passenger-side Display Panel
- 10.2.5. Rear Entertainment Display Panel
- 10.2.6. Others
- 10.1. Market Analysis, Insights and Forecast - by Application
- 11. Competitive Analysis
- 11.1. Global Market Share Analysis 2024
- 11.2. Company Profiles
- 11.2.1 TianMa
- 11.2.1.1. Overview
- 11.2.1.2. Products
- 11.2.1.3. SWOT Analysis
- 11.2.1.4. Recent Developments
- 11.2.1.5. Financials (Based on Availability)
- 11.2.2 Boe Technology Group
- 11.2.2.1. Overview
- 11.2.2.2. Products
- 11.2.2.3. SWOT Analysis
- 11.2.2.4. Recent Developments
- 11.2.2.5. Financials (Based on Availability)
- 11.2.3 Auo Corporation
- 11.2.3.1. Overview
- 11.2.3.2. Products
- 11.2.3.3. SWOT Analysis
- 11.2.3.4. Recent Developments
- 11.2.3.5. Financials (Based on Availability)
- 11.2.4 JDI
- 11.2.4.1. Overview
- 11.2.4.2. Products
- 11.2.4.3. SWOT Analysis
- 11.2.4.4. Recent Developments
- 11.2.4.5. Financials (Based on Availability)
- 11.2.5 LG Display
- 11.2.5.1. Overview
- 11.2.5.2. Products
- 11.2.5.3. SWOT Analysis
- 11.2.5.4. Recent Developments
- 11.2.5.5. Financials (Based on Availability)
- 11.2.6 Innolux
- 11.2.6.1. Overview
- 11.2.6.2. Products
- 11.2.6.3. SWOT Analysis
- 11.2.6.4. Recent Developments
- 11.2.6.5. Financials (Based on Availability)
- 11.2.7 HKC
- 11.2.7.1. Overview
- 11.2.7.2. Products
- 11.2.7.3. SWOT Analysis
- 11.2.7.4. Recent Developments
- 11.2.7.5. Financials (Based on Availability)
- 11.2.8 TCL
- 11.2.8.1. Overview
- 11.2.8.2. Products
- 11.2.8.3. SWOT Analysis
- 11.2.8.4. Recent Developments
- 11.2.8.5. Financials (Based on Availability)
- 11.2.9 Samsung
- 11.2.9.1. Overview
- 11.2.9.2. Products
- 11.2.9.3. SWOT Analysis
- 11.2.9.4. Recent Developments
- 11.2.9.5. Financials (Based on Availability)
- 11.2.1 TianMa
List of Figures
- Figure 1: Global In-vehicle Display Panel Revenue Breakdown (million, %) by Region 2024 & 2032
- Figure 2: Global In-vehicle Display Panel Volume Breakdown (K, %) by Region 2024 & 2032
- Figure 3: North America In-vehicle Display Panel Revenue (million), by Application 2024 & 2032
- Figure 4: North America In-vehicle Display Panel Volume (K), by Application 2024 & 2032
- Figure 5: North America In-vehicle Display Panel Revenue Share (%), by Application 2024 & 2032
- Figure 6: North America In-vehicle Display Panel Volume Share (%), by Application 2024 & 2032
- Figure 7: North America In-vehicle Display Panel Revenue (million), by Types 2024 & 2032
- Figure 8: North America In-vehicle Display Panel Volume (K), by Types 2024 & 2032
- Figure 9: North America In-vehicle Display Panel Revenue Share (%), by Types 2024 & 2032
- Figure 10: North America In-vehicle Display Panel Volume Share (%), by Types 2024 & 2032
- Figure 11: North America In-vehicle Display Panel Revenue (million), by Country 2024 & 2032
- Figure 12: North America In-vehicle Display Panel Volume (K), by Country 2024 & 2032
- Figure 13: North America In-vehicle Display Panel Revenue Share (%), by Country 2024 & 2032
- Figure 14: North America In-vehicle Display Panel Volume Share (%), by Country 2024 & 2032
- Figure 15: South America In-vehicle Display Panel Revenue (million), by Application 2024 & 2032
- Figure 16: South America In-vehicle Display Panel Volume (K), by Application 2024 & 2032
- Figure 17: South America In-vehicle Display Panel Revenue Share (%), by Application 2024 & 2032
- Figure 18: South America In-vehicle Display Panel Volume Share (%), by Application 2024 & 2032
- Figure 19: South America In-vehicle Display Panel Revenue (million), by Types 2024 & 2032
- Figure 20: South America In-vehicle Display Panel Volume (K), by Types 2024 & 2032
- Figure 21: South America In-vehicle Display Panel Revenue Share (%), by Types 2024 & 2032
- Figure 22: South America In-vehicle Display Panel Volume Share (%), by Types 2024 & 2032
- Figure 23: South America In-vehicle Display Panel Revenue (million), by Country 2024 & 2032
- Figure 24: South America In-vehicle Display Panel Volume (K), by Country 2024 & 2032
- Figure 25: South America In-vehicle Display Panel Revenue Share (%), by Country 2024 & 2032
- Figure 26: South America In-vehicle Display Panel Volume Share (%), by Country 2024 & 2032
- Figure 27: Europe In-vehicle Display Panel Revenue (million), by Application 2024 & 2032
- Figure 28: Europe In-vehicle Display Panel Volume (K), by Application 2024 & 2032
- Figure 29: Europe In-vehicle Display Panel Revenue Share (%), by Application 2024 & 2032
- Figure 30: Europe In-vehicle Display Panel Volume Share (%), by Application 2024 & 2032
- Figure 31: Europe In-vehicle Display Panel Revenue (million), by Types 2024 & 2032
- Figure 32: Europe In-vehicle Display Panel Volume (K), by Types 2024 & 2032
- Figure 33: Europe In-vehicle Display Panel Revenue Share (%), by Types 2024 & 2032
- Figure 34: Europe In-vehicle Display Panel Volume Share (%), by Types 2024 & 2032
- Figure 35: Europe In-vehicle Display Panel Revenue (million), by Country 2024 & 2032
- Figure 36: Europe In-vehicle Display Panel Volume (K), by Country 2024 & 2032
- Figure 37: Europe In-vehicle Display Panel Revenue Share (%), by Country 2024 & 2032
- Figure 38: Europe In-vehicle Display Panel Volume Share (%), by Country 2024 & 2032
- Figure 39: Middle East & Africa In-vehicle Display Panel Revenue (million), by Application 2024 & 2032
- Figure 40: Middle East & Africa In-vehicle Display Panel Volume (K), by Application 2024 & 2032
- Figure 41: Middle East & Africa In-vehicle Display Panel Revenue Share (%), by Application 2024 & 2032
- Figure 42: Middle East & Africa In-vehicle Display Panel Volume Share (%), by Application 2024 & 2032
- Figure 43: Middle East & Africa In-vehicle Display Panel Revenue (million), by Types 2024 & 2032
- Figure 44: Middle East & Africa In-vehicle Display Panel Volume (K), by Types 2024 & 2032
- Figure 45: Middle East & Africa In-vehicle Display Panel Revenue Share (%), by Types 2024 & 2032
- Figure 46: Middle East & Africa In-vehicle Display Panel Volume Share (%), by Types 2024 & 2032
- Figure 47: Middle East & Africa In-vehicle Display Panel Revenue (million), by Country 2024 & 2032
- Figure 48: Middle East & Africa In-vehicle Display Panel Volume (K), by Country 2024 & 2032
- Figure 49: Middle East & Africa In-vehicle Display Panel Revenue Share (%), by Country 2024 & 2032
- Figure 50: Middle East & Africa In-vehicle Display Panel Volume Share (%), by Country 2024 & 2032
- Figure 51: Asia Pacific In-vehicle Display Panel Revenue (million), by Application 2024 & 2032
- Figure 52: Asia Pacific In-vehicle Display Panel Volume (K), by Application 2024 & 2032
- Figure 53: Asia Pacific In-vehicle Display Panel Revenue Share (%), by Application 2024 & 2032
- Figure 54: Asia Pacific In-vehicle Display Panel Volume Share (%), by Application 2024 & 2032
- Figure 55: Asia Pacific In-vehicle Display Panel Revenue (million), by Types 2024 & 2032
- Figure 56: Asia Pacific In-vehicle Display Panel Volume (K), by Types 2024 & 2032
- Figure 57: Asia Pacific In-vehicle Display Panel Revenue Share (%), by Types 2024 & 2032
- Figure 58: Asia Pacific In-vehicle Display Panel Volume Share (%), by Types 2024 & 2032
- Figure 59: Asia Pacific In-vehicle Display Panel Revenue (million), by Country 2024 & 2032
- Figure 60: Asia Pacific In-vehicle Display Panel Volume (K), by Country 2024 & 2032
- Figure 61: Asia Pacific In-vehicle Display Panel Revenue Share (%), by Country 2024 & 2032
- Figure 62: Asia Pacific In-vehicle Display Panel Volume Share (%), by Country 2024 & 2032
List of Tables
- Table 1: Global In-vehicle Display Panel Revenue million Forecast, by Region 2019 & 2032
- Table 2: Global In-vehicle Display Panel Volume K Forecast, by Region 2019 & 2032
- Table 3: Global In-vehicle Display Panel Revenue million Forecast, by Application 2019 & 2032
- Table 4: Global In-vehicle Display Panel Volume K Forecast, by Application 2019 & 2032
- Table 5: Global In-vehicle Display Panel Revenue million Forecast, by Types 2019 & 2032
- Table 6: Global In-vehicle Display Panel Volume K Forecast, by Types 2019 & 2032
- Table 7: Global In-vehicle Display Panel Revenue million Forecast, by Region 2019 & 2032
- Table 8: Global In-vehicle Display Panel Volume K Forecast, by Region 2019 & 2032
- Table 9: Global In-vehicle Display Panel Revenue million Forecast, by Application 2019 & 2032
- Table 10: Global In-vehicle Display Panel Volume K Forecast, by Application 2019 & 2032
- Table 11: Global In-vehicle Display Panel Revenue million Forecast, by Types 2019 & 2032
- Table 12: Global In-vehicle Display Panel Volume K Forecast, by Types 2019 & 2032
- Table 13: Global In-vehicle Display Panel Revenue million Forecast, by Country 2019 & 2032
- Table 14: Global In-vehicle Display Panel Volume K Forecast, by Country 2019 & 2032
- Table 15: United States In-vehicle Display Panel Revenue (million) Forecast, by Application 2019 & 2032
- Table 16: United States In-vehicle Display Panel Volume (K) Forecast, by Application 2019 & 2032
- Table 17: Canada In-vehicle Display Panel Revenue (million) Forecast, by Application 2019 & 2032
- Table 18: Canada In-vehicle Display Panel Volume (K) Forecast, by Application 2019 & 2032
- Table 19: Mexico In-vehicle Display Panel Revenue (million) Forecast, by Application 2019 & 2032
- Table 20: Mexico In-vehicle Display Panel Volume (K) Forecast, by Application 2019 & 2032
- Table 21: Global In-vehicle Display Panel Revenue million Forecast, by Application 2019 & 2032
- Table 22: Global In-vehicle Display Panel Volume K Forecast, by Application 2019 & 2032
- Table 23: Global In-vehicle Display Panel Revenue million Forecast, by Types 2019 & 2032
- Table 24: Global In-vehicle Display Panel Volume K Forecast, by Types 2019 & 2032
- Table 25: Global In-vehicle Display Panel Revenue million Forecast, by Country 2019 & 2032
- Table 26: Global In-vehicle Display Panel Volume K Forecast, by Country 2019 & 2032
- Table 27: Brazil In-vehicle Display Panel Revenue (million) Forecast, by Application 2019 & 2032
- Table 28: Brazil In-vehicle Display Panel Volume (K) Forecast, by Application 2019 & 2032
- Table 29: Argentina In-vehicle Display Panel Revenue (million) Forecast, by Application 2019 & 2032
- Table 30: Argentina In-vehicle Display Panel Volume (K) Forecast, by Application 2019 & 2032
- Table 31: Rest of South America In-vehicle Display Panel Revenue (million) Forecast, by Application 2019 & 2032
- Table 32: Rest of South America In-vehicle Display Panel Volume (K) Forecast, by Application 2019 & 2032
- Table 33: Global In-vehicle Display Panel Revenue million Forecast, by Application 2019 & 2032
- Table 34: Global In-vehicle Display Panel Volume K Forecast, by Application 2019 & 2032
- Table 35: Global In-vehicle Display Panel Revenue million Forecast, by Types 2019 & 2032
- Table 36: Global In-vehicle Display Panel Volume K Forecast, by Types 2019 & 2032
- Table 37: Global In-vehicle Display Panel Revenue million Forecast, by Country 2019 & 2032
- Table 38: Global In-vehicle Display Panel Volume K Forecast, by Country 2019 & 2032
- Table 39: United Kingdom In-vehicle Display Panel Revenue (million) Forecast, by Application 2019 & 2032
- Table 40: United Kingdom In-vehicle Display Panel Volume (K) Forecast, by Application 2019 & 2032
- Table 41: Germany In-vehicle Display Panel Revenue (million) Forecast, by Application 2019 & 2032
- Table 42: Germany In-vehicle Display Panel Volume (K) Forecast, by Application 2019 & 2032
- Table 43: France In-vehicle Display Panel Revenue (million) Forecast, by Application 2019 & 2032
- Table 44: France In-vehicle Display Panel Volume (K) Forecast, by Application 2019 & 2032
- Table 45: Italy In-vehicle Display Panel Revenue (million) Forecast, by Application 2019 & 2032
- Table 46: Italy In-vehicle Display Panel Volume (K) Forecast, by Application 2019 & 2032
- Table 47: Spain In-vehicle Display Panel Revenue (million) Forecast, by Application 2019 & 2032
- Table 48: Spain In-vehicle Display Panel Volume (K) Forecast, by Application 2019 & 2032
- Table 49: Russia In-vehicle Display Panel Revenue (million) Forecast, by Application 2019 & 2032
- Table 50: Russia In-vehicle Display Panel Volume (K) Forecast, by Application 2019 & 2032
- Table 51: Benelux In-vehicle Display Panel Revenue (million) Forecast, by Application 2019 & 2032
- Table 52: Benelux In-vehicle Display Panel Volume (K) Forecast, by Application 2019 & 2032
- Table 53: Nordics In-vehicle Display Panel Revenue (million) Forecast, by Application 2019 & 2032
- Table 54: Nordics In-vehicle Display Panel Volume (K) Forecast, by Application 2019 & 2032
- Table 55: Rest of Europe In-vehicle Display Panel Revenue (million) Forecast, by Application 2019 & 2032
- Table 56: Rest of Europe In-vehicle Display Panel Volume (K) Forecast, by Application 2019 & 2032
- Table 57: Global In-vehicle Display Panel Revenue million Forecast, by Application 2019 & 2032
- Table 58: Global In-vehicle Display Panel Volume K Forecast, by Application 2019 & 2032
- Table 59: Global In-vehicle Display Panel Revenue million Forecast, by Types 2019 & 2032
- Table 60: Global In-vehicle Display Panel Volume K Forecast, by Types 2019 & 2032
- Table 61: Global In-vehicle Display Panel Revenue million Forecast, by Country 2019 & 2032
- Table 62: Global In-vehicle Display Panel Volume K Forecast, by Country 2019 & 2032
- Table 63: Turkey In-vehicle Display Panel Revenue (million) Forecast, by Application 2019 & 2032
- Table 64: Turkey In-vehicle Display Panel Volume (K) Forecast, by Application 2019 & 2032
- Table 65: Israel In-vehicle Display Panel Revenue (million) Forecast, by Application 2019 & 2032
- Table 66: Israel In-vehicle Display Panel Volume (K) Forecast, by Application 2019 & 2032
- Table 67: GCC In-vehicle Display Panel Revenue (million) Forecast, by Application 2019 & 2032
- Table 68: GCC In-vehicle Display Panel Volume (K) Forecast, by Application 2019 & 2032
- Table 69: North Africa In-vehicle Display Panel Revenue (million) Forecast, by Application 2019 & 2032
- Table 70: North Africa In-vehicle Display Panel Volume (K) Forecast, by Application 2019 & 2032
- Table 71: South Africa In-vehicle Display Panel Revenue (million) Forecast, by Application 2019 & 2032
- Table 72: South Africa In-vehicle Display Panel Volume (K) Forecast, by Application 2019 & 2032
- Table 73: Rest of Middle East & Africa In-vehicle Display Panel Revenue (million) Forecast, by Application 2019 & 2032
- Table 74: Rest of Middle East & Africa In-vehicle Display Panel Volume (K) Forecast, by Application 2019 & 2032
- Table 75: Global In-vehicle Display Panel Revenue million Forecast, by Application 2019 & 2032
- Table 76: Global In-vehicle Display Panel Volume K Forecast, by Application 2019 & 2032
- Table 77: Global In-vehicle Display Panel Revenue million Forecast, by Types 2019 & 2032
- Table 78: Global In-vehicle Display Panel Volume K Forecast, by Types 2019 & 2032
- Table 79: Global In-vehicle Display Panel Revenue million Forecast, by Country 2019 & 2032
- Table 80: Global In-vehicle Display Panel Volume K Forecast, by Country 2019 & 2032
- Table 81: China In-vehicle Display Panel Revenue (million) Forecast, by Application 2019 & 2032
- Table 82: China In-vehicle Display Panel Volume (K) Forecast, by Application 2019 & 2032
- Table 83: India In-vehicle Display Panel Revenue (million) Forecast, by Application 2019 & 2032
- Table 84: India In-vehicle Display Panel Volume (K) Forecast, by Application 2019 & 2032
- Table 85: Japan In-vehicle Display Panel Revenue (million) Forecast, by Application 2019 & 2032
- Table 86: Japan In-vehicle Display Panel Volume (K) Forecast, by Application 2019 & 2032
- Table 87: South Korea In-vehicle Display Panel Revenue (million) Forecast, by Application 2019 & 2032
- Table 88: South Korea In-vehicle Display Panel Volume (K) Forecast, by Application 2019 & 2032
- Table 89: ASEAN In-vehicle Display Panel Revenue (million) Forecast, by Application 2019 & 2032
- Table 90: ASEAN In-vehicle Display Panel Volume (K) Forecast, by Application 2019 & 2032
- Table 91: Oceania In-vehicle Display Panel Revenue (million) Forecast, by Application 2019 & 2032
- Table 92: Oceania In-vehicle Display Panel Volume (K) Forecast, by Application 2019 & 2032
- Table 93: Rest of Asia Pacific In-vehicle Display Panel Revenue (million) Forecast, by Application 2019 & 2032
- Table 94: Rest of Asia Pacific In-vehicle Display Panel Volume (K) Forecast, by Application 2019 & 2032
Frequently Asked Questions
1. What is the projected Compound Annual Growth Rate (CAGR) of the In-vehicle Display Panel?
The projected CAGR is approximately XX%.
2. Which companies are prominent players in the In-vehicle Display Panel?
Key companies in the market include TianMa, Boe Technology Group, Auo Corporation, JDI, LG Display, Innolux, HKC, TCL, Samsung.
3. What are the main segments of the In-vehicle Display Panel?
The market segments include Application, Types.
4. Can you provide details about the market size?
The market size is estimated to be USD XXX million as of 2022.
5. What are some drivers contributing to market growth?
N/A
6. What are the notable trends driving market growth?
N/A
7. Are there any restraints impacting market growth?
N/A
8. Can you provide examples of recent developments in the market?
N/A
9. What pricing options are available for accessing the report?
Pricing options include single-user, multi-user, and enterprise licenses priced at USD 3950.00, USD 5925.00, and USD 7900.00 respectively.
10. Is the market size provided in terms of value or volume?
The market size is provided in terms of value, measured in million and volume, measured in K.
11. Are there any specific market keywords associated with the report?
Yes, the market keyword associated with the report is "In-vehicle Display Panel," which aids in identifying and referencing the specific market segment covered.
12. How do I determine which pricing option suits my needs best?
The pricing options vary based on user requirements and access needs. Individual users may opt for single-user licenses, while businesses requiring broader access may choose multi-user or enterprise licenses for cost-effective access to the report.
13. Are there any additional resources or data provided in the In-vehicle Display Panel report?
While the report offers comprehensive insights, it's advisable to review the specific contents or supplementary materials provided to ascertain if additional resources or data are available.
14. How can I stay updated on further developments or reports in the In-vehicle Display Panel?
To stay informed about further developments, trends, and reports in the In-vehicle Display Panel, consider subscribing to industry newsletters, following relevant companies and organizations, or regularly checking reputable industry news sources and publications.
Methodology
Step 1 - Identification of Relevant Samples Size from Population Database


Step 2 - Approaches for Defining Global Market Size (Value, Volume* & Price*)

Note*: In applicable scenarios
Step 3 - Data Sources
Primary Research
- Web Analytics
- Survey Reports
- Research Institute
- Latest Research Reports
- Opinion Leaders
Secondary Research
- Annual Reports
- White Paper
- Latest Press Release
- Industry Association
- Paid Database
- Investor Presentations

Step 4 - Data Triangulation
Involves using different sources of information in order to increase the validity of a study
These sources are likely to be stakeholders in a program - participants, other researchers, program staff, other community members, and so on.
Then we put all data in single framework & apply various statistical tools to find out the dynamic on the market.
During the analysis stage, feedback from the stakeholder groups would be compared to determine areas of agreement as well as areas of divergence


