
Key Insights
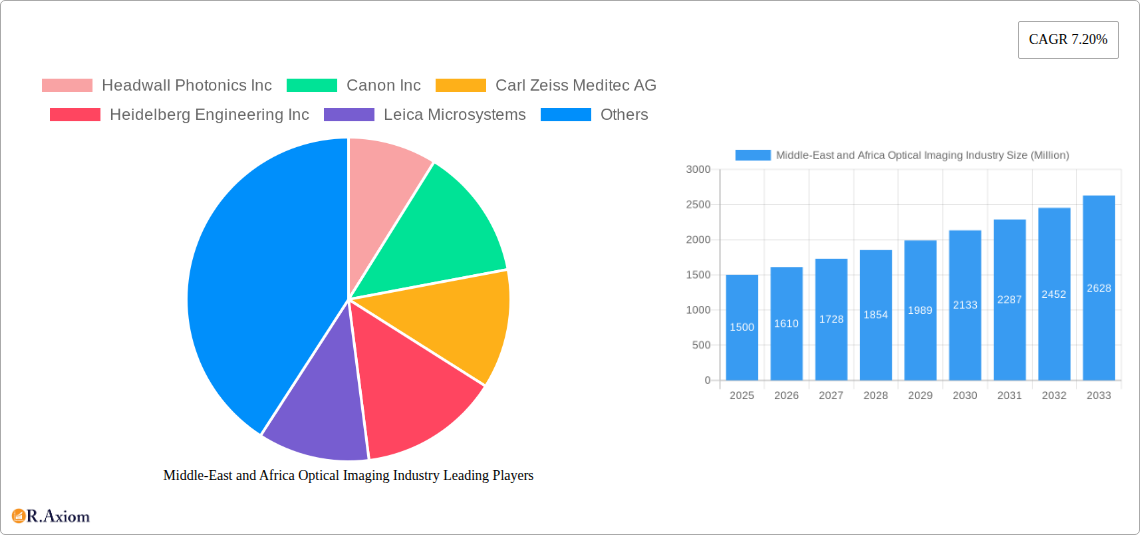
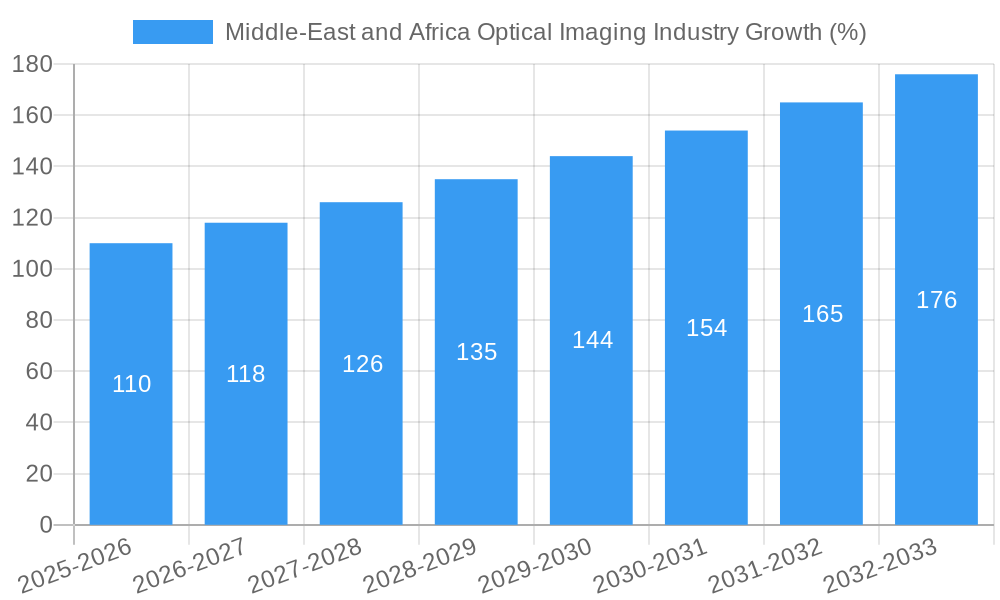
The Middle East and Africa (MEA) optical imaging market is experiencing robust growth, driven by increasing prevalence of chronic diseases like cancer and cardiovascular ailments, coupled with rising healthcare expenditure and technological advancements. The market's 7.20% CAGR suggests a significant expansion from its 2025 value. Key technological drivers include the adoption of Photoacoustic Tomography (PAT), Optical Coherence Tomography (OCT), and Hyperspectral Imaging, offering enhanced diagnostic capabilities and minimally invasive procedures. The substantial growth is further fueled by increasing investments in research and development within the pharmaceutical and biotechnology sectors, as well as expanding healthcare infrastructure across the region. The segmentation reveals a strong demand for optical imaging systems in ophthalmology, oncology, and cardiology, with hospitals and clinics representing the largest end-user segment. Countries like Saudi Arabia and the United Arab Emirates are leading the market due to their advanced healthcare systems and substantial investments in medical technology. However, challenges remain, including the high cost of advanced imaging technologies, limited healthcare accessibility in certain regions, and a scarcity of skilled professionals capable of operating and interpreting the sophisticated equipment. Despite these hurdles, the long-term outlook for the MEA optical imaging market remains positive, projecting continued expansion over the forecast period (2025-2033). This growth is expected to be fueled by the rising adoption of telemedicine and remote diagnostics which enhance accessibility and affordability.
The diverse applications of optical imaging technologies within MEA are creating numerous opportunities for growth. For instance, the increasing adoption of intraoperative imaging techniques in surgical procedures is contributing to improved surgical outcomes and patient safety. Furthermore, advancements in optical imaging software are facilitating more accurate image analysis and diagnosis, enhancing the precision and effectiveness of medical treatments. The presence of major players such as Headwall Photonics Inc, Canon Inc, and Carl Zeiss Meditec AG underscores the market's maturity and its attractiveness for foreign investment. While the Rest of Africa segment presents challenges related to infrastructure and economic development, initiatives focused on healthcare improvement and technological advancement are expected to stimulate market growth in these areas over the coming years. The market's future trajectory hinges on continuous technological innovation, government support for healthcare infrastructure, and the increasing awareness among healthcare professionals of the benefits of optical imaging techniques.
Middle-East and Africa Optical Imaging Industry Market Report: 2019-2033
This comprehensive report provides an in-depth analysis of the Middle East and Africa (MEA) optical imaging industry, covering the period 2019-2033. It offers actionable insights for industry stakeholders, investors, and businesses seeking to understand and capitalize on the growth opportunities within this dynamic market. The report analyzes market size, segmentation, growth drivers, challenges, and competitive landscape, providing a detailed forecast until 2033. Key segments analyzed include: By Country (Saudi Arabia, United Arab Emirates, South Africa, Rest of MENA); By Technology (Photoacoustic Tomography, Optical Coherence Tomography, Hyperspectral Imaging, Near-Infrared Spectroscopy, Other Technologies); By Product (Imaging Systems, Illumination Systems, Optical Imaging Software, Cameras, Other Products); By Application Area (Ophthalmology, Oncology, Cardiology, Dermatology, Neurology, Other Application Areas); By Application (Pathological Imaging, Intraoperative Imaging); and By End-user Industry (Hospitals and Clinics, Research and Diagnostic Laboratories, Pharmaceutical Industry, Biotechnology Companies, Other End-user Industries). The report also profiles leading players such as Headwall Photonics Inc, Canon Inc, Carl Zeiss Meditec AG, Heidelberg Engineering Inc, Leica Microsystems, Cytoviva Inc, Topcon Corporation, Optovue Inc, Bioptigen Inc, Abbott Laboratories, Perkinelmer Inc, and ChemImage Corporation.
Middle-East and Africa Optical Imaging Industry Market Concentration & Innovation
The MEA optical imaging market exhibits a moderately concentrated landscape, with a few dominant players holding significant market share. The exact market share distribution for each company is unavailable (xx%), however, established players like Canon Inc and Carl Zeiss Meditec AG benefit from strong brand recognition and extensive distribution networks. Innovation is a key driver, fueled by advancements in technologies like Optical Coherence Tomography (OCT) and Photoacoustic Tomography (PAT). Regulatory frameworks vary across MEA countries, influencing market entry and product approvals. The presence of substitute technologies, such as ultrasound and X-ray, creates competitive pressures. End-user trends indicate increasing adoption of minimally invasive procedures and a growing preference for advanced imaging techniques offering improved diagnostic accuracy. The M&A activity in the sector has been moderate, with deal values ranging from xx Million to xx Million in recent years, driven primarily by companies seeking to expand their product portfolio and geographic reach.
- Market Concentration: Moderately concentrated, with leading players holding xx% of market share.
- Innovation Drivers: Advancements in OCT, PAT, and other imaging technologies.
- Regulatory Frameworks: Varied across MEA countries, influencing market entry.
- Product Substitutes: Ultrasound, X-ray, and other imaging modalities.
- End-User Trends: Preference for minimally invasive procedures and advanced diagnostics.
- M&A Activity: Moderate activity, with deal values ranging from xx Million to xx Million.
Middle-East and Africa Optical Imaging Industry Industry Trends & Insights
The MEA optical imaging market is experiencing robust growth, driven by factors such as increasing healthcare expenditure, rising prevalence of chronic diseases, and growing adoption of advanced imaging technologies. The market's compound annual growth rate (CAGR) from 2025 to 2033 is estimated at xx%, fueled by significant investments in healthcare infrastructure and a rising demand for better diagnostic tools across various applications. Technological disruptions, particularly in areas like artificial intelligence (AI)-powered image analysis, are transforming diagnostic workflows and improving accuracy. Consumer preferences are shifting towards non-invasive procedures and faster, more accurate diagnostic results. Competitive dynamics are shaping market growth; established players face challenges from innovative entrants offering specialized solutions and cost-effective alternatives. Market penetration of advanced technologies like OCT and PAT is increasing, though varies significantly across countries based on healthcare infrastructure and physician adoption rates.
Dominant Markets & Segments in Middle-East and Africa Optical Imaging Industry
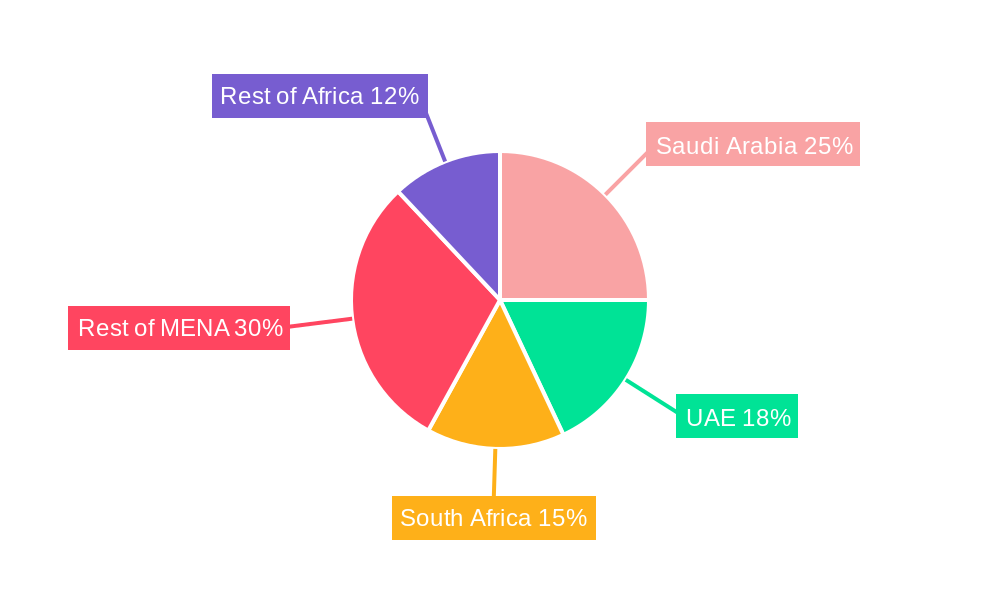
Based on the study period (2019-2024) and forecast (2025-2033), the United Arab Emirates (UAE) and Saudi Arabia represent the most dominant markets within the MEA region, followed by South Africa. The Rest of MENA region shows potential, but at a slower pace.
By Country:
- UAE & Saudi Arabia: Highest market share due to robust healthcare infrastructure and investment in advanced technologies. Key drivers include government initiatives promoting healthcare modernization, increased private sector investments in diagnostic centers, and rising prevalence of chronic diseases.
- South Africa: Significant growth, driven by increased healthcare spending and a growing focus on improving diagnostic capabilities.
- Rest of MENA: Slower growth, constrained by limited healthcare infrastructure and economic factors.
By Technology: Optical Coherence Tomography (OCT) dominates, driven by its wide applications in ophthalmology. Photoacoustic Tomography (PAT) shows promising growth but with a smaller market share currently.
By Product: Imaging systems hold the largest market share, followed by optical imaging software and cameras.
By Application Area: Ophthalmology represents the leading application area, followed by oncology and cardiology. Growth in these sectors is primarily driven by increased incidences of related diseases and the need for accurate diagnostics.
By Application: Pathological imaging is currently dominant, but intraoperative imaging is projected to experience faster growth due to increased use in minimally invasive surgeries.
By End-user Industry: Hospitals and clinics constitute the largest end-user segment, accounting for a significant share of the market revenue. Growth in this segment is tied directly to increases in healthcare spending.
Middle-East and Africa Optical Imaging Industry Product Developments
Recent product innovations focus on enhancing image quality, improving diagnostic accuracy, and integrating AI-powered features for automated analysis. Miniaturization and portability of imaging systems are also significant trends, facilitating wider access and point-of-care diagnostics. These innovations cater to the growing demand for faster, more efficient, and accurate diagnostic tools across various applications. The market is witnessing a rise in integrated systems, combining various imaging modalities for comprehensive diagnostics.
Report Scope & Segmentation Analysis
This report comprehensively segments the MEA optical imaging market across several parameters:
By Country: Saudi Arabia, UAE, South Africa, and Rest of MENA. Each country segment includes growth projections reflecting specific market dynamics.
By Technology: Photoacoustic Tomography (PAT), Optical Coherence Tomography (OCT), Hyperspectral Imaging, Near-Infrared Spectroscopy (NIRS), and Other Technologies. Growth projections vary based on technological advancements and adoption rates.
By Product: Imaging systems, illumination systems, optical imaging software, cameras, and other products. The market size and competitive dynamics differ across each product segment.
By Application Area: Ophthalmology, Oncology, Cardiology, Dermatology, Neurology, and Other Application Areas. Market size and growth vary substantially based on prevalence of related diseases and the demand for advanced diagnostic tools.
By Application: Pathological imaging and intraoperative imaging. Growth rates are influenced by the adoption of minimally invasive procedures and advances in surgical techniques.
By End-user Industry: Hospitals and Clinics, Research and Diagnostic Laboratories, Pharmaceutical Industry, Biotechnology Companies, and Other End-user Industries. The market is dominated by hospitals and clinics, but other sectors contribute significantly to market growth.
Key Drivers of Middle-East and Africa Optical Imaging Industry Growth
Several factors propel the MEA optical imaging market's growth. Increasing healthcare expenditure and government initiatives promoting healthcare modernization are key drivers. The rising prevalence of chronic diseases, particularly those requiring advanced diagnostics, fuels demand for sophisticated imaging technologies. Technological advancements, including AI integration, improve diagnostic accuracy and efficiency. The growing adoption of minimally invasive procedures further expands the market for intraoperative imaging systems.
Challenges in the Middle-East and Africa Optical Imaging Industry Sector
Despite the growth potential, the MEA optical imaging market faces challenges. Varied regulatory frameworks and bureaucratic hurdles can slow down market entry and product approvals. High costs associated with advanced imaging systems and a lack of trained personnel may limit adoption in some regions. Supply chain disruptions and the fluctuating currency exchange rates can impact the cost of imported equipment and consumables. Strong competition from established international players also poses a challenge for smaller companies.
Emerging Opportunities in Middle-East and Africa Optical Imaging Industry
The MEA optical imaging market presents numerous opportunities. The increasing adoption of telemedicine and remote diagnostics provides avenues for integrating optical imaging technologies into remote healthcare delivery systems. The growing demand for point-of-care diagnostics offers opportunities for developing portable and user-friendly imaging systems. Investment in research and development of new imaging techniques and AI-powered diagnostic tools presents significant growth potential for innovative players. Furthermore, focusing on specialized applications within specific disease areas can yield high returns.
Leading Players in the Middle-East and Africa Optical Imaging Industry Market
- Headwall Photonics Inc
- Canon Inc
- Carl Zeiss Meditec AG
- Heidelberg Engineering Inc
- Leica Microsystems
- Cytoviva Inc
- Topcon Corporation
- Optovue Inc
- Bioptigen Inc
- Abbott Laboratories
- Perkinelmer Inc
- ChemImage Corporation
Key Developments in Middle-East and Africa Optical Imaging Industry Industry
November 2021: MedX Health Corp. and Al Zahrawi Medical Supplies LLC signed a Memorandum of Understanding for a two-phase commercialization pilot and distribution agreement for MedX's DermSecure Screening Platform in the UAE. This signifies increased market interest in advanced dermatological screening technologies.
October 2021: The Barraquer clinic opened in Dubai, introducing state-of-the-art ophthalmology technology and expertise. This highlights growing investments in advanced healthcare infrastructure in the region and a rising demand for high-quality eye care.
Strategic Outlook for Middle-East and Africa Optical Imaging Industry Market
The MEA optical imaging market is poised for substantial growth over the forecast period. Continued investments in healthcare infrastructure, rising prevalence of chronic diseases, and advancements in imaging technology will drive market expansion. Companies focusing on innovation, strategic partnerships, and catering to specific regional needs will be best positioned to capture significant market share. The increasing adoption of AI and telemedicine will further create new growth opportunities.
Middle-East and Africa Optical Imaging Industry Segmentation
-
1. Technology
- 1.1. Photoacoustic Tomography
- 1.2. Optical Coherence Tomography
- 1.3. Hyperspectral Imaging
- 1.4. Near-Infrared Spectroscopy
- 1.5. Other Technologies
-
2. Product
- 2.1. Imaging Systems
- 2.2. Illumination Systems
- 2.3. Optical Imaging Software
- 2.4. Cameras
- 2.5. Other Products
-
3. Application Area
- 3.1. Ophthalmology
- 3.2. Oncology
- 3.3. Cardiology
- 3.4. Dermatology
- 3.5. Neurology
- 3.6. Other Application Areas
-
4. Application
- 4.1. Pathological Imaging
- 4.2. Intraoperative Imaging
-
5. End-user Industry
- 5.1. Hospitals and Clinics
- 5.2. Research and Diagnostic Laboratories
- 5.3. Pharmaceutical Industry
- 5.4. Biotechnology Companies
- 5.5. Other End-user Industries
Middle-East and Africa Optical Imaging Industry Segmentation By Geography
-
1. Middle East
- 1.1. Saudi Arabia
- 1.2. United Arab Emirates
- 1.3. Israel
- 1.4. Qatar
- 1.5. Kuwait
- 1.6. Oman
- 1.7. Bahrain
- 1.8. Jordan
- 1.9. Lebanon
Middle-East and Africa Optical Imaging Industry REPORT HIGHLIGHTS
| Aspects | Details |
|---|---|
| Study Period | 2019-2033 |
| Base Year | 2024 |
| Estimated Year | 2025 |
| Forecast Period | 2025-2033 |
| Historical Period | 2019-2024 |
| Growth Rate | CAGR of 7.20% from 2019-2033 |
| Segmentation |
|
Table of Contents
- 1. Introduction
- 1.1. Research Scope
- 1.2. Market Segmentation
- 1.3. Research Methodology
- 1.4. Definitions and Assumptions
- 2. Executive Summary
- 2.1. Introduction
- 3. Market Dynamics
- 3.1. Introduction
- 3.2. Market Drivers
- 3.2.1. Increasing Eye diseases such as dry eyes in MENA region; High Demand from Professional Services in Healthcare
- 3.3. Market Restrains
- 3.3.1. Competition from Other Substitutes
- 3.4. Market Trends
- 3.4.1. Ophthalmology to Show Significant Growth
- 4. Market Factor Analysis
- 4.1. Porters Five Forces
- 4.2. Supply/Value Chain
- 4.3. PESTEL analysis
- 4.4. Market Entropy
- 4.5. Patent/Trademark Analysis
- 5. Middle-East and Africa Optical Imaging Industry Analysis, Insights and Forecast, 2019-2031
- 5.1. Market Analysis, Insights and Forecast - by Technology
- 5.1.1. Photoacoustic Tomography
- 5.1.2. Optical Coherence Tomography
- 5.1.3. Hyperspectral Imaging
- 5.1.4. Near-Infrared Spectroscopy
- 5.1.5. Other Technologies
- 5.2. Market Analysis, Insights and Forecast - by Product
- 5.2.1. Imaging Systems
- 5.2.2. Illumination Systems
- 5.2.3. Optical Imaging Software
- 5.2.4. Cameras
- 5.2.5. Other Products
- 5.3. Market Analysis, Insights and Forecast - by Application Area
- 5.3.1. Ophthalmology
- 5.3.2. Oncology
- 5.3.3. Cardiology
- 5.3.4. Dermatology
- 5.3.5. Neurology
- 5.3.6. Other Application Areas
- 5.4. Market Analysis, Insights and Forecast - by Application
- 5.4.1. Pathological Imaging
- 5.4.2. Intraoperative Imaging
- 5.5. Market Analysis, Insights and Forecast - by End-user Industry
- 5.5.1. Hospitals and Clinics
- 5.5.2. Research and Diagnostic Laboratories
- 5.5.3. Pharmaceutical Industry
- 5.5.4. Biotechnology Companies
- 5.5.5. Other End-user Industries
- 5.6. Market Analysis, Insights and Forecast - by Region
- 5.6.1. Middle East
- 5.1. Market Analysis, Insights and Forecast - by Technology
- 6. South Africa Middle-East and Africa Optical Imaging Industry Analysis, Insights and Forecast, 2019-2031
- 7. Sudan Middle-East and Africa Optical Imaging Industry Analysis, Insights and Forecast, 2019-2031
- 8. Uganda Middle-East and Africa Optical Imaging Industry Analysis, Insights and Forecast, 2019-2031
- 9. Tanzania Middle-East and Africa Optical Imaging Industry Analysis, Insights and Forecast, 2019-2031
- 10. Kenya Middle-East and Africa Optical Imaging Industry Analysis, Insights and Forecast, 2019-2031
- 11. Rest of Africa Middle-East and Africa Optical Imaging Industry Analysis, Insights and Forecast, 2019-2031
- 12. Competitive Analysis
- 12.1. Market Share Analysis 2024
- 12.2. Company Profiles
- 12.2.1 Headwall Photonics Inc
- 12.2.1.1. Overview
- 12.2.1.2. Products
- 12.2.1.3. SWOT Analysis
- 12.2.1.4. Recent Developments
- 12.2.1.5. Financials (Based on Availability)
- 12.2.2 Canon Inc
- 12.2.2.1. Overview
- 12.2.2.2. Products
- 12.2.2.3. SWOT Analysis
- 12.2.2.4. Recent Developments
- 12.2.2.5. Financials (Based on Availability)
- 12.2.3 Carl Zeiss Meditec AG
- 12.2.3.1. Overview
- 12.2.3.2. Products
- 12.2.3.3. SWOT Analysis
- 12.2.3.4. Recent Developments
- 12.2.3.5. Financials (Based on Availability)
- 12.2.4 Heidelberg Engineering Inc
- 12.2.4.1. Overview
- 12.2.4.2. Products
- 12.2.4.3. SWOT Analysis
- 12.2.4.4. Recent Developments
- 12.2.4.5. Financials (Based on Availability)
- 12.2.5 Leica Microsystems
- 12.2.5.1. Overview
- 12.2.5.2. Products
- 12.2.5.3. SWOT Analysis
- 12.2.5.4. Recent Developments
- 12.2.5.5. Financials (Based on Availability)
- 12.2.6 Cytoviva Inc
- 12.2.6.1. Overview
- 12.2.6.2. Products
- 12.2.6.3. SWOT Analysis
- 12.2.6.4. Recent Developments
- 12.2.6.5. Financials (Based on Availability)
- 12.2.7 Topcon Corporation
- 12.2.7.1. Overview
- 12.2.7.2. Products
- 12.2.7.3. SWOT Analysis
- 12.2.7.4. Recent Developments
- 12.2.7.5. Financials (Based on Availability)
- 12.2.8 Optovue Inc
- 12.2.8.1. Overview
- 12.2.8.2. Products
- 12.2.8.3. SWOT Analysis
- 12.2.8.4. Recent Developments
- 12.2.8.5. Financials (Based on Availability)
- 12.2.9 Bioptigen Inc
- 12.2.9.1. Overview
- 12.2.9.2. Products
- 12.2.9.3. SWOT Analysis
- 12.2.9.4. Recent Developments
- 12.2.9.5. Financials (Based on Availability)
- 12.2.10 Abbott Laboratories
- 12.2.10.1. Overview
- 12.2.10.2. Products
- 12.2.10.3. SWOT Analysis
- 12.2.10.4. Recent Developments
- 12.2.10.5. Financials (Based on Availability)
- 12.2.11 Perkinelmer Inc
- 12.2.11.1. Overview
- 12.2.11.2. Products
- 12.2.11.3. SWOT Analysis
- 12.2.11.4. Recent Developments
- 12.2.11.5. Financials (Based on Availability)
- 12.2.12 ChemImage Corporation
- 12.2.12.1. Overview
- 12.2.12.2. Products
- 12.2.12.3. SWOT Analysis
- 12.2.12.4. Recent Developments
- 12.2.12.5. Financials (Based on Availability)
- 12.2.1 Headwall Photonics Inc
List of Figures
- Figure 1: Middle-East and Africa Optical Imaging Industry Revenue Breakdown (Million, %) by Product 2024 & 2032
- Figure 2: Middle-East and Africa Optical Imaging Industry Share (%) by Company 2024
List of Tables
- Table 1: Middle-East and Africa Optical Imaging Industry Revenue Million Forecast, by Region 2019 & 2032
- Table 2: Middle-East and Africa Optical Imaging Industry Volume K Unit Forecast, by Region 2019 & 2032
- Table 3: Middle-East and Africa Optical Imaging Industry Revenue Million Forecast, by Technology 2019 & 2032
- Table 4: Middle-East and Africa Optical Imaging Industry Volume K Unit Forecast, by Technology 2019 & 2032
- Table 5: Middle-East and Africa Optical Imaging Industry Revenue Million Forecast, by Product 2019 & 2032
- Table 6: Middle-East and Africa Optical Imaging Industry Volume K Unit Forecast, by Product 2019 & 2032
- Table 7: Middle-East and Africa Optical Imaging Industry Revenue Million Forecast, by Application Area 2019 & 2032
- Table 8: Middle-East and Africa Optical Imaging Industry Volume K Unit Forecast, by Application Area 2019 & 2032
- Table 9: Middle-East and Africa Optical Imaging Industry Revenue Million Forecast, by Application 2019 & 2032
- Table 10: Middle-East and Africa Optical Imaging Industry Volume K Unit Forecast, by Application 2019 & 2032
- Table 11: Middle-East and Africa Optical Imaging Industry Revenue Million Forecast, by End-user Industry 2019 & 2032
- Table 12: Middle-East and Africa Optical Imaging Industry Volume K Unit Forecast, by End-user Industry 2019 & 2032
- Table 13: Middle-East and Africa Optical Imaging Industry Revenue Million Forecast, by Region 2019 & 2032
- Table 14: Middle-East and Africa Optical Imaging Industry Volume K Unit Forecast, by Region 2019 & 2032
- Table 15: Middle-East and Africa Optical Imaging Industry Revenue Million Forecast, by Country 2019 & 2032
- Table 16: Middle-East and Africa Optical Imaging Industry Volume K Unit Forecast, by Country 2019 & 2032
- Table 17: South Africa Middle-East and Africa Optical Imaging Industry Revenue (Million) Forecast, by Application 2019 & 2032
- Table 18: South Africa Middle-East and Africa Optical Imaging Industry Volume (K Unit) Forecast, by Application 2019 & 2032
- Table 19: Sudan Middle-East and Africa Optical Imaging Industry Revenue (Million) Forecast, by Application 2019 & 2032
- Table 20: Sudan Middle-East and Africa Optical Imaging Industry Volume (K Unit) Forecast, by Application 2019 & 2032
- Table 21: Uganda Middle-East and Africa Optical Imaging Industry Revenue (Million) Forecast, by Application 2019 & 2032
- Table 22: Uganda Middle-East and Africa Optical Imaging Industry Volume (K Unit) Forecast, by Application 2019 & 2032
- Table 23: Tanzania Middle-East and Africa Optical Imaging Industry Revenue (Million) Forecast, by Application 2019 & 2032
- Table 24: Tanzania Middle-East and Africa Optical Imaging Industry Volume (K Unit) Forecast, by Application 2019 & 2032
- Table 25: Kenya Middle-East and Africa Optical Imaging Industry Revenue (Million) Forecast, by Application 2019 & 2032
- Table 26: Kenya Middle-East and Africa Optical Imaging Industry Volume (K Unit) Forecast, by Application 2019 & 2032
- Table 27: Rest of Africa Middle-East and Africa Optical Imaging Industry Revenue (Million) Forecast, by Application 2019 & 2032
- Table 28: Rest of Africa Middle-East and Africa Optical Imaging Industry Volume (K Unit) Forecast, by Application 2019 & 2032
- Table 29: Middle-East and Africa Optical Imaging Industry Revenue Million Forecast, by Technology 2019 & 2032
- Table 30: Middle-East and Africa Optical Imaging Industry Volume K Unit Forecast, by Technology 2019 & 2032
- Table 31: Middle-East and Africa Optical Imaging Industry Revenue Million Forecast, by Product 2019 & 2032
- Table 32: Middle-East and Africa Optical Imaging Industry Volume K Unit Forecast, by Product 2019 & 2032
- Table 33: Middle-East and Africa Optical Imaging Industry Revenue Million Forecast, by Application Area 2019 & 2032
- Table 34: Middle-East and Africa Optical Imaging Industry Volume K Unit Forecast, by Application Area 2019 & 2032
- Table 35: Middle-East and Africa Optical Imaging Industry Revenue Million Forecast, by Application 2019 & 2032
- Table 36: Middle-East and Africa Optical Imaging Industry Volume K Unit Forecast, by Application 2019 & 2032
- Table 37: Middle-East and Africa Optical Imaging Industry Revenue Million Forecast, by End-user Industry 2019 & 2032
- Table 38: Middle-East and Africa Optical Imaging Industry Volume K Unit Forecast, by End-user Industry 2019 & 2032
- Table 39: Middle-East and Africa Optical Imaging Industry Revenue Million Forecast, by Country 2019 & 2032
- Table 40: Middle-East and Africa Optical Imaging Industry Volume K Unit Forecast, by Country 2019 & 2032
- Table 41: Saudi Arabia Middle-East and Africa Optical Imaging Industry Revenue (Million) Forecast, by Application 2019 & 2032
- Table 42: Saudi Arabia Middle-East and Africa Optical Imaging Industry Volume (K Unit) Forecast, by Application 2019 & 2032
- Table 43: United Arab Emirates Middle-East and Africa Optical Imaging Industry Revenue (Million) Forecast, by Application 2019 & 2032
- Table 44: United Arab Emirates Middle-East and Africa Optical Imaging Industry Volume (K Unit) Forecast, by Application 2019 & 2032
- Table 45: Israel Middle-East and Africa Optical Imaging Industry Revenue (Million) Forecast, by Application 2019 & 2032
- Table 46: Israel Middle-East and Africa Optical Imaging Industry Volume (K Unit) Forecast, by Application 2019 & 2032
- Table 47: Qatar Middle-East and Africa Optical Imaging Industry Revenue (Million) Forecast, by Application 2019 & 2032
- Table 48: Qatar Middle-East and Africa Optical Imaging Industry Volume (K Unit) Forecast, by Application 2019 & 2032
- Table 49: Kuwait Middle-East and Africa Optical Imaging Industry Revenue (Million) Forecast, by Application 2019 & 2032
- Table 50: Kuwait Middle-East and Africa Optical Imaging Industry Volume (K Unit) Forecast, by Application 2019 & 2032
- Table 51: Oman Middle-East and Africa Optical Imaging Industry Revenue (Million) Forecast, by Application 2019 & 2032
- Table 52: Oman Middle-East and Africa Optical Imaging Industry Volume (K Unit) Forecast, by Application 2019 & 2032
- Table 53: Bahrain Middle-East and Africa Optical Imaging Industry Revenue (Million) Forecast, by Application 2019 & 2032
- Table 54: Bahrain Middle-East and Africa Optical Imaging Industry Volume (K Unit) Forecast, by Application 2019 & 2032
- Table 55: Jordan Middle-East and Africa Optical Imaging Industry Revenue (Million) Forecast, by Application 2019 & 2032
- Table 56: Jordan Middle-East and Africa Optical Imaging Industry Volume (K Unit) Forecast, by Application 2019 & 2032
- Table 57: Lebanon Middle-East and Africa Optical Imaging Industry Revenue (Million) Forecast, by Application 2019 & 2032
- Table 58: Lebanon Middle-East and Africa Optical Imaging Industry Volume (K Unit) Forecast, by Application 2019 & 2032
Frequently Asked Questions
1. What is the projected Compound Annual Growth Rate (CAGR) of the Middle-East and Africa Optical Imaging Industry?
The projected CAGR is approximately 7.20%.
2. Which companies are prominent players in the Middle-East and Africa Optical Imaging Industry?
Key companies in the market include Headwall Photonics Inc, Canon Inc, Carl Zeiss Meditec AG, Heidelberg Engineering Inc, Leica Microsystems, Cytoviva Inc, Topcon Corporation, Optovue Inc, Bioptigen Inc, Abbott Laboratories, Perkinelmer Inc, ChemImage Corporation.
3. What are the main segments of the Middle-East and Africa Optical Imaging Industry?
The market segments include Technology, Product, Application Area, Application, End-user Industry.
4. Can you provide details about the market size?
The market size is estimated to be USD XX Million as of 2022.
5. What are some drivers contributing to market growth?
Increasing Eye diseases such as dry eyes in MENA region; High Demand from Professional Services in Healthcare.
6. What are the notable trends driving market growth?
Ophthalmology to Show Significant Growth.
7. Are there any restraints impacting market growth?
Competition from Other Substitutes.
8. Can you provide examples of recent developments in the market?
November 2021 - MedX Health Corp. and Al Zahrawi Medical Supplies LLC signed a Memorandum of Understanding between the companies on a two-phase commercialization pilot and distribution agreement for MedX's leading-edge DermSecure Screening Platform at select United Arab Emirates oncology and dermatology clinics beginning this month.
9. What pricing options are available for accessing the report?
Pricing options include single-user, multi-user, and enterprise licenses priced at USD 4750, USD 4950, and USD 6800 respectively.
10. Is the market size provided in terms of value or volume?
The market size is provided in terms of value, measured in Million and volume, measured in K Unit.
11. Are there any specific market keywords associated with the report?
Yes, the market keyword associated with the report is "Middle-East and Africa Optical Imaging Industry," which aids in identifying and referencing the specific market segment covered.
12. How do I determine which pricing option suits my needs best?
The pricing options vary based on user requirements and access needs. Individual users may opt for single-user licenses, while businesses requiring broader access may choose multi-user or enterprise licenses for cost-effective access to the report.
13. Are there any additional resources or data provided in the Middle-East and Africa Optical Imaging Industry report?
While the report offers comprehensive insights, it's advisable to review the specific contents or supplementary materials provided to ascertain if additional resources or data are available.
14. How can I stay updated on further developments or reports in the Middle-East and Africa Optical Imaging Industry?
To stay informed about further developments, trends, and reports in the Middle-East and Africa Optical Imaging Industry, consider subscribing to industry newsletters, following relevant companies and organizations, or regularly checking reputable industry news sources and publications.
Methodology
Step 1 - Identification of Relevant Samples Size from Population Database


Step 2 - Approaches for Defining Global Market Size (Value, Volume* & Price*)

Note*: In applicable scenarios
Step 3 - Data Sources
Primary Research
- Web Analytics
- Survey Reports
- Research Institute
- Latest Research Reports
- Opinion Leaders
Secondary Research
- Annual Reports
- White Paper
- Latest Press Release
- Industry Association
- Paid Database
- Investor Presentations

Step 4 - Data Triangulation
Involves using different sources of information in order to increase the validity of a study
These sources are likely to be stakeholders in a program - participants, other researchers, program staff, other community members, and so on.
Then we put all data in single framework & apply various statistical tools to find out the dynamic on the market.
During the analysis stage, feedback from the stakeholder groups would be compared to determine areas of agreement as well as areas of divergence


