
Key Insights
The SATA Solid State Drive (SSD) market is poised for robust growth, projected to reach an estimated market size of approximately $15 billion by 2025, with a projected Compound Annual Growth Rate (CAGR) of around 10% through 2033. This sustained expansion is fueled by the persistent demand for faster data access and improved system performance across both individual and commercial applications. While M.2 drives are gaining traction for their speed and form factor, the widespread compatibility and cost-effectiveness of 2.5-inch SATA SSDs ensure their continued dominance in the market, particularly for upgrades and in enterprise environments where existing infrastructure favors the SATA interface. The increasing adoption of SSDs in laptops and desktops, driven by the desire for quicker boot times and application loading, remains a primary catalyst. Furthermore, the growing cloud computing sector and the need for reliable, high-capacity storage solutions in data centers are significantly contributing to market expansion. Emerging economies, with their burgeoning digital infrastructure and increasing PC penetration, represent a substantial untapped market for SATA SSDs.
Despite the impressive growth trajectory, the SATA SSD market faces certain restraints, primarily the escalating competition from newer, faster interfaces like NVMe. As NVMe SSD prices continue to decline and motherboard support becomes more ubiquitous, the performance gap may lead some consumers and businesses to prioritize NVMe solutions. However, the cost sensitivity in certain market segments and the established infrastructure supporting SATA technology will act as a significant buffer, ensuring continued demand. Key players like Samsung, Kingston, and Western Digital are actively investing in innovation to enhance SATA SSD performance and offer a wider range of capacities to cater to diverse user needs. Trends such as the integration of SATA SSDs in budget-friendly laptops and the use of hybrid storage solutions, combining SSDs with traditional HDDs, will also play a crucial role in maintaining the market's momentum. The market is segmented by application into Individual Use and Commercial Use, with 2.5-Inch Basic Drives and M.2 Drives representing the primary types, all contributing to a dynamic and evolving market landscape.
SATA SSD Market Concentration & Innovation
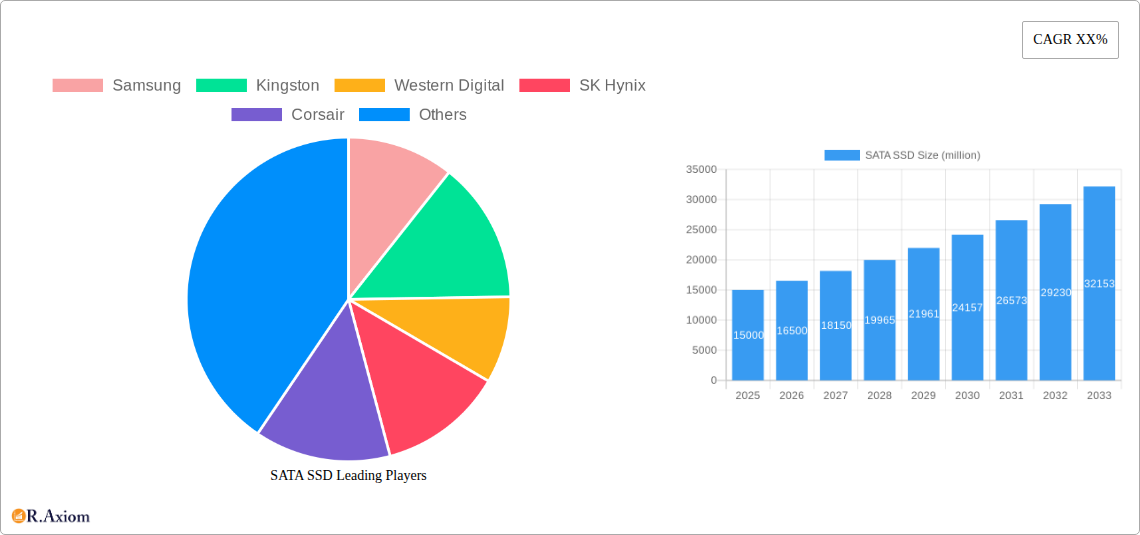
The global SATA Solid State Drive (SSD) market is characterized by a moderate level of concentration, with major players such as Samsung, Kingston, Western Digital, SK Hynix, Corsair, Seagate Technology, ADATA, Micron Technology, Gigabyte, and Sabrent holding significant market shares. In the historical period (2019-2024), market share estimations indicate that Samsung led with approximately 25% of the global market revenue, followed closely by Western Digital and SK Hynix, each commanding around 15%. Kingston and ADATA collectively held approximately 20% of the market. The remaining market share was distributed among other key players and numerous smaller manufacturers.
Innovation remains a primary driver in the SATA SSD sector, primarily focused on enhancing performance, increasing capacities, and improving endurance at competitive price points. Key innovation areas include advancements in NAND flash technology (e.g., TLC, QLC), firmware optimization for better read/write speeds and latency reduction, and improved thermal management solutions, especially for M.2 form factors. Regulatory frameworks, while generally supportive of technological advancement, primarily focus on data security, consumer protection, and environmental compliance for manufacturing processes. Product substitutes, such as NVMe SSDs, pose a growing competitive challenge, particularly for performance-intensive applications, forcing SATA SSD manufacturers to refine their value proposition, emphasizing cost-effectiveness and compatibility for a broad range of devices. End-user trends reveal a sustained demand for affordable storage upgrades for consumer laptops and desktops, as well as reliable storage solutions for commercial applications. Mergers and acquisition (M&A) activities have been limited in the recent past, with no major disclosed deal values exceeding a few hundred million dollars, signaling a maturing market where organic growth and strategic partnerships are more prevalent than large-scale consolidation.
SATA SSD Industry Trends & Insights
The SATA SSD industry is poised for robust growth driven by several interconnected factors, painting a positive trajectory from the historical period of 2019-2024 through the forecast period of 2025-2033, with a projected Compound Annual Growth Rate (CAGR) of approximately 8.5% from the base year of 2025. This growth is underpinned by the continuous decline in the average selling price (ASP) of NAND flash memory and the increasing demand for faster storage solutions across diverse computing platforms. The global market penetration of SSDs in computing devices, which stood at roughly 60% by the end of 2024, is expected to climb steadily, further solidifying the importance of SATA SSDs as a cost-effective upgrade option for a vast installed base of older systems.
Technological disruptions, while predominantly favoring NVMe interfaces for high-performance computing, are also indirectly benefiting the SATA segment. As NVMe technology matures and its costs decrease, the overall SSD market expands, trickling down to increased adoption of SATA SSDs in mainstream and budget-conscious devices. Furthermore, advancements in SATA controller technology continue to push the performance boundaries of the interface, offering incremental improvements in speeds and efficiency. Consumer preferences are increasingly leaning towards SSDs for their noticeable boot time improvements, faster application loading, and quieter operation compared to traditional Hard Disk Drives (HDDs). This has fueled a sustained demand for SATA SSDs in the consumer segment, particularly for laptop upgrades and entry-level gaming PCs. In the commercial sphere, the need for reliable, affordable storage for workstations, point-of-sale systems, and general business computing continues to be a significant market driver. Competitive dynamics are intense, with leading companies like Samsung, Kingston, Western Digital, and SK Hynix vying for market share through aggressive pricing strategies, product diversification, and continuous innovation in NAND technology and controller efficiency. ADATA and Corsair also play crucial roles, particularly in offering a wide range of capacities and performance tiers to cater to different market segments. The ecosystem is also influenced by Gigabyte and Sabrent, who are increasingly active in the consumer storage market with competitive offerings.
Dominant Markets & Segments in SATA SSD
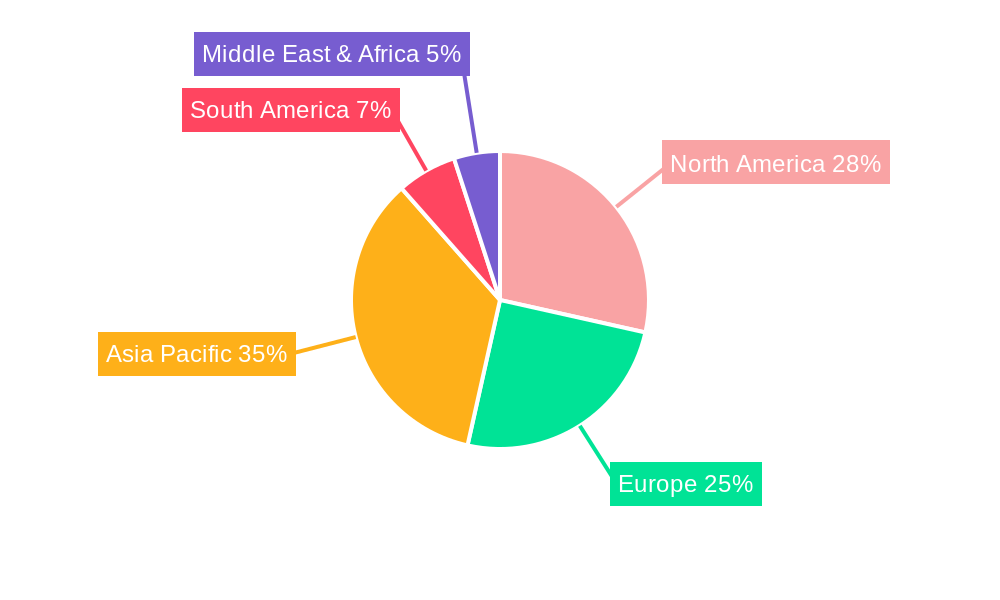
The SATA SSD market exhibits distinct dominance across various geographic regions and application segments, driven by economic policies, infrastructure development, and prevailing consumer and commercial demands. Asia Pacific has emerged as the leading region, driven by its massive manufacturing capabilities, a burgeoning middle class with increasing disposable income for personal computing upgrades, and significant government investments in digital infrastructure and technology adoption. Within this region, China, in particular, stands out as a dominant market due to its vast consumer base and robust enterprise sector. Key drivers for this dominance include supportive economic policies fostering domestic technology production and consumption, widespread availability of high-speed internet, and a rapid pace of digital transformation across industries.
In terms of Application, Individual Use constitutes a significant portion of the SATA SSD market. This segment's dominance is fueled by the continuous upgrade cycle of personal computers, laptops, and gaming consoles. Consumers are increasingly recognizing the tangible benefits of SSDs, such as significantly reduced boot times, faster application loading, and a smoother overall computing experience, making them an essential component for home users. The affordability of SATA SSDs, especially in comparison to their NVMe counterparts, makes them an ideal choice for upgrading older machines and extending their usable lifespan, thereby driving substantial volume sales. The economic policies supporting consumer electronics manufacturing and sales, coupled with robust e-commerce platforms that facilitate widespread product availability, further bolster this segment's growth.
Within the Types segmentation, the 2.5-Inch Basic Drive format continues to hold considerable market share, particularly in the replacement and upgrade markets. This form factor's ubiquity in older laptops and desktops, along with its widespread compatibility and ease of installation, ensures its continued relevance. Infrastructure development, such as the vast installed base of legacy computing devices in both consumer and commercial settings, directly supports the sustained demand for 2.5-inch SATA SSDs. While the M.2 form factor is gaining traction for its sleek design and performance benefits, the sheer volume of existing systems designed to accommodate 2.5-inch drives solidifies its dominant position in terms of unit sales. The economic imperative for cost-effective upgrades also favors the 2.5-inch form factor, as it often represents the most budget-friendly entry point into SSD technology for many users.
SATA SSD Product Developments
SATA SSD product developments are centered on delivering enhanced value through increased capacities, improved endurance ratings, and optimized performance for mainstream computing. Manufacturers like Samsung and Crucial (Micron Technology) are pushing the boundaries of NAND flash density, enabling larger capacity SATA SSDs at more accessible price points, often exceeding one million gigabytes. Firmware innovations continue to refine error correction, wear leveling, and garbage collection algorithms, leading to a more consistent user experience and extended drive lifespan, with endurance ratings often reaching hundreds of terabytes written (TBW). Competitive advantages are being carved out through strategic partnerships with motherboard manufacturers like Gigabyte to ensure seamless integration and optimized performance.
Report Scope & Segmentation Analysis
This report provides a comprehensive analysis of the SATA SSD market, encompassing key segments crucial for understanding market dynamics and future growth. The Individual Use segment is projected to witness a market size of approximately fifteen thousand million dollars by 2025, driven by the demand for faster personal computing experiences and affordable storage upgrades. Competitive dynamics are characterized by aggressive pricing and capacity offerings from leading brands. The Commercial Use segment is estimated to reach a market size of eight thousand million dollars in 2025, with growth fueled by the need for reliable and cost-effective storage solutions in enterprise environments, workstations, and data centers.
In terms of form factors, the 2.5-Inch Basic Drive segment is expected to account for a market size of thirteen thousand million dollars in 2025. Its growth is sustained by the large installed base of legacy devices and its role as a primary upgrade option for budget-conscious users. The M.2 Drive segment, though newer, is projected to reach a market size of ten thousand million dollars by 2025. Its growth is propelled by the increasing adoption of M.2 slots in modern laptops and desktops, offering a more compact and often faster, albeit still SATA-interface based, storage solution.
Key Drivers of SATA SSD Growth
The growth of the SATA SSD market is propelled by a confluence of technological advancements, economic factors, and evolving consumer behavior. A primary driver is the relentless decline in NAND flash memory prices, making higher capacity SSDs increasingly affordable for a broader consumer base. Economic policies promoting digital transformation and increased personal computing adoption, particularly in emerging economies, contribute significantly to demand. Furthermore, the sustained need for performance upgrades in older computing devices, extending their lifespan and user satisfaction, remains a critical growth catalyst. The widespread availability of SATA SSDs through online and offline retail channels, supported by efficient supply chain networks from companies like Kingston and ADATA, ensures accessibility.
Challenges in the SATA SSD Sector
Despite its growth, the SATA SSD sector faces several challenges. The most prominent is the intensifying competition from NVMe SSDs, which offer superior performance, particularly in sequential read/write speeds and latency, for a gradually decreasing price premium. This technological cannibalization poses a significant threat, forcing SATA SSD manufacturers to focus on cost leadership and specific use cases where extreme performance is not paramount. Regulatory hurdles, though less impactful than technical competition, can arise from evolving data privacy laws and component sourcing regulations, potentially impacting manufacturing costs and supply chain stability. Furthermore, the commoditization of certain SATA SSD segments can lead to margin compression for manufacturers.
Emerging Opportunities in SATA SSD
Emerging opportunities for SATA SSDs lie in catering to specific market niches and leveraging evolving consumer preferences. The burgeoning IoT (Internet of Things) market presents an opportunity for ruggedized and low-power SATA SSDs in embedded systems and industrial applications. The continued demand for affordable storage upgrades in the vast installed base of older laptops and desktops represents a stable and significant market. Moreover, the increasing adoption of cloud gaming and streaming services, while also supporting NVMe, can indirectly boost demand for affordable, larger capacity SSDs for local game storage and caching. The expansion of digital content creation by individuals and small businesses also fuels the need for reliable and cost-effective storage solutions.
Leading Players in the SATA SSD Market
- Samsung
- Kingston
- Western Digital
- SK Hynix
- Corsair
- Seagate Technology
- ADATA
- Micron Technology
- Gigabyte
- Sabrent
Key Developments in SATA SSD Industry
- 2023: Continued advancements in QLC NAND flash technology leading to cost reductions and higher capacities for SATA SSDs.
- 2023: Increased focus on firmware optimization to eke out further performance gains from the SATA III interface.
- 2024: Launch of new SATA SSD models from major players like Samsung and Western Digital offering capacities up to 8 million gigabytes.
- 2024: Growing adoption of SATA SSDs in budget-friendly laptops and entry-level workstations.
- 2025: Projected increase in market share for 2.5-inch form factor SSDs in the replacement market.
- 2026: Expected further price erosion in NAND flash memory, making high-capacity SATA SSDs even more accessible.
- 2028: Potential for new SATA controller technologies that push bandwidth limits of the existing interface.
- 2030: Sustained demand for SATA SSDs in commercial applications requiring reliable, cost-effective storage.
- 2033: Continued relevance of SATA SSDs in niche markets and for legacy system upgrades.
Strategic Outlook for SATA SSD Market
The strategic outlook for the SATA SSD market remains positive, driven by its inherent cost-effectiveness and broad compatibility. Manufacturers will continue to focus on optimizing NAND flash utilization and firmware efficiency to deliver the best possible performance-per-dollar. The market will likely see sustained demand from the individual user segment for system upgrades and from commercial sectors requiring reliable, budget-friendly storage solutions. While NVMe SSDs will continue to dominate high-performance applications, SATA SSDs are poised to maintain a significant market share by serving the massive installed base of devices and catering to the needs of the price-sensitive consumer and enterprise markets, ensuring their continued relevance throughout the forecast period.
SATA SSD Segmentation
-
1. Application
- 1.1. Individual Use
- 1.2. Commercial Use
-
2. Types
- 2.1. 2.5-Inch Basic Drive
- 2.2. M.2 Drive
SATA SSD Segmentation By Geography
-
1. North America
- 1.1. United States
- 1.2. Canada
- 1.3. Mexico
-
2. South America
- 2.1. Brazil
- 2.2. Argentina
- 2.3. Rest of South America
-
3. Europe
- 3.1. United Kingdom
- 3.2. Germany
- 3.3. France
- 3.4. Italy
- 3.5. Spain
- 3.6. Russia
- 3.7. Benelux
- 3.8. Nordics
- 3.9. Rest of Europe
-
4. Middle East & Africa
- 4.1. Turkey
- 4.2. Israel
- 4.3. GCC
- 4.4. North Africa
- 4.5. South Africa
- 4.6. Rest of Middle East & Africa
-
5. Asia Pacific
- 5.1. China
- 5.2. India
- 5.3. Japan
- 5.4. South Korea
- 5.5. ASEAN
- 5.6. Oceania
- 5.7. Rest of Asia Pacific
SATA SSD REPORT HIGHLIGHTS
| Aspects | Details |
|---|---|
| Study Period | 2019-2033 |
| Base Year | 2024 |
| Estimated Year | 2025 |
| Forecast Period | 2025-2033 |
| Historical Period | 2019-2024 |
| Growth Rate | CAGR of XX% from 2019-2033 |
| Segmentation |
|
Table of Contents
- 1. Introduction
- 1.1. Research Scope
- 1.2. Market Segmentation
- 1.3. Research Methodology
- 1.4. Definitions and Assumptions
- 2. Executive Summary
- 2.1. Introduction
- 3. Market Dynamics
- 3.1. Introduction
- 3.2. Market Drivers
- 3.3. Market Restrains
- 3.4. Market Trends
- 4. Market Factor Analysis
- 4.1. Porters Five Forces
- 4.2. Supply/Value Chain
- 4.3. PESTEL analysis
- 4.4. Market Entropy
- 4.5. Patent/Trademark Analysis
- 5. Global SATA SSD Analysis, Insights and Forecast, 2019-2031
- 5.1. Market Analysis, Insights and Forecast - by Application
- 5.1.1. Individual Use
- 5.1.2. Commercial Use
- 5.2. Market Analysis, Insights and Forecast - by Types
- 5.2.1. 2.5-Inch Basic Drive
- 5.2.2. M.2 Drive
- 5.3. Market Analysis, Insights and Forecast - by Region
- 5.3.1. North America
- 5.3.2. South America
- 5.3.3. Europe
- 5.3.4. Middle East & Africa
- 5.3.5. Asia Pacific
- 5.1. Market Analysis, Insights and Forecast - by Application
- 6. North America SATA SSD Analysis, Insights and Forecast, 2019-2031
- 6.1. Market Analysis, Insights and Forecast - by Application
- 6.1.1. Individual Use
- 6.1.2. Commercial Use
- 6.2. Market Analysis, Insights and Forecast - by Types
- 6.2.1. 2.5-Inch Basic Drive
- 6.2.2. M.2 Drive
- 6.1. Market Analysis, Insights and Forecast - by Application
- 7. South America SATA SSD Analysis, Insights and Forecast, 2019-2031
- 7.1. Market Analysis, Insights and Forecast - by Application
- 7.1.1. Individual Use
- 7.1.2. Commercial Use
- 7.2. Market Analysis, Insights and Forecast - by Types
- 7.2.1. 2.5-Inch Basic Drive
- 7.2.2. M.2 Drive
- 7.1. Market Analysis, Insights and Forecast - by Application
- 8. Europe SATA SSD Analysis, Insights and Forecast, 2019-2031
- 8.1. Market Analysis, Insights and Forecast - by Application
- 8.1.1. Individual Use
- 8.1.2. Commercial Use
- 8.2. Market Analysis, Insights and Forecast - by Types
- 8.2.1. 2.5-Inch Basic Drive
- 8.2.2. M.2 Drive
- 8.1. Market Analysis, Insights and Forecast - by Application
- 9. Middle East & Africa SATA SSD Analysis, Insights and Forecast, 2019-2031
- 9.1. Market Analysis, Insights and Forecast - by Application
- 9.1.1. Individual Use
- 9.1.2. Commercial Use
- 9.2. Market Analysis, Insights and Forecast - by Types
- 9.2.1. 2.5-Inch Basic Drive
- 9.2.2. M.2 Drive
- 9.1. Market Analysis, Insights and Forecast - by Application
- 10. Asia Pacific SATA SSD Analysis, Insights and Forecast, 2019-2031
- 10.1. Market Analysis, Insights and Forecast - by Application
- 10.1.1. Individual Use
- 10.1.2. Commercial Use
- 10.2. Market Analysis, Insights and Forecast - by Types
- 10.2.1. 2.5-Inch Basic Drive
- 10.2.2. M.2 Drive
- 10.1. Market Analysis, Insights and Forecast - by Application
- 11. Competitive Analysis
- 11.1. Global Market Share Analysis 2024
- 11.2. Company Profiles
- 11.2.1 Samsung
- 11.2.1.1. Overview
- 11.2.1.2. Products
- 11.2.1.3. SWOT Analysis
- 11.2.1.4. Recent Developments
- 11.2.1.5. Financials (Based on Availability)
- 11.2.2 Kingston
- 11.2.2.1. Overview
- 11.2.2.2. Products
- 11.2.2.3. SWOT Analysis
- 11.2.2.4. Recent Developments
- 11.2.2.5. Financials (Based on Availability)
- 11.2.3 Western Digital
- 11.2.3.1. Overview
- 11.2.3.2. Products
- 11.2.3.3. SWOT Analysis
- 11.2.3.4. Recent Developments
- 11.2.3.5. Financials (Based on Availability)
- 11.2.4 SK Hynix
- 11.2.4.1. Overview
- 11.2.4.2. Products
- 11.2.4.3. SWOT Analysis
- 11.2.4.4. Recent Developments
- 11.2.4.5. Financials (Based on Availability)
- 11.2.5 Corsair
- 11.2.5.1. Overview
- 11.2.5.2. Products
- 11.2.5.3. SWOT Analysis
- 11.2.5.4. Recent Developments
- 11.2.5.5. Financials (Based on Availability)
- 11.2.6 Seagate Technology
- 11.2.6.1. Overview
- 11.2.6.2. Products
- 11.2.6.3. SWOT Analysis
- 11.2.6.4. Recent Developments
- 11.2.6.5. Financials (Based on Availability)
- 11.2.7 ADATA
- 11.2.7.1. Overview
- 11.2.7.2. Products
- 11.2.7.3. SWOT Analysis
- 11.2.7.4. Recent Developments
- 11.2.7.5. Financials (Based on Availability)
- 11.2.8 Micron Technology
- 11.2.8.1. Overview
- 11.2.8.2. Products
- 11.2.8.3. SWOT Analysis
- 11.2.8.4. Recent Developments
- 11.2.8.5. Financials (Based on Availability)
- 11.2.9 Gigabyte
- 11.2.9.1. Overview
- 11.2.9.2. Products
- 11.2.9.3. SWOT Analysis
- 11.2.9.4. Recent Developments
- 11.2.9.5. Financials (Based on Availability)
- 11.2.10 Sabrent
- 11.2.10.1. Overview
- 11.2.10.2. Products
- 11.2.10.3. SWOT Analysis
- 11.2.10.4. Recent Developments
- 11.2.10.5. Financials (Based on Availability)
- 11.2.1 Samsung
List of Figures
- Figure 1: Global SATA SSD Revenue Breakdown (million, %) by Region 2024 & 2032
- Figure 2: Global SATA SSD Volume Breakdown (K, %) by Region 2024 & 2032
- Figure 3: North America SATA SSD Revenue (million), by Application 2024 & 2032
- Figure 4: North America SATA SSD Volume (K), by Application 2024 & 2032
- Figure 5: North America SATA SSD Revenue Share (%), by Application 2024 & 2032
- Figure 6: North America SATA SSD Volume Share (%), by Application 2024 & 2032
- Figure 7: North America SATA SSD Revenue (million), by Types 2024 & 2032
- Figure 8: North America SATA SSD Volume (K), by Types 2024 & 2032
- Figure 9: North America SATA SSD Revenue Share (%), by Types 2024 & 2032
- Figure 10: North America SATA SSD Volume Share (%), by Types 2024 & 2032
- Figure 11: North America SATA SSD Revenue (million), by Country 2024 & 2032
- Figure 12: North America SATA SSD Volume (K), by Country 2024 & 2032
- Figure 13: North America SATA SSD Revenue Share (%), by Country 2024 & 2032
- Figure 14: North America SATA SSD Volume Share (%), by Country 2024 & 2032
- Figure 15: South America SATA SSD Revenue (million), by Application 2024 & 2032
- Figure 16: South America SATA SSD Volume (K), by Application 2024 & 2032
- Figure 17: South America SATA SSD Revenue Share (%), by Application 2024 & 2032
- Figure 18: South America SATA SSD Volume Share (%), by Application 2024 & 2032
- Figure 19: South America SATA SSD Revenue (million), by Types 2024 & 2032
- Figure 20: South America SATA SSD Volume (K), by Types 2024 & 2032
- Figure 21: South America SATA SSD Revenue Share (%), by Types 2024 & 2032
- Figure 22: South America SATA SSD Volume Share (%), by Types 2024 & 2032
- Figure 23: South America SATA SSD Revenue (million), by Country 2024 & 2032
- Figure 24: South America SATA SSD Volume (K), by Country 2024 & 2032
- Figure 25: South America SATA SSD Revenue Share (%), by Country 2024 & 2032
- Figure 26: South America SATA SSD Volume Share (%), by Country 2024 & 2032
- Figure 27: Europe SATA SSD Revenue (million), by Application 2024 & 2032
- Figure 28: Europe SATA SSD Volume (K), by Application 2024 & 2032
- Figure 29: Europe SATA SSD Revenue Share (%), by Application 2024 & 2032
- Figure 30: Europe SATA SSD Volume Share (%), by Application 2024 & 2032
- Figure 31: Europe SATA SSD Revenue (million), by Types 2024 & 2032
- Figure 32: Europe SATA SSD Volume (K), by Types 2024 & 2032
- Figure 33: Europe SATA SSD Revenue Share (%), by Types 2024 & 2032
- Figure 34: Europe SATA SSD Volume Share (%), by Types 2024 & 2032
- Figure 35: Europe SATA SSD Revenue (million), by Country 2024 & 2032
- Figure 36: Europe SATA SSD Volume (K), by Country 2024 & 2032
- Figure 37: Europe SATA SSD Revenue Share (%), by Country 2024 & 2032
- Figure 38: Europe SATA SSD Volume Share (%), by Country 2024 & 2032
- Figure 39: Middle East & Africa SATA SSD Revenue (million), by Application 2024 & 2032
- Figure 40: Middle East & Africa SATA SSD Volume (K), by Application 2024 & 2032
- Figure 41: Middle East & Africa SATA SSD Revenue Share (%), by Application 2024 & 2032
- Figure 42: Middle East & Africa SATA SSD Volume Share (%), by Application 2024 & 2032
- Figure 43: Middle East & Africa SATA SSD Revenue (million), by Types 2024 & 2032
- Figure 44: Middle East & Africa SATA SSD Volume (K), by Types 2024 & 2032
- Figure 45: Middle East & Africa SATA SSD Revenue Share (%), by Types 2024 & 2032
- Figure 46: Middle East & Africa SATA SSD Volume Share (%), by Types 2024 & 2032
- Figure 47: Middle East & Africa SATA SSD Revenue (million), by Country 2024 & 2032
- Figure 48: Middle East & Africa SATA SSD Volume (K), by Country 2024 & 2032
- Figure 49: Middle East & Africa SATA SSD Revenue Share (%), by Country 2024 & 2032
- Figure 50: Middle East & Africa SATA SSD Volume Share (%), by Country 2024 & 2032
- Figure 51: Asia Pacific SATA SSD Revenue (million), by Application 2024 & 2032
- Figure 52: Asia Pacific SATA SSD Volume (K), by Application 2024 & 2032
- Figure 53: Asia Pacific SATA SSD Revenue Share (%), by Application 2024 & 2032
- Figure 54: Asia Pacific SATA SSD Volume Share (%), by Application 2024 & 2032
- Figure 55: Asia Pacific SATA SSD Revenue (million), by Types 2024 & 2032
- Figure 56: Asia Pacific SATA SSD Volume (K), by Types 2024 & 2032
- Figure 57: Asia Pacific SATA SSD Revenue Share (%), by Types 2024 & 2032
- Figure 58: Asia Pacific SATA SSD Volume Share (%), by Types 2024 & 2032
- Figure 59: Asia Pacific SATA SSD Revenue (million), by Country 2024 & 2032
- Figure 60: Asia Pacific SATA SSD Volume (K), by Country 2024 & 2032
- Figure 61: Asia Pacific SATA SSD Revenue Share (%), by Country 2024 & 2032
- Figure 62: Asia Pacific SATA SSD Volume Share (%), by Country 2024 & 2032
List of Tables
- Table 1: Global SATA SSD Revenue million Forecast, by Region 2019 & 2032
- Table 2: Global SATA SSD Volume K Forecast, by Region 2019 & 2032
- Table 3: Global SATA SSD Revenue million Forecast, by Application 2019 & 2032
- Table 4: Global SATA SSD Volume K Forecast, by Application 2019 & 2032
- Table 5: Global SATA SSD Revenue million Forecast, by Types 2019 & 2032
- Table 6: Global SATA SSD Volume K Forecast, by Types 2019 & 2032
- Table 7: Global SATA SSD Revenue million Forecast, by Region 2019 & 2032
- Table 8: Global SATA SSD Volume K Forecast, by Region 2019 & 2032
- Table 9: Global SATA SSD Revenue million Forecast, by Application 2019 & 2032
- Table 10: Global SATA SSD Volume K Forecast, by Application 2019 & 2032
- Table 11: Global SATA SSD Revenue million Forecast, by Types 2019 & 2032
- Table 12: Global SATA SSD Volume K Forecast, by Types 2019 & 2032
- Table 13: Global SATA SSD Revenue million Forecast, by Country 2019 & 2032
- Table 14: Global SATA SSD Volume K Forecast, by Country 2019 & 2032
- Table 15: United States SATA SSD Revenue (million) Forecast, by Application 2019 & 2032
- Table 16: United States SATA SSD Volume (K) Forecast, by Application 2019 & 2032
- Table 17: Canada SATA SSD Revenue (million) Forecast, by Application 2019 & 2032
- Table 18: Canada SATA SSD Volume (K) Forecast, by Application 2019 & 2032
- Table 19: Mexico SATA SSD Revenue (million) Forecast, by Application 2019 & 2032
- Table 20: Mexico SATA SSD Volume (K) Forecast, by Application 2019 & 2032
- Table 21: Global SATA SSD Revenue million Forecast, by Application 2019 & 2032
- Table 22: Global SATA SSD Volume K Forecast, by Application 2019 & 2032
- Table 23: Global SATA SSD Revenue million Forecast, by Types 2019 & 2032
- Table 24: Global SATA SSD Volume K Forecast, by Types 2019 & 2032
- Table 25: Global SATA SSD Revenue million Forecast, by Country 2019 & 2032
- Table 26: Global SATA SSD Volume K Forecast, by Country 2019 & 2032
- Table 27: Brazil SATA SSD Revenue (million) Forecast, by Application 2019 & 2032
- Table 28: Brazil SATA SSD Volume (K) Forecast, by Application 2019 & 2032
- Table 29: Argentina SATA SSD Revenue (million) Forecast, by Application 2019 & 2032
- Table 30: Argentina SATA SSD Volume (K) Forecast, by Application 2019 & 2032
- Table 31: Rest of South America SATA SSD Revenue (million) Forecast, by Application 2019 & 2032
- Table 32: Rest of South America SATA SSD Volume (K) Forecast, by Application 2019 & 2032
- Table 33: Global SATA SSD Revenue million Forecast, by Application 2019 & 2032
- Table 34: Global SATA SSD Volume K Forecast, by Application 2019 & 2032
- Table 35: Global SATA SSD Revenue million Forecast, by Types 2019 & 2032
- Table 36: Global SATA SSD Volume K Forecast, by Types 2019 & 2032
- Table 37: Global SATA SSD Revenue million Forecast, by Country 2019 & 2032
- Table 38: Global SATA SSD Volume K Forecast, by Country 2019 & 2032
- Table 39: United Kingdom SATA SSD Revenue (million) Forecast, by Application 2019 & 2032
- Table 40: United Kingdom SATA SSD Volume (K) Forecast, by Application 2019 & 2032
- Table 41: Germany SATA SSD Revenue (million) Forecast, by Application 2019 & 2032
- Table 42: Germany SATA SSD Volume (K) Forecast, by Application 2019 & 2032
- Table 43: France SATA SSD Revenue (million) Forecast, by Application 2019 & 2032
- Table 44: France SATA SSD Volume (K) Forecast, by Application 2019 & 2032
- Table 45: Italy SATA SSD Revenue (million) Forecast, by Application 2019 & 2032
- Table 46: Italy SATA SSD Volume (K) Forecast, by Application 2019 & 2032
- Table 47: Spain SATA SSD Revenue (million) Forecast, by Application 2019 & 2032
- Table 48: Spain SATA SSD Volume (K) Forecast, by Application 2019 & 2032
- Table 49: Russia SATA SSD Revenue (million) Forecast, by Application 2019 & 2032
- Table 50: Russia SATA SSD Volume (K) Forecast, by Application 2019 & 2032
- Table 51: Benelux SATA SSD Revenue (million) Forecast, by Application 2019 & 2032
- Table 52: Benelux SATA SSD Volume (K) Forecast, by Application 2019 & 2032
- Table 53: Nordics SATA SSD Revenue (million) Forecast, by Application 2019 & 2032
- Table 54: Nordics SATA SSD Volume (K) Forecast, by Application 2019 & 2032
- Table 55: Rest of Europe SATA SSD Revenue (million) Forecast, by Application 2019 & 2032
- Table 56: Rest of Europe SATA SSD Volume (K) Forecast, by Application 2019 & 2032
- Table 57: Global SATA SSD Revenue million Forecast, by Application 2019 & 2032
- Table 58: Global SATA SSD Volume K Forecast, by Application 2019 & 2032
- Table 59: Global SATA SSD Revenue million Forecast, by Types 2019 & 2032
- Table 60: Global SATA SSD Volume K Forecast, by Types 2019 & 2032
- Table 61: Global SATA SSD Revenue million Forecast, by Country 2019 & 2032
- Table 62: Global SATA SSD Volume K Forecast, by Country 2019 & 2032
- Table 63: Turkey SATA SSD Revenue (million) Forecast, by Application 2019 & 2032
- Table 64: Turkey SATA SSD Volume (K) Forecast, by Application 2019 & 2032
- Table 65: Israel SATA SSD Revenue (million) Forecast, by Application 2019 & 2032
- Table 66: Israel SATA SSD Volume (K) Forecast, by Application 2019 & 2032
- Table 67: GCC SATA SSD Revenue (million) Forecast, by Application 2019 & 2032
- Table 68: GCC SATA SSD Volume (K) Forecast, by Application 2019 & 2032
- Table 69: North Africa SATA SSD Revenue (million) Forecast, by Application 2019 & 2032
- Table 70: North Africa SATA SSD Volume (K) Forecast, by Application 2019 & 2032
- Table 71: South Africa SATA SSD Revenue (million) Forecast, by Application 2019 & 2032
- Table 72: South Africa SATA SSD Volume (K) Forecast, by Application 2019 & 2032
- Table 73: Rest of Middle East & Africa SATA SSD Revenue (million) Forecast, by Application 2019 & 2032
- Table 74: Rest of Middle East & Africa SATA SSD Volume (K) Forecast, by Application 2019 & 2032
- Table 75: Global SATA SSD Revenue million Forecast, by Application 2019 & 2032
- Table 76: Global SATA SSD Volume K Forecast, by Application 2019 & 2032
- Table 77: Global SATA SSD Revenue million Forecast, by Types 2019 & 2032
- Table 78: Global SATA SSD Volume K Forecast, by Types 2019 & 2032
- Table 79: Global SATA SSD Revenue million Forecast, by Country 2019 & 2032
- Table 80: Global SATA SSD Volume K Forecast, by Country 2019 & 2032
- Table 81: China SATA SSD Revenue (million) Forecast, by Application 2019 & 2032
- Table 82: China SATA SSD Volume (K) Forecast, by Application 2019 & 2032
- Table 83: India SATA SSD Revenue (million) Forecast, by Application 2019 & 2032
- Table 84: India SATA SSD Volume (K) Forecast, by Application 2019 & 2032
- Table 85: Japan SATA SSD Revenue (million) Forecast, by Application 2019 & 2032
- Table 86: Japan SATA SSD Volume (K) Forecast, by Application 2019 & 2032
- Table 87: South Korea SATA SSD Revenue (million) Forecast, by Application 2019 & 2032
- Table 88: South Korea SATA SSD Volume (K) Forecast, by Application 2019 & 2032
- Table 89: ASEAN SATA SSD Revenue (million) Forecast, by Application 2019 & 2032
- Table 90: ASEAN SATA SSD Volume (K) Forecast, by Application 2019 & 2032
- Table 91: Oceania SATA SSD Revenue (million) Forecast, by Application 2019 & 2032
- Table 92: Oceania SATA SSD Volume (K) Forecast, by Application 2019 & 2032
- Table 93: Rest of Asia Pacific SATA SSD Revenue (million) Forecast, by Application 2019 & 2032
- Table 94: Rest of Asia Pacific SATA SSD Volume (K) Forecast, by Application 2019 & 2032
Frequently Asked Questions
1. What is the projected Compound Annual Growth Rate (CAGR) of the SATA SSD?
The projected CAGR is approximately XX%.
2. Which companies are prominent players in the SATA SSD?
Key companies in the market include Samsung, Kingston, Western Digital, SK Hynix, Corsair, Seagate Technology, ADATA, Micron Technology, Gigabyte, Sabrent.
3. What are the main segments of the SATA SSD?
The market segments include Application, Types.
4. Can you provide details about the market size?
The market size is estimated to be USD XXX million as of 2022.
5. What are some drivers contributing to market growth?
N/A
6. What are the notable trends driving market growth?
N/A
7. Are there any restraints impacting market growth?
N/A
8. Can you provide examples of recent developments in the market?
N/A
9. What pricing options are available for accessing the report?
Pricing options include single-user, multi-user, and enterprise licenses priced at USD 3950.00, USD 5925.00, and USD 7900.00 respectively.
10. Is the market size provided in terms of value or volume?
The market size is provided in terms of value, measured in million and volume, measured in K.
11. Are there any specific market keywords associated with the report?
Yes, the market keyword associated with the report is "SATA SSD," which aids in identifying and referencing the specific market segment covered.
12. How do I determine which pricing option suits my needs best?
The pricing options vary based on user requirements and access needs. Individual users may opt for single-user licenses, while businesses requiring broader access may choose multi-user or enterprise licenses for cost-effective access to the report.
13. Are there any additional resources or data provided in the SATA SSD report?
While the report offers comprehensive insights, it's advisable to review the specific contents or supplementary materials provided to ascertain if additional resources or data are available.
14. How can I stay updated on further developments or reports in the SATA SSD?
To stay informed about further developments, trends, and reports in the SATA SSD, consider subscribing to industry newsletters, following relevant companies and organizations, or regularly checking reputable industry news sources and publications.
Methodology
Step 1 - Identification of Relevant Samples Size from Population Database


Step 2 - Approaches for Defining Global Market Size (Value, Volume* & Price*)

Note*: In applicable scenarios
Step 3 - Data Sources
Primary Research
- Web Analytics
- Survey Reports
- Research Institute
- Latest Research Reports
- Opinion Leaders
Secondary Research
- Annual Reports
- White Paper
- Latest Press Release
- Industry Association
- Paid Database
- Investor Presentations

Step 4 - Data Triangulation
Involves using different sources of information in order to increase the validity of a study
These sources are likely to be stakeholders in a program - participants, other researchers, program staff, other community members, and so on.
Then we put all data in single framework & apply various statistical tools to find out the dynamic on the market.
During the analysis stage, feedback from the stakeholder groups would be compared to determine areas of agreement as well as areas of divergence


