
Key Insights
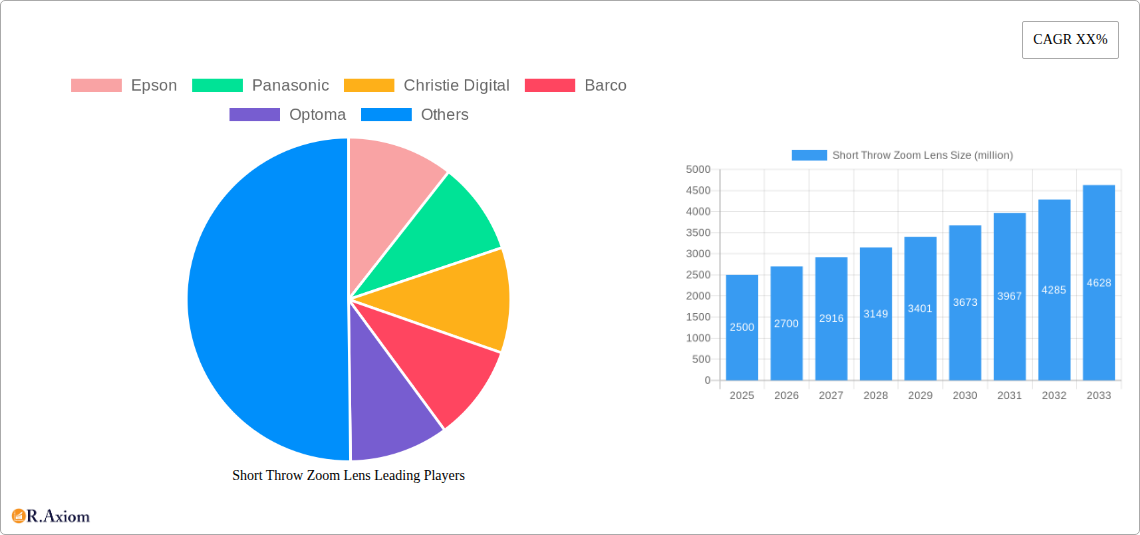
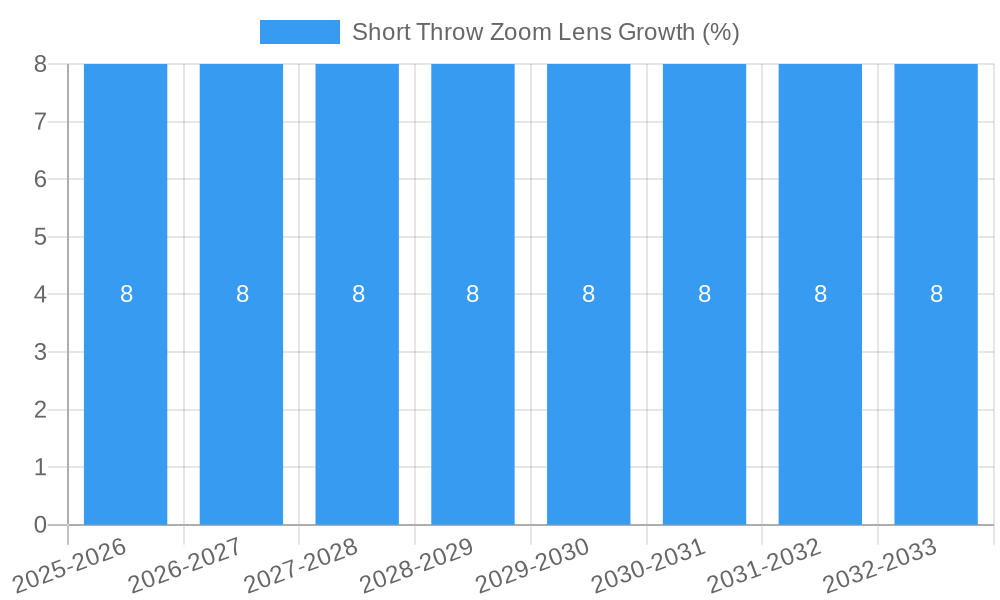
The global Short Throw Zoom Lens market is poised for significant expansion, projected to reach an estimated market size of approximately $2,500 million by 2025, with a robust Compound Annual Growth Rate (CAGR) of around 8%. This upward trajectory is primarily fueled by the escalating demand for immersive visual experiences across various sectors, including education, corporate settings, and home entertainment. The increasing adoption of interactive whiteboards and digital signage, coupled with the growing popularity of large-screen presentations in classrooms and boardrooms, are key drivers. Furthermore, advancements in lens technology, leading to improved image quality, reduced distortion, and enhanced flexibility in projection distances, are contributing to market growth. The convenience of short throw lenses, enabling large image projection in confined spaces, makes them an attractive alternative to traditional long throw projectors, especially in environments where space optimization is crucial.
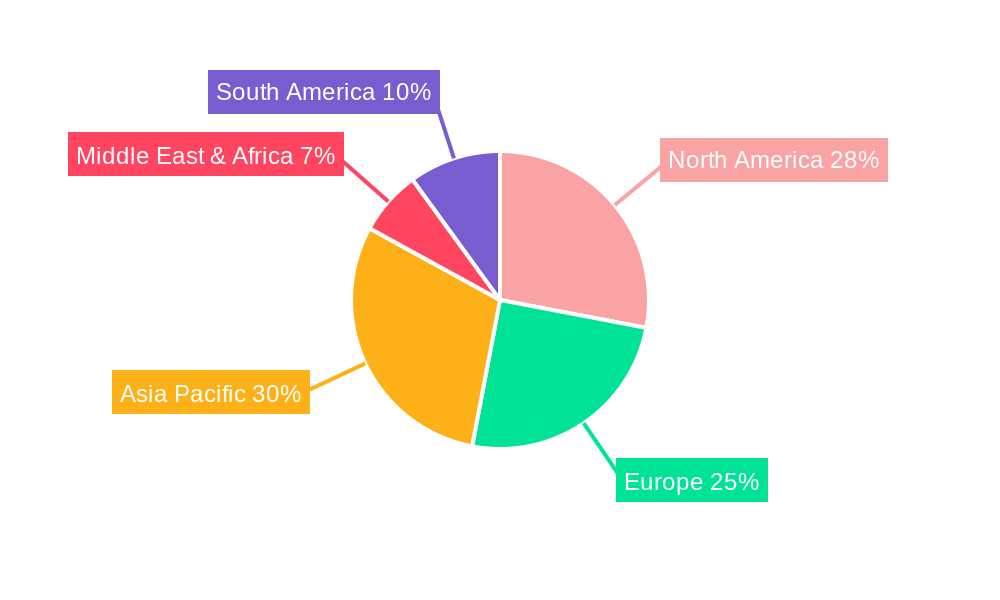
The market's expansion is further bolstered by emerging trends such as the integration of short throw zoom lenses with smart technologies, enabling wireless connectivity and advanced control features. The "Other" application segment, encompassing areas like medical imaging and simulation, is also expected to witness steady growth. However, the market faces certain restraints, including the relatively higher initial cost compared to standard lenses and the need for specialized installation and calibration in some applications. Despite these challenges, the persistent demand for dynamic and flexible projection solutions, driven by innovation and evolving user expectations, positions the Short Throw Zoom Lens market for sustained and substantial growth in the coming years, with significant opportunities in the Asia Pacific and North America regions.
Short Throw Zoom Lens Market Concentration & Innovation
The global short throw zoom lens market is characterized by a moderate level of concentration, with key players such as Epson, Panasonic, Christie Digital, Barco, Optoma, Mitsubishi, Sony, Hitachi, and NEC actively shaping its trajectory. Innovation serves as a primary driver, fueled by advancements in optical engineering, miniaturization, and enhanced image processing capabilities designed to deliver superior visual experiences in confined spaces. Regulatory frameworks, while generally supportive of technological advancement, may involve compliance with safety and environmental standards. Product substitutes, though present in the form of standard throw lenses and alternative display technologies, are increasingly challenged by the unique advantages offered by short throw zoom lenses in specific applications. End-user trends lean towards demand for immersive, flexible, and user-friendly display solutions in both commercial and residential settings. Mergers and acquisitions (M&A) activities are anticipated to play a role in market consolidation, with estimated M&A deal values projected to reach several million in the coming years as companies seek to expand their technological portfolios and market reach. The market share of leading companies is dynamic, influenced by product innovation and strategic partnerships.
Short Throw Zoom Lens Industry Trends & Insights
The short throw zoom lens market is experiencing robust growth, driven by a confluence of technological advancements, evolving consumer preferences, and expanding application areas. The projected Compound Annual Growth Rate (CAGR) for the forecast period (2025–2033) is estimated to be between 8% and 12%, indicating significant market expansion. A key trend is the increasing demand for ultra-short throw (UST) lenses, which can project large images from mere inches away from the screen. This has been propelled by the rise of home entertainment systems, where UST projectors are replacing traditional TVs, offering larger screen sizes and a more cinematic experience. In commercial sectors, the adoption of short throw zoom lenses is escalating in areas like corporate boardrooms, classrooms, and retail environments, where space constraints make standard projectors impractical. Technological disruptions, including the integration of laser light sources for brighter and more energy-efficient projection, as well as advancements in lens coatings for reduced glare and improved color accuracy, are enhancing product performance and appeal. Consumer preferences are shifting towards convenience, portability, and integrated smart features, pushing manufacturers to develop all-in-one projection solutions. The competitive landscape is intensifying, with companies continuously investing in research and development to offer lenses with higher resolution, improved contrast ratios, and wider zoom ranges. Market penetration is expected to rise significantly across both developed and emerging economies as the cost-effectiveness and performance benefits of short throw zoom projectors become more widely recognized. The integration of AI-powered features for automatic image correction and content optimization is also a nascent but promising development. The report estimates the market size to reach several hundred million by the base year of 2025, with substantial growth projected through 2033.
Dominant Markets & Segments in Short Throw Zoom Lens
The global short throw zoom lens market exhibits dominance in specific regions and segments, primarily driven by economic policies, infrastructure development, and consumer adoption rates.
Dominant Region: North America
North America, particularly the United States, stands out as a leading market for short throw zoom lenses.
- Economic Policies: Favorable economic conditions and high disposable incomes allow for greater investment in advanced home entertainment systems and corporate audiovisual solutions.
- Infrastructure Development: Extensive commercial and educational infrastructure, coupled with a rapid pace of digital transformation in businesses, fuels demand for immersive display technologies.
- Consumer Preferences: A strong appetite for cutting-edge technology and home entertainment drives the adoption of UST projectors for a premium viewing experience.
Dominant Country: United States
Within North America, the United States holds a significant share due to its advanced technological landscape and early adoption of new display solutions.
- Technological Adoption: The US market readily embraces innovative products, including the latest in projector technology, for both personal and professional use.
- Market Size: The sheer size of the consumer and enterprise markets translates into substantial demand for short throw zoom lenses.
Dominant Application Segment: Projectors
The "Projectors" application segment is the undisputed leader, encompassing the vast majority of short throw zoom lens demand.
- Home Entertainment: The burgeoning home cinema market, with its emphasis on large screen sizes and immersive experiences, is a primary growth engine. Short throw zoom lenses enable users to achieve cinematic visuals in standard living rooms.
- Education: K-12 schools and higher education institutions are increasingly equipping classrooms with interactive whiteboards and projectors that utilize short throw zoom lenses for improved engagement and collaboration.
- Corporate and Business: Meeting rooms, conference halls, and digital signage applications in the corporate sector are major consumers of short throw zoom lenses due to their space-saving capabilities and ability to present information clearly in well-lit environments.
Dominant Type Segment: Throw Ratio Above 1:1
While ultra-short throw (below 1:1) lenses are gaining traction, the "Throw Ratio Above 1:1" segment, which includes standard short throw lenses, currently holds a substantial market share.
- Versatility: Lenses with throw ratios above 1:1 offer a good balance between projection distance and image size, making them suitable for a wider range of room dimensions and installation scenarios.
- Cost-Effectiveness: In many instances, these lenses can offer a more cost-effective solution compared to extreme UST options, appealing to a broader customer base.
- Established Market: This segment benefits from a more established product ecosystem and a longer history of adoption in various professional settings.
However, the "Throw Ratio Below 1:1" segment is projected to experience the highest growth rate due to its unique ability to overcome space limitations in innovative ways.
Short Throw Zoom Lens Product Developments
Product developments in the short throw zoom lens market are focused on enhancing optical performance, reducing form factors, and integrating advanced features. Manufacturers are continuously innovating to achieve higher brightness levels (measured in lumens, often in the tens of thousands), improved contrast ratios (exceeding 50,000:1), and wider color gamuts for more vibrant and lifelike images. The integration of laser light sources is a significant trend, offering longer lifespan and greater energy efficiency compared to traditional lamp-based projectors. Miniaturization efforts are leading to more compact and aesthetically pleasing designs, making them ideal for discreet installations in homes and offices. Furthermore, advancements in autofocus and auto-keystone correction technologies are simplifying setup and calibration. These innovations aim to provide competitive advantages by offering superior viewing experiences, increased convenience, and greater flexibility in a wide array of applications, from immersive home theaters to dynamic digital signage.
Report Scope & Segmentation Analysis
This report comprehensively analyzes the short throw zoom lens market, segmenting it to provide granular insights. The "Application" segmentation divides the market into "Projectors" and "Other" categories, with "Projectors" being the primary focus due to its overwhelming market share. The "Types" segmentation categorizes lenses by their "Throw Ratio Above 1:1" and "Throw Ratio Below 1:1."
Application: Projectors
This segment is projected to witness consistent growth throughout the forecast period (2025–2033), with market sizes estimated to reach several hundred million by 2025. Key growth drivers include increasing adoption in home entertainment, education, and corporate environments. Competitive dynamics are fierce, with leading players like Epson and Panasonic vying for market share through continuous innovation and strategic partnerships.
Application: Other
The "Other" application segment, encompassing niche applications like specialized industrial equipment or scientific instrumentation, is expected to see moderate but steady growth. Its market size is considerably smaller but offers potential for specialized development and higher-margin products. Competitive dynamics in this segment are often characterized by specialized manufacturers catering to specific industry needs.
Types: Throw Ratio Above 1:1
This segment represents a mature but significant portion of the market. Growth projections are steady, driven by the widespread use of standard short throw projectors in diverse settings. Market sizes are substantial, and competitive dynamics involve established brands offering reliable and cost-effective solutions.
Types: Throw Ratio Below 1:1
This segment, particularly ultra-short throw (UST) lenses, is anticipated to exhibit the highest growth rate. Market sizes are rapidly expanding as consumers and businesses increasingly seek solutions for space-constrained environments. Competitive dynamics are highly innovative, with manufacturers pushing the boundaries of lens technology to offer unprecedented proximity projection capabilities.
Key Drivers of Short Throw Zoom Lens Growth
The short throw zoom lens market is propelled by several interconnected factors. Technological advancements, including the miniaturization of optical components, the development of advanced lens coatings for superior image quality, and the integration of laser light sources for increased brightness and lifespan, are fundamental drivers. Economic factors, such as rising disposable incomes and increased spending on home entertainment and business infrastructure, significantly boost demand. Furthermore, the growing trend towards flexible workspaces and interactive learning environments in both corporate and educational sectors necessitates the adoption of space-saving projection solutions. Regulatory frameworks that promote technological innovation and energy efficiency also play a supportive role. The increasing need for immersive visual experiences in diverse applications, from gaming and home cinema to digital signage and augmented reality, further fuels market expansion.
Challenges in the Short Throw Zoom Lens Sector
Despite robust growth, the short throw zoom lens sector faces several challenges. High manufacturing costs associated with precision optics and advanced materials can lead to premium pricing, potentially limiting adoption in price-sensitive markets. Intense competition among established players and emerging manufacturers exerts pressure on profit margins and necessitates continuous innovation to maintain market share. Supply chain disruptions, as witnessed in recent years, can impact the availability of essential components and lead to production delays. Furthermore, technological obsolescence is a constant threat, requiring significant R&D investments to stay ahead of the curve. The increasing prevalence of alternative display technologies, such as large-format OLED and MicroLED displays, poses a competitive challenge, particularly in premium home entertainment segments. Calibration complexities for some advanced features can also deter less tech-savvy users.
Emerging Opportunities in Short Throw Zoom Lens
Emerging opportunities for short throw zoom lenses are abundant, driven by evolving market needs and technological breakthroughs. The growing demand for interactive projectors that combine touch capabilities with short throw projection presents a significant avenue for growth, particularly in educational and collaborative environments. The expansion of the home entertainment market, fueled by streaming services and a desire for cinematic experiences at home, continues to be a key opportunity, especially with the rise of UST projectors. In the commercial sector, the increasing adoption of digital signage and experiential retail displays creates demand for compact and versatile projection solutions. The development of AI-powered features for automatic image adjustment, content enhancement, and smart integration offers a pathway to create more user-friendly and intelligent projection systems. Emerging economies, with their rapidly developing infrastructure and growing middle class, represent untapped markets with substantial growth potential. The integration of short throw zoom lenses into all-in-one entertainment systems and smart home devices also presents an attractive opportunity for product diversification.
Leading Players in the Short Throw Zoom Lens Market
- Epson
- Panasonic
- Christie Digital
- Barco
- Optoma
- Mitsubishi
- Sony
- Hitachi
- NEC
Key Developments in Short Throw Zoom Lens Industry
- 2023/08: Epson launches new series of ultra-short throw laser projectors with enhanced brightness and resolution for home entertainment.
- 2023/05: Panasonic unveils innovative short throw lens technology enabling wider zoom ranges and improved image clarity.
- 2022/11: Christie Digital announces strategic partnership to integrate advanced optics into their commercial projection solutions.
- 2022/07: Barco introduces a new line of short throw projectors optimized for immersive virtual reality experiences.
- 2022/03: Optoma releases a compact, portable short throw projector with smart features for on-the-go presentations.
- 2021/10: Mitsubishi Electric showcases advancements in lens aberration correction for sharper image projection.
- 2021/06: Sony patents new lens design for improved light efficiency in short throw projectors.
- 2020/09: Hitachi introduces a short throw projector with enhanced sustainability features and extended lamp life.
- 2020/04: NEC enhances its short throw projector lineup with improved connectivity options for seamless integration.
Strategic Outlook for Short Throw Zoom Lens Market
The strategic outlook for the short throw zoom lens market remains highly positive, characterized by sustained innovation and expanding application horizons. The increasing consumer preference for large-screen, immersive visual experiences, coupled with the growing demand for flexible and space-efficient display solutions in professional environments, will continue to be major growth catalysts. Manufacturers are strategically focusing on developing ultra-short throw (UST) lenses that offer unparalleled proximity projection, addressing space constraints in urban living and compact office spaces. Furthermore, the integration of advanced technologies such as laser light sources, AI-powered image optimization, and enhanced connectivity will be crucial for maintaining a competitive edge. Strategic partnerships and potential M&A activities are also anticipated to shape the market landscape, enabling companies to consolidate market share, acquire new technologies, and expand their geographical reach. The growing emphasis on sustainability and energy efficiency within product development will also present opportunities for differentiation. Overall, the market is poised for significant growth, driven by technological prowess and a keen understanding of evolving end-user demands.
Short Throw Zoom Lens Segmentation
-
1. Application
- 1.1. Projectors
- 1.2. Other
-
2. Types
- 2.1. Throw Ratio Above 1:1
- 2.2. Throw Ratio Below 1:1
Short Throw Zoom Lens Segmentation By Geography
-
1. North America
- 1.1. United States
- 1.2. Canada
- 1.3. Mexico
-
2. South America
- 2.1. Brazil
- 2.2. Argentina
- 2.3. Rest of South America
-
3. Europe
- 3.1. United Kingdom
- 3.2. Germany
- 3.3. France
- 3.4. Italy
- 3.5. Spain
- 3.6. Russia
- 3.7. Benelux
- 3.8. Nordics
- 3.9. Rest of Europe
-
4. Middle East & Africa
- 4.1. Turkey
- 4.2. Israel
- 4.3. GCC
- 4.4. North Africa
- 4.5. South Africa
- 4.6. Rest of Middle East & Africa
-
5. Asia Pacific
- 5.1. China
- 5.2. India
- 5.3. Japan
- 5.4. South Korea
- 5.5. ASEAN
- 5.6. Oceania
- 5.7. Rest of Asia Pacific
Short Throw Zoom Lens REPORT HIGHLIGHTS
| Aspects | Details |
|---|---|
| Study Period | 2019-2033 |
| Base Year | 2024 |
| Estimated Year | 2025 |
| Forecast Period | 2025-2033 |
| Historical Period | 2019-2024 |
| Growth Rate | CAGR of XX% from 2019-2033 |
| Segmentation |
|
Table of Contents
- 1. Introduction
- 1.1. Research Scope
- 1.2. Market Segmentation
- 1.3. Research Methodology
- 1.4. Definitions and Assumptions
- 2. Executive Summary
- 2.1. Introduction
- 3. Market Dynamics
- 3.1. Introduction
- 3.2. Market Drivers
- 3.3. Market Restrains
- 3.4. Market Trends
- 4. Market Factor Analysis
- 4.1. Porters Five Forces
- 4.2. Supply/Value Chain
- 4.3. PESTEL analysis
- 4.4. Market Entropy
- 4.5. Patent/Trademark Analysis
- 5. Global Short Throw Zoom Lens Analysis, Insights and Forecast, 2019-2031
- 5.1. Market Analysis, Insights and Forecast - by Application
- 5.1.1. Projectors
- 5.1.2. Other
- 5.2. Market Analysis, Insights and Forecast - by Types
- 5.2.1. Throw Ratio Above 1:1
- 5.2.2. Throw Ratio Below 1:1
- 5.3. Market Analysis, Insights and Forecast - by Region
- 5.3.1. North America
- 5.3.2. South America
- 5.3.3. Europe
- 5.3.4. Middle East & Africa
- 5.3.5. Asia Pacific
- 5.1. Market Analysis, Insights and Forecast - by Application
- 6. North America Short Throw Zoom Lens Analysis, Insights and Forecast, 2019-2031
- 6.1. Market Analysis, Insights and Forecast - by Application
- 6.1.1. Projectors
- 6.1.2. Other
- 6.2. Market Analysis, Insights and Forecast - by Types
- 6.2.1. Throw Ratio Above 1:1
- 6.2.2. Throw Ratio Below 1:1
- 6.1. Market Analysis, Insights and Forecast - by Application
- 7. South America Short Throw Zoom Lens Analysis, Insights and Forecast, 2019-2031
- 7.1. Market Analysis, Insights and Forecast - by Application
- 7.1.1. Projectors
- 7.1.2. Other
- 7.2. Market Analysis, Insights and Forecast - by Types
- 7.2.1. Throw Ratio Above 1:1
- 7.2.2. Throw Ratio Below 1:1
- 7.1. Market Analysis, Insights and Forecast - by Application
- 8. Europe Short Throw Zoom Lens Analysis, Insights and Forecast, 2019-2031
- 8.1. Market Analysis, Insights and Forecast - by Application
- 8.1.1. Projectors
- 8.1.2. Other
- 8.2. Market Analysis, Insights and Forecast - by Types
- 8.2.1. Throw Ratio Above 1:1
- 8.2.2. Throw Ratio Below 1:1
- 8.1. Market Analysis, Insights and Forecast - by Application
- 9. Middle East & Africa Short Throw Zoom Lens Analysis, Insights and Forecast, 2019-2031
- 9.1. Market Analysis, Insights and Forecast - by Application
- 9.1.1. Projectors
- 9.1.2. Other
- 9.2. Market Analysis, Insights and Forecast - by Types
- 9.2.1. Throw Ratio Above 1:1
- 9.2.2. Throw Ratio Below 1:1
- 9.1. Market Analysis, Insights and Forecast - by Application
- 10. Asia Pacific Short Throw Zoom Lens Analysis, Insights and Forecast, 2019-2031
- 10.1. Market Analysis, Insights and Forecast - by Application
- 10.1.1. Projectors
- 10.1.2. Other
- 10.2. Market Analysis, Insights and Forecast - by Types
- 10.2.1. Throw Ratio Above 1:1
- 10.2.2. Throw Ratio Below 1:1
- 10.1. Market Analysis, Insights and Forecast - by Application
- 11. Competitive Analysis
- 11.1. Global Market Share Analysis 2024
- 11.2. Company Profiles
- 11.2.1 Epson
- 11.2.1.1. Overview
- 11.2.1.2. Products
- 11.2.1.3. SWOT Analysis
- 11.2.1.4. Recent Developments
- 11.2.1.5. Financials (Based on Availability)
- 11.2.2 Panasonic
- 11.2.2.1. Overview
- 11.2.2.2. Products
- 11.2.2.3. SWOT Analysis
- 11.2.2.4. Recent Developments
- 11.2.2.5. Financials (Based on Availability)
- 11.2.3 Christie Digital
- 11.2.3.1. Overview
- 11.2.3.2. Products
- 11.2.3.3. SWOT Analysis
- 11.2.3.4. Recent Developments
- 11.2.3.5. Financials (Based on Availability)
- 11.2.4 Barco
- 11.2.4.1. Overview
- 11.2.4.2. Products
- 11.2.4.3. SWOT Analysis
- 11.2.4.4. Recent Developments
- 11.2.4.5. Financials (Based on Availability)
- 11.2.5 Optoma
- 11.2.5.1. Overview
- 11.2.5.2. Products
- 11.2.5.3. SWOT Analysis
- 11.2.5.4. Recent Developments
- 11.2.5.5. Financials (Based on Availability)
- 11.2.6 Mitsubishi
- 11.2.6.1. Overview
- 11.2.6.2. Products
- 11.2.6.3. SWOT Analysis
- 11.2.6.4. Recent Developments
- 11.2.6.5. Financials (Based on Availability)
- 11.2.7 Sony
- 11.2.7.1. Overview
- 11.2.7.2. Products
- 11.2.7.3. SWOT Analysis
- 11.2.7.4. Recent Developments
- 11.2.7.5. Financials (Based on Availability)
- 11.2.8 Hitachi
- 11.2.8.1. Overview
- 11.2.8.2. Products
- 11.2.8.3. SWOT Analysis
- 11.2.8.4. Recent Developments
- 11.2.8.5. Financials (Based on Availability)
- 11.2.9 NEC
- 11.2.9.1. Overview
- 11.2.9.2. Products
- 11.2.9.3. SWOT Analysis
- 11.2.9.4. Recent Developments
- 11.2.9.5. Financials (Based on Availability)
- 11.2.1 Epson
List of Figures
- Figure 1: Global Short Throw Zoom Lens Revenue Breakdown (million, %) by Region 2024 & 2032
- Figure 2: North America Short Throw Zoom Lens Revenue (million), by Application 2024 & 2032
- Figure 3: North America Short Throw Zoom Lens Revenue Share (%), by Application 2024 & 2032
- Figure 4: North America Short Throw Zoom Lens Revenue (million), by Types 2024 & 2032
- Figure 5: North America Short Throw Zoom Lens Revenue Share (%), by Types 2024 & 2032
- Figure 6: North America Short Throw Zoom Lens Revenue (million), by Country 2024 & 2032
- Figure 7: North America Short Throw Zoom Lens Revenue Share (%), by Country 2024 & 2032
- Figure 8: South America Short Throw Zoom Lens Revenue (million), by Application 2024 & 2032
- Figure 9: South America Short Throw Zoom Lens Revenue Share (%), by Application 2024 & 2032
- Figure 10: South America Short Throw Zoom Lens Revenue (million), by Types 2024 & 2032
- Figure 11: South America Short Throw Zoom Lens Revenue Share (%), by Types 2024 & 2032
- Figure 12: South America Short Throw Zoom Lens Revenue (million), by Country 2024 & 2032
- Figure 13: South America Short Throw Zoom Lens Revenue Share (%), by Country 2024 & 2032
- Figure 14: Europe Short Throw Zoom Lens Revenue (million), by Application 2024 & 2032
- Figure 15: Europe Short Throw Zoom Lens Revenue Share (%), by Application 2024 & 2032
- Figure 16: Europe Short Throw Zoom Lens Revenue (million), by Types 2024 & 2032
- Figure 17: Europe Short Throw Zoom Lens Revenue Share (%), by Types 2024 & 2032
- Figure 18: Europe Short Throw Zoom Lens Revenue (million), by Country 2024 & 2032
- Figure 19: Europe Short Throw Zoom Lens Revenue Share (%), by Country 2024 & 2032
- Figure 20: Middle East & Africa Short Throw Zoom Lens Revenue (million), by Application 2024 & 2032
- Figure 21: Middle East & Africa Short Throw Zoom Lens Revenue Share (%), by Application 2024 & 2032
- Figure 22: Middle East & Africa Short Throw Zoom Lens Revenue (million), by Types 2024 & 2032
- Figure 23: Middle East & Africa Short Throw Zoom Lens Revenue Share (%), by Types 2024 & 2032
- Figure 24: Middle East & Africa Short Throw Zoom Lens Revenue (million), by Country 2024 & 2032
- Figure 25: Middle East & Africa Short Throw Zoom Lens Revenue Share (%), by Country 2024 & 2032
- Figure 26: Asia Pacific Short Throw Zoom Lens Revenue (million), by Application 2024 & 2032
- Figure 27: Asia Pacific Short Throw Zoom Lens Revenue Share (%), by Application 2024 & 2032
- Figure 28: Asia Pacific Short Throw Zoom Lens Revenue (million), by Types 2024 & 2032
- Figure 29: Asia Pacific Short Throw Zoom Lens Revenue Share (%), by Types 2024 & 2032
- Figure 30: Asia Pacific Short Throw Zoom Lens Revenue (million), by Country 2024 & 2032
- Figure 31: Asia Pacific Short Throw Zoom Lens Revenue Share (%), by Country 2024 & 2032
List of Tables
- Table 1: Global Short Throw Zoom Lens Revenue million Forecast, by Region 2019 & 2032
- Table 2: Global Short Throw Zoom Lens Revenue million Forecast, by Application 2019 & 2032
- Table 3: Global Short Throw Zoom Lens Revenue million Forecast, by Types 2019 & 2032
- Table 4: Global Short Throw Zoom Lens Revenue million Forecast, by Region 2019 & 2032
- Table 5: Global Short Throw Zoom Lens Revenue million Forecast, by Application 2019 & 2032
- Table 6: Global Short Throw Zoom Lens Revenue million Forecast, by Types 2019 & 2032
- Table 7: Global Short Throw Zoom Lens Revenue million Forecast, by Country 2019 & 2032
- Table 8: United States Short Throw Zoom Lens Revenue (million) Forecast, by Application 2019 & 2032
- Table 9: Canada Short Throw Zoom Lens Revenue (million) Forecast, by Application 2019 & 2032
- Table 10: Mexico Short Throw Zoom Lens Revenue (million) Forecast, by Application 2019 & 2032
- Table 11: Global Short Throw Zoom Lens Revenue million Forecast, by Application 2019 & 2032
- Table 12: Global Short Throw Zoom Lens Revenue million Forecast, by Types 2019 & 2032
- Table 13: Global Short Throw Zoom Lens Revenue million Forecast, by Country 2019 & 2032
- Table 14: Brazil Short Throw Zoom Lens Revenue (million) Forecast, by Application 2019 & 2032
- Table 15: Argentina Short Throw Zoom Lens Revenue (million) Forecast, by Application 2019 & 2032
- Table 16: Rest of South America Short Throw Zoom Lens Revenue (million) Forecast, by Application 2019 & 2032
- Table 17: Global Short Throw Zoom Lens Revenue million Forecast, by Application 2019 & 2032
- Table 18: Global Short Throw Zoom Lens Revenue million Forecast, by Types 2019 & 2032
- Table 19: Global Short Throw Zoom Lens Revenue million Forecast, by Country 2019 & 2032
- Table 20: United Kingdom Short Throw Zoom Lens Revenue (million) Forecast, by Application 2019 & 2032
- Table 21: Germany Short Throw Zoom Lens Revenue (million) Forecast, by Application 2019 & 2032
- Table 22: France Short Throw Zoom Lens Revenue (million) Forecast, by Application 2019 & 2032
- Table 23: Italy Short Throw Zoom Lens Revenue (million) Forecast, by Application 2019 & 2032
- Table 24: Spain Short Throw Zoom Lens Revenue (million) Forecast, by Application 2019 & 2032
- Table 25: Russia Short Throw Zoom Lens Revenue (million) Forecast, by Application 2019 & 2032
- Table 26: Benelux Short Throw Zoom Lens Revenue (million) Forecast, by Application 2019 & 2032
- Table 27: Nordics Short Throw Zoom Lens Revenue (million) Forecast, by Application 2019 & 2032
- Table 28: Rest of Europe Short Throw Zoom Lens Revenue (million) Forecast, by Application 2019 & 2032
- Table 29: Global Short Throw Zoom Lens Revenue million Forecast, by Application 2019 & 2032
- Table 30: Global Short Throw Zoom Lens Revenue million Forecast, by Types 2019 & 2032
- Table 31: Global Short Throw Zoom Lens Revenue million Forecast, by Country 2019 & 2032
- Table 32: Turkey Short Throw Zoom Lens Revenue (million) Forecast, by Application 2019 & 2032
- Table 33: Israel Short Throw Zoom Lens Revenue (million) Forecast, by Application 2019 & 2032
- Table 34: GCC Short Throw Zoom Lens Revenue (million) Forecast, by Application 2019 & 2032
- Table 35: North Africa Short Throw Zoom Lens Revenue (million) Forecast, by Application 2019 & 2032
- Table 36: South Africa Short Throw Zoom Lens Revenue (million) Forecast, by Application 2019 & 2032
- Table 37: Rest of Middle East & Africa Short Throw Zoom Lens Revenue (million) Forecast, by Application 2019 & 2032
- Table 38: Global Short Throw Zoom Lens Revenue million Forecast, by Application 2019 & 2032
- Table 39: Global Short Throw Zoom Lens Revenue million Forecast, by Types 2019 & 2032
- Table 40: Global Short Throw Zoom Lens Revenue million Forecast, by Country 2019 & 2032
- Table 41: China Short Throw Zoom Lens Revenue (million) Forecast, by Application 2019 & 2032
- Table 42: India Short Throw Zoom Lens Revenue (million) Forecast, by Application 2019 & 2032
- Table 43: Japan Short Throw Zoom Lens Revenue (million) Forecast, by Application 2019 & 2032
- Table 44: South Korea Short Throw Zoom Lens Revenue (million) Forecast, by Application 2019 & 2032
- Table 45: ASEAN Short Throw Zoom Lens Revenue (million) Forecast, by Application 2019 & 2032
- Table 46: Oceania Short Throw Zoom Lens Revenue (million) Forecast, by Application 2019 & 2032
- Table 47: Rest of Asia Pacific Short Throw Zoom Lens Revenue (million) Forecast, by Application 2019 & 2032
Frequently Asked Questions
1. What is the projected Compound Annual Growth Rate (CAGR) of the Short Throw Zoom Lens?
The projected CAGR is approximately XX%.
2. Which companies are prominent players in the Short Throw Zoom Lens?
Key companies in the market include Epson, Panasonic, Christie Digital, Barco, Optoma, Mitsubishi, Sony, Hitachi, NEC.
3. What are the main segments of the Short Throw Zoom Lens?
The market segments include Application, Types.
4. Can you provide details about the market size?
The market size is estimated to be USD XXX million as of 2022.
5. What are some drivers contributing to market growth?
N/A
6. What are the notable trends driving market growth?
N/A
7. Are there any restraints impacting market growth?
N/A
8. Can you provide examples of recent developments in the market?
N/A
9. What pricing options are available for accessing the report?
Pricing options include single-user, multi-user, and enterprise licenses priced at USD 2900.00, USD 4350.00, and USD 5800.00 respectively.
10. Is the market size provided in terms of value or volume?
The market size is provided in terms of value, measured in million.
11. Are there any specific market keywords associated with the report?
Yes, the market keyword associated with the report is "Short Throw Zoom Lens," which aids in identifying and referencing the specific market segment covered.
12. How do I determine which pricing option suits my needs best?
The pricing options vary based on user requirements and access needs. Individual users may opt for single-user licenses, while businesses requiring broader access may choose multi-user or enterprise licenses for cost-effective access to the report.
13. Are there any additional resources or data provided in the Short Throw Zoom Lens report?
While the report offers comprehensive insights, it's advisable to review the specific contents or supplementary materials provided to ascertain if additional resources or data are available.
14. How can I stay updated on further developments or reports in the Short Throw Zoom Lens?
To stay informed about further developments, trends, and reports in the Short Throw Zoom Lens, consider subscribing to industry newsletters, following relevant companies and organizations, or regularly checking reputable industry news sources and publications.
Methodology
Step 1 - Identification of Relevant Samples Size from Population Database


Step 2 - Approaches for Defining Global Market Size (Value, Volume* & Price*)

Note*: In applicable scenarios
Step 3 - Data Sources
Primary Research
- Web Analytics
- Survey Reports
- Research Institute
- Latest Research Reports
- Opinion Leaders
Secondary Research
- Annual Reports
- White Paper
- Latest Press Release
- Industry Association
- Paid Database
- Investor Presentations

Step 4 - Data Triangulation
Involves using different sources of information in order to increase the validity of a study
These sources are likely to be stakeholders in a program - participants, other researchers, program staff, other community members, and so on.
Then we put all data in single framework & apply various statistical tools to find out the dynamic on the market.
During the analysis stage, feedback from the stakeholder groups would be compared to determine areas of agreement as well as areas of divergence


