

Key Insights
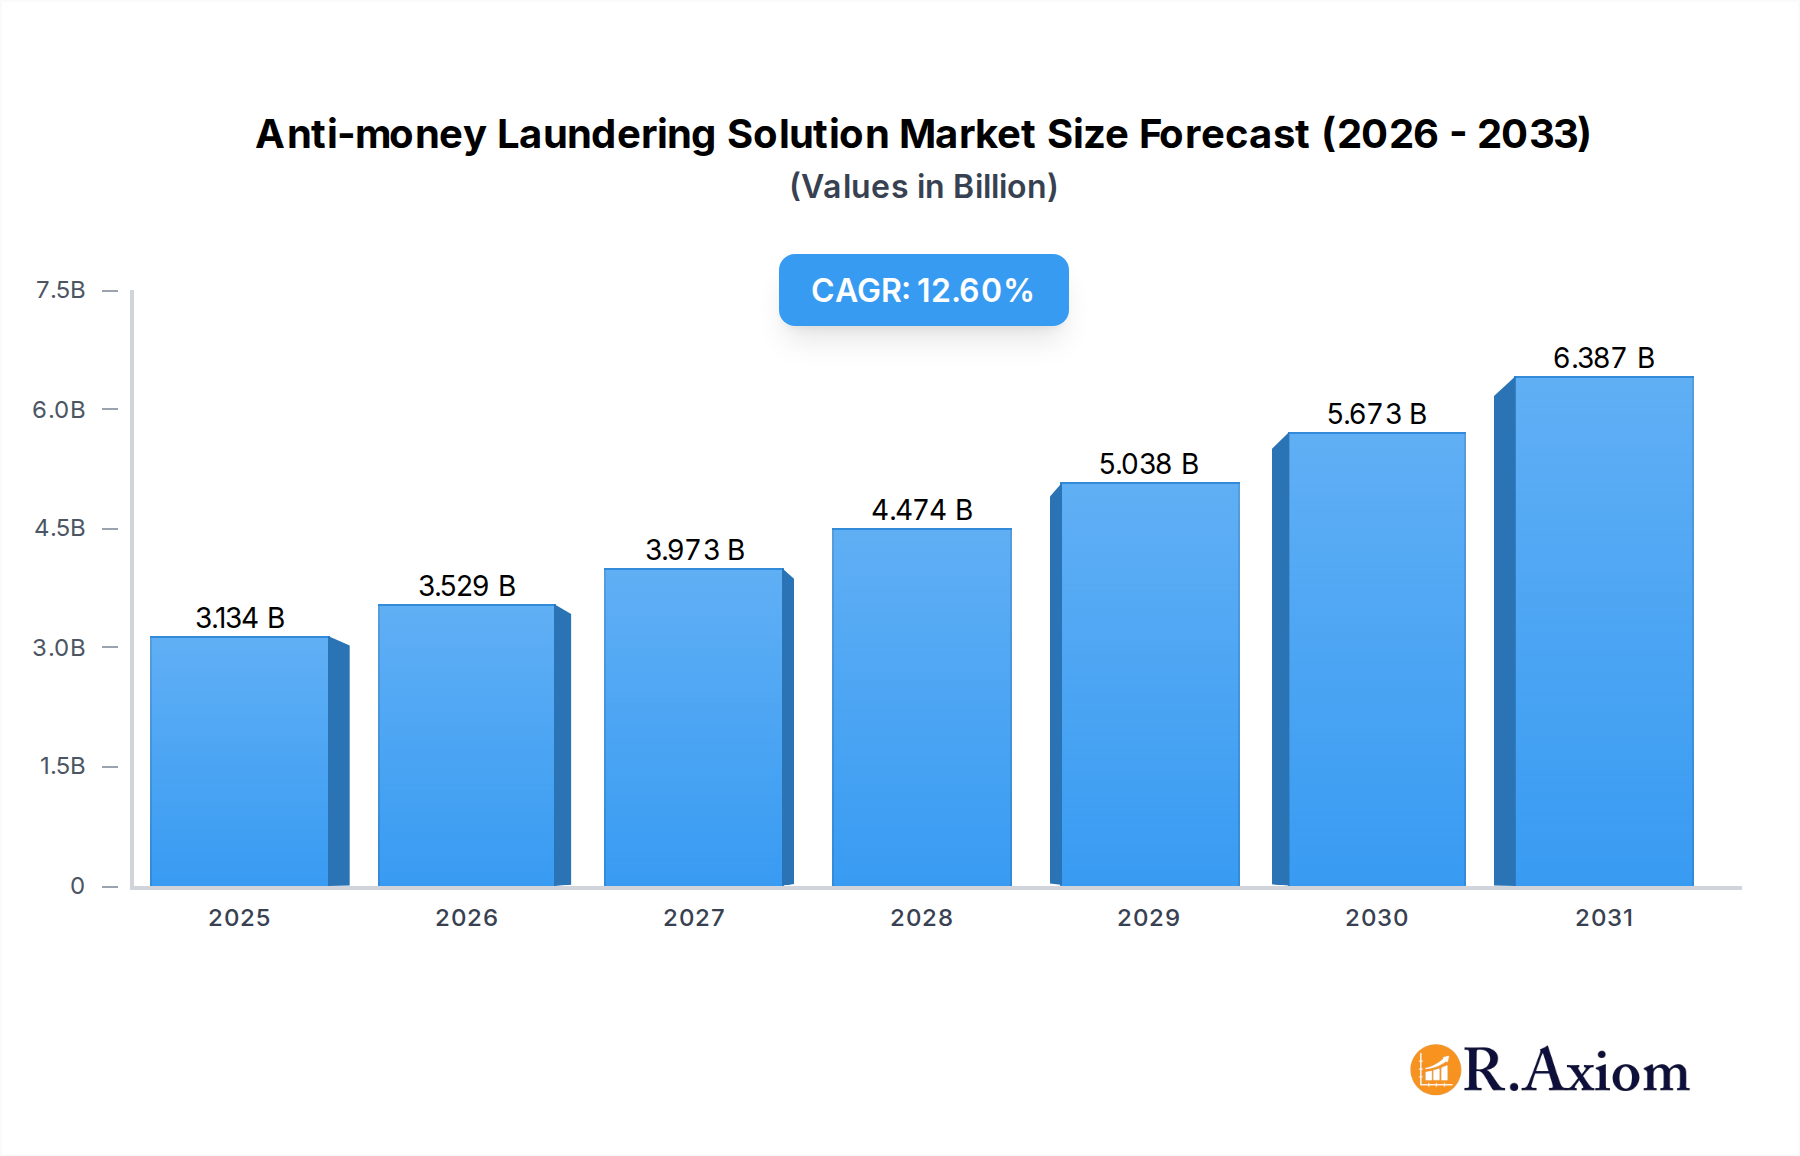
The global Anti-Money Laundering (AML) solutions market is experiencing robust growth, projected to reach a substantial USD 2783.2 million by 2025, with a compelling Compound Annual Growth Rate (CAGR) of 12.6%. This upward trajectory is fueled by an escalating need for sophisticated tools to combat sophisticated financial crimes and meet increasingly stringent regulatory demands worldwide. Financial institutions, including banks and insurance companies, are heavily investing in AML solutions to enhance their compliance frameworks, detect illicit financial activities, and safeguard their reputations. The market is segmented into critical applications such as Transaction Monitoring Software, Currency Transaction Reporting (CTR) Software, Customer Identity Management Software, and Compliance Management Software. These solutions are vital for identifying suspicious patterns, reporting transactions to authorities, verifying customer identities, and ensuring adherence to evolving AML regulations. The increasing volume and complexity of financial transactions, coupled with the rise of cross-border illicit financial flows, are significant drivers of this market expansion.

Anti-money Laundering Solution Market Size (In Billion)
The projected growth signifies a substantial opportunity for solution providers and a critical area of focus for financial entities. Key market players like Oracle, Thomson Reuters, Fiserv, SAS, and Experian are at the forefront, offering advanced AML platforms. The market's strength is further bolstered by ongoing technological advancements, including the integration of Artificial Intelligence (AI) and Machine Learning (ML) to improve the accuracy and efficiency of AML processes, reducing false positives and enhancing threat detection capabilities. While the market demonstrates immense potential, certain restraints such as the high cost of implementation and the ongoing need for skilled personnel to manage these complex systems present challenges. However, the persistent threat of financial crime and the imperative for regulatory compliance are expected to overcome these hurdles, driving sustained innovation and adoption of AML solutions across diverse financial sectors globally. The market's expansion is anticipated to continue its strong upward trend throughout the forecast period, underscoring the critical role of AML solutions in maintaining financial integrity.
Anti-money Laundering Solution Company Market Share
Here is an SEO-optimized, detailed report description for Anti-money Laundering Solutions, designed for immediate use without modification.
Anti-money Laundering Solution Market Concentration & Innovation
The Anti-money Laundering (AML) solution market, valued at an estimated xx million in 2025, exhibits a moderate to high concentration. Key players like Oracle, Thomson Reuters, Fiserv, and SAS command significant market share, contributing to a competitive landscape. Innovation is primarily driven by advancements in Artificial Intelligence (AI) and Machine Learning (ML) for more accurate transaction monitoring and risk assessment, alongside the increasing adoption of cloud-based solutions for scalability and accessibility. Regulatory frameworks, such as evolving Know Your Customer (KYC) mandates and data privacy laws, are significant innovation catalysts, compelling solution providers to continuously enhance their offerings. Product substitutes, while present in manual processes or basic compliance software, are rapidly becoming obsolete against sophisticated AML platforms. End-user trends show a strong preference for integrated, end-to-end AML solutions that streamline compliance workflows across banking, insurance, and broader financial institutions. Mergers and acquisitions (M&A) remain a crucial strategic tool for market consolidation and capability expansion. Notable M&A deals in recent years have collectively exceeded xx million, signaling a drive towards comprehensive AML offerings and expanded global reach.
Anti-money Laundering Solution Industry Trends & Insights
The global Anti-money Laundering (AML) solution market is experiencing robust growth, projected to expand at a Compound Annual Growth Rate (CAGR) of approximately xx% from 2025 to 2033. This expansion is fueled by a confluence of factors, including increasingly stringent global anti-financial crime regulations, a surge in sophisticated money laundering schemes, and the growing imperative for financial institutions to protect their reputations and avoid hefty penalties. The estimated market size for AML solutions is expected to reach xx million by 2025, with substantial projected growth in the forecast period. Technological disruptions are at the forefront of this evolution. The integration of Artificial Intelligence (AI) and Machine Learning (ML) algorithms is revolutionizing transaction monitoring, enabling real-time detection of anomalous activities with higher precision and fewer false positives. Natural Language Processing (NLP) is also playing a critical role in analyzing unstructured data for enhanced risk profiling and suspicious activity reporting. Furthermore, the widespread adoption of cloud-based AML solutions is democratizing access to advanced compliance tools, particularly for smaller financial institutions that may lack the resources for on-premise infrastructure. Consumer preferences, particularly within the financial sector, are shifting towards seamless, integrated, and user-friendly AML platforms that minimize operational friction while maximizing regulatory adherence. This includes a demand for solutions that offer comprehensive customer due diligence, robust screening capabilities, and efficient case management. Competitive dynamics are characterized by a blend of established giants and agile, specialized vendors. Companies are increasingly focusing on offering end-to-end solutions that encompass the entire AML lifecycle, from customer onboarding and risk assessment to transaction monitoring, reporting, and investigation. The market penetration of advanced AML solutions is steadily increasing across all segments, driven by a heightened awareness of the financial and reputational risks associated with non-compliance.
Dominant Markets & Segments in Anti-money Laundering Solution
The Anti-money Laundering (AML) solution market is witnessing dominance across several key regions and application segments. In terms of application, Banks represent the most significant market segment, accounting for an estimated xx% of the total AML solution market in 2025. This dominance is driven by the inherent high-risk nature of banking operations, the sheer volume of transactions processed, and the extensive regulatory scrutiny banks face globally. Financial institutions, including investment firms and credit unions, also constitute a substantial segment, with their demand spurred by complex trading activities and cross-border transactions. Insurance companies, while historically having a slightly lower adoption rate, are increasingly investing in AML solutions to combat premium fraud and money laundering through insurance products.
Within the types of AML solutions, Transaction Monitoring Software is the most dominant category, projected to capture xx% of the market by 2025. This is directly linked to the core requirement of identifying suspicious financial activities in real-time. Compliance Management Software is another critical and rapidly growing segment, essential for ensuring adherence to a multitude of regulatory requirements. Currency Transaction Reporting (CTR) Software remains a foundational component, particularly in jurisdictions with strict reporting thresholds. Customer Identity Management Software, encompassing KYC and CDD processes, is experiencing exponential growth due to the increasing emphasis on knowing and verifying customer identities to prevent onboarding of illicit actors.
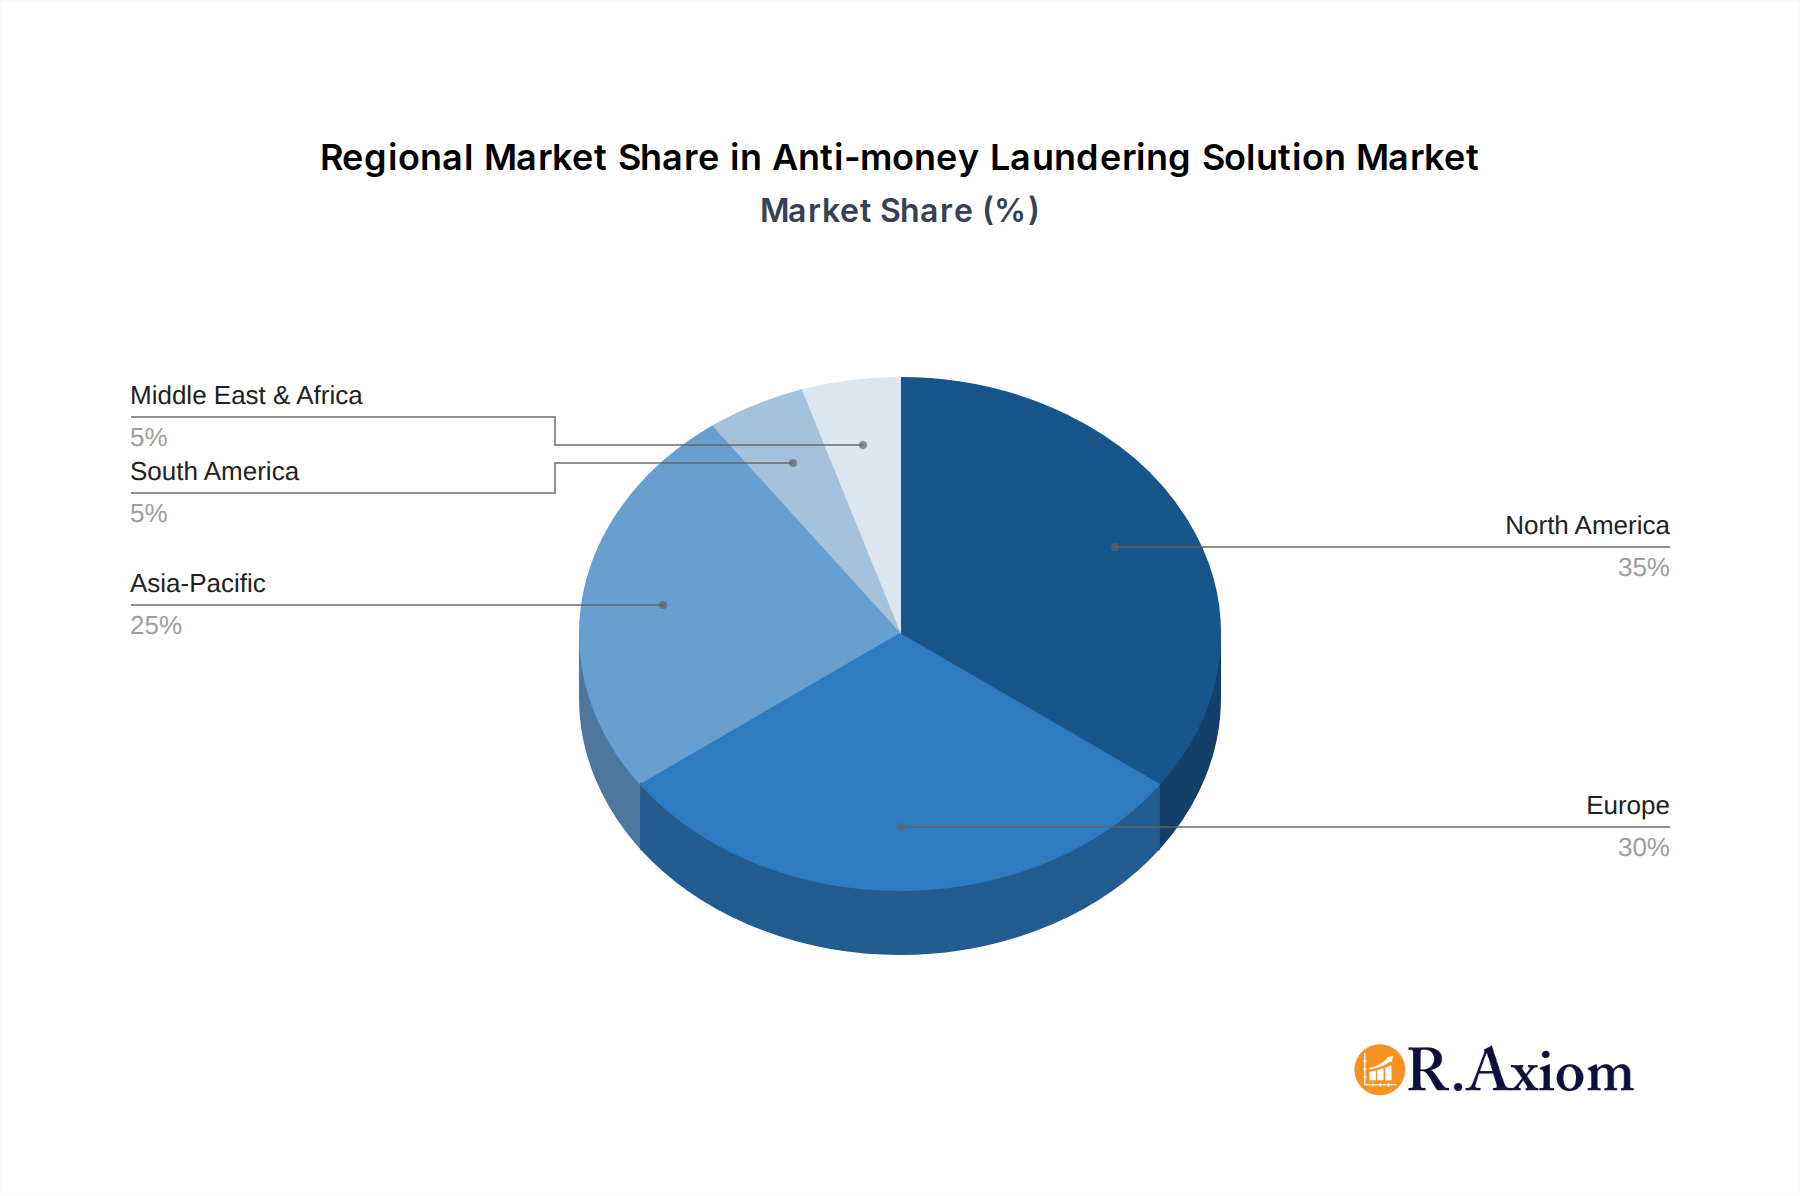
Geographically, North America and Europe are the leading markets for AML solutions, driven by mature regulatory frameworks, a high concentration of financial institutions, and significant investments in financial crime prevention technologies. Asia-Pacific is emerging as a high-growth region, fueled by rapid financial sector expansion, increasing regulatory sophistication, and a growing awareness of AML imperatives. Economic policies in these regions actively encourage digital transformation and the adoption of advanced compliance technologies.
Anti-money Laundering Solution Product Developments
Product development in the Anti-money Laundering (AML) solution sector is intensely focused on leveraging advanced technologies to enhance efficiency and accuracy. Innovations include AI-powered anomaly detection for real-time transaction monitoring, sophisticated risk scoring models for customer due diligence, and automated regulatory reporting capabilities. Solutions are increasingly offering end-to-end workflows, integrating KYC, transaction monitoring, and suspicious activity reporting into single platforms. Cloud-native architectures are becoming standard, providing scalability, flexibility, and cost-effectiveness. Competitive advantages are being built around superior detection rates, reduced false positives, seamless integration with existing financial systems, and comprehensive compliance coverage across diverse regulatory landscapes.
Report Scope & Segmentation Analysis
This report provides a comprehensive analysis of the Anti-money Laundering (AML) solution market, segmented by application and solution type. The application segments include Banks, Insurance Companies, and Financial Institutions, each analyzed for their specific AML needs and market penetration. For Banks, the focus is on high-volume transaction monitoring and regulatory reporting. Insurance companies are examined for their unique challenges in combating fraud and money laundering within their product lines. Financial Institutions, encompassing investment firms and asset managers, are analyzed for their complex trading and cross-border transaction compliance requirements.
The solution types covered are Transaction Monitoring Software, Currency Transaction Reporting (CTR) Software, Customer Identity Management Software, Compliance Management Software, and Others (including fraud detection and risk management modules). Transaction Monitoring Software is projected to hold the largest market share, driven by real-time detection needs. Customer Identity Management is expected to exhibit the highest growth rate due to stringent KYC regulations. The market sizes and projected growth rates for each segment will be detailed, offering insights into competitive dynamics and investment opportunities.
Key Drivers of Anti-money Laundering Solution Growth
The growth of the Anti-money Laundering (AML) solution market is propelled by several critical factors. Stricter Regulatory Enforcement worldwide, with increased fines and penalties for non-compliance, compels financial institutions to invest in robust AML systems. The Escalation of Financial Crime, including sophisticated money laundering schemes and cyber-enabled fraud, necessitates advanced detection and prevention capabilities. Technological Advancements, particularly in AI and Machine Learning, enable more effective and efficient AML processes, reducing false positives and improving detection accuracy. The Globalization of Financial Markets increases the complexity of cross-border transactions, demanding comprehensive AML solutions for international compliance. Furthermore, the Growing Demand for Digital Financial Services inherently leads to a higher volume of transactions requiring diligent AML oversight.
Challenges in the Anti-money Laundering Solution Sector
Despite significant growth, the Anti-money Laundering (AML) solution sector faces several challenges. Evolving Regulatory Landscapes create constant pressure for solution providers and users to adapt to new rules and interpretations, demanding continuous updates and expensive reconfigurations. Data Silos and Integration Issues within financial institutions can hinder the effectiveness of AML systems, making it difficult to achieve a holistic view of customer risk. The High Cost of Implementation and Maintenance of sophisticated AML solutions can be a barrier, especially for smaller firms. Shortages of Skilled AML Professionals limit the capacity for effective system management and investigation. Furthermore, The Sophistication of Criminal Tactics requires ongoing innovation in AML technologies, making it a continuous arms race against illicit actors.
Emerging Opportunities in Anti-money Laundering Solution
Emerging opportunities in the Anti-money Laundering (AML) solution market are abundant, driven by innovation and evolving needs. The Expansion of Digital Currencies and Blockchain Technology presents both challenges and opportunities for AML solution providers to develop specialized monitoring tools. The Rise of RegTech (Regulatory Technology) is fostering the development of more integrated, automated, and user-friendly compliance solutions. There's a growing demand for Behavioral Analytics in AML, moving beyond rule-based systems to identify subtle patterns of fraudulent behavior. Enhanced Data Analytics and Big Data capabilities offer opportunities for deeper insights into financial crime networks. The increasing focus on Environmental, Social, and Governance (ESG) compliance is also creating a niche for AML solutions that can address financial crime risks associated with unethical business practices.
Leading Players in the Anti-money Laundering Solution Market
- Oracle Corporation
- BAE Systems
- Accenture
- NICE Actimize
- Tata Consultancy Services Limited
- Cognizant Technology Solutions Corporation
- ACI Worldwide Inc.
- SAS Institute Inc.
- Fiserv, Inc.
- Open Text Corporation
- Experian Information Solutions, Inc.
- FICO
- Others
Key Developments in Anti-money Laundering Solution Industry
- 2024/03: Launch of new AI-powered real-time transaction monitoring module by Nice Actimize, improving anomaly detection rates by xx%.
- 2023/11: Oracle announces strategic partnership with a leading FinTech to integrate its AML solutions with blockchain platforms, valued at xx million.
- 2023/08: Fiserv acquires a specialized KYC and customer onboarding solution provider for an undisclosed sum, aiming to enhance its end-to-end AML offering.
- 2023/05: Thomson Reuters expands its global compliance data offerings, incorporating enhanced sanctions screening capabilities.
- 2022/10: SAS introduces a cloud-native AML platform with enhanced scalability and predictive analytics, projected to increase adoption by xx% among mid-sized financial institutions.
- 2022/07: Experian strengthens its identity verification services, integrating advanced biometric authentication for customer onboarding.
Strategic Outlook for Anti-money Laundering Solution Market
The strategic outlook for the Anti-money Laundering (AML) solution market remains exceptionally positive, driven by the persistent and evolving threat of financial crime and the unwavering commitment of global regulators. Key growth catalysts include the continued integration of sophisticated AI and ML technologies to achieve proactive threat detection and reduce operational overhead. The demand for unified, end-to-end AML platforms that streamline the entire compliance lifecycle from onboarding to reporting will intensify. Furthermore, the increasing adoption of cloud-based solutions will democratize access to advanced capabilities, expanding the market's reach. Opportunities in emerging areas like cryptocurrency AML and the growing intersection of AML with ESG compliance will shape future strategies, positioning the market for sustained innovation and expansion.
Anti-money Laundering Solution Segmentation
- By Component
- Software
- Services
- By Deployment Mode
- On-Premise
- Cloud-Based
- By Solution
- Transaction Monitoring
- Currency Transaction Reporting (CTR)
- Suspicious Activity Reporting (SAR)
- Enhanced Due Diligence (EDD)
- Others
- By Enterprise Size
- Large Enterprises
- Small & Medium Enterprises
- By End User Industry
- BFSI
- Government
- Healthcare
- IT & Telecom
- Others
Anti-money Laundering Solution Segmentation By Geography
- 1. North America
- 1.1. United States
- 1.2. Canada
- 1.3. Mexico
- 2. South America
- 2.1. Brazil
- 2.2. Argentina
- 2.3. Rest of South America
- 3. Europe
- 3.1. United Kingdom
- 3.2. Germany
- 3.3. France
- 3.4. Italy
- 3.5. Spain
- 3.6. Russia
- 3.7. Benelux
- 3.8. Nordics
- 3.9. Rest of Europe
- 4. Middle East & Africa
- 4.1. Turkey
- 4.2. Israel
- 4.3. GCC
- 4.4. North Africa
- 4.5. South Africa
- 4.6. Rest of Middle East & Africa
- 5. Asia Pacific
- 5.1. China
- 5.2. India
- 5.3. Japan
- 5.4. South Korea
- 5.5. ASEAN
- 5.6. Oceania
- 5.7. Rest of Asia Pacific
Anti-money Laundering Solution Regional Market Share
Geographic Coverage of Anti-money Laundering Solution
Anti-money Laundering Solution REPORT HIGHLIGHTS
| Aspects | Details |
|---|---|
| Study Period | 2020-2034 |
| Base Year | 2025 |
| Estimated Year | 2026 |
| Forecast Period | 2026-2034 |
| Historical Period | 2020-2025 |
| Growth Rate | CAGR of 12.6% from 2020-2034 |
| Segmentation |
|
Table of Contents
- 1. Introduction
- 1.1. Research Scope
- 1.2. Market Segmentation
- 1.3. Research Objective
- 1.4. Definitions and Assumptions
- 2. Executive Summary
- 2.1. Market Snapshot
- 3. Market Dynamics
- 3.1. Market Drivers
- 3.2. Market Restrains
- 3.3. Market Trends
- 3.4. Market Opportunities
- 4. Market Factor Analysis
- 4.1. Porters Five Forces
- 4.1.1. Bargaining Power of Suppliers
- 4.1.2. Bargaining Power of Buyers
- 4.1.3. Threat of New Entrants
- 4.1.4. Threat of Substitutes
- 4.1.5. Competitive Rivalry
- 4.2. PESTEL analysis
- 4.3. BCG Analysis
- 4.3.1. Stars (High Growth, High Market Share)
- 4.3.2. Cash Cows (Low Growth, High Market Share)
- 4.3.3. Question Mark (High Growth, Low Market Share)
- 4.3.4. Dogs (Low Growth, Low Market Share)
- 4.4. Ansoff Matrix Analysis
- 4.5. Supply Chain Analysis
- 4.6. Regulatory Landscape
- 4.7. Current Market Potential and Opportunity Assessment (TAM–SAM–SOM Framework)
- 4.8. RAX Analyst Note
- 4.1. Porters Five Forces
- 5. Market Analysis, Insights and Forecast 2021-2033
- 5.1. Market Analysis, Insights and Forecast - by Component
- 5.1.1. Software
- 5.1.2. Services
- 5.2. Market Analysis, Insights and Forecast - by Deployment Mode
- 5.2.1. On-Premise
- 5.2.2. Cloud-Based
- 5.3. Market Analysis, Insights and Forecast - by Solution
- 5.3.1. Transaction Monitoring
- 5.3.2. Currency Transaction Reporting (CTR)
- 5.3.3. Suspicious Activity Reporting (SAR)
- 5.3.4. Enhanced Due Diligence (EDD)
- 5.3.5. Others
- 5.4. Market Analysis, Insights and Forecast - by Enterprise Size
- 5.4.1. Large Enterprises
- 5.4.2. Small & Medium Enterprises
- 5.5. Market Analysis, Insights and Forecast - by End User Industry
- 5.5.1. BFSI
- 5.5.2. Government
- 5.5.3. Healthcare
- 5.5.4. IT & Telecom
- 5.5.5. Others
- 5.6. Market Analysis, Insights and Forecast - by Region
- 5.6.1. North America
- 5.6.2. South America
- 5.6.3. Europe
- 5.6.4. Middle East & Africa
- 5.6.5. Asia Pacific
- 5.1. Market Analysis, Insights and Forecast - by Component
- 6. Global Anti-money Laundering Solution Analysis, Insights and Forecast, 2021-2033
- 6.1. Market Analysis, Insights and Forecast - by Component
- 6.1.1. Software
- 6.1.2. Services
- 6.2. Market Analysis, Insights and Forecast - by Deployment Mode
- 6.2.1. On-Premise
- 6.2.2. Cloud-Based
- 6.3. Market Analysis, Insights and Forecast - by Solution
- 6.3.1. Transaction Monitoring
- 6.3.2. Currency Transaction Reporting (CTR)
- 6.3.3. Suspicious Activity Reporting (SAR)
- 6.3.4. Enhanced Due Diligence (EDD)
- 6.3.5. Others
- 6.4. Market Analysis, Insights and Forecast - by Enterprise Size
- 6.4.1. Large Enterprises
- 6.4.2. Small & Medium Enterprises
- 6.5. Market Analysis, Insights and Forecast - by End User Industry
- 6.5.1. BFSI
- 6.5.2. Government
- 6.5.3. Healthcare
- 6.5.4. IT & Telecom
- 6.5.5. Others
- 6.1. Market Analysis, Insights and Forecast - by Component
- 7. North America Anti-money Laundering Solution Analysis, Insights and Forecast, 2020-2032
- 7.1. Market Analysis, Insights and Forecast - by Component
- 7.1.1. Software
- 7.1.2. Services
- 7.2. Market Analysis, Insights and Forecast - by Deployment Mode
- 7.2.1. On-Premise
- 7.2.2. Cloud-Based
- 7.3. Market Analysis, Insights and Forecast - by Solution
- 7.3.1. Transaction Monitoring
- 7.3.2. Currency Transaction Reporting (CTR)
- 7.3.3. Suspicious Activity Reporting (SAR)
- 7.3.4. Enhanced Due Diligence (EDD)
- 7.3.5. Others
- 7.4. Market Analysis, Insights and Forecast - by Enterprise Size
- 7.4.1. Large Enterprises
- 7.4.2. Small & Medium Enterprises
- 7.5. Market Analysis, Insights and Forecast - by End User Industry
- 7.5.1. BFSI
- 7.5.2. Government
- 7.5.3. Healthcare
- 7.5.4. IT & Telecom
- 7.5.5. Others
- 7.1. Market Analysis, Insights and Forecast - by Component
- 8. South America Anti-money Laundering Solution Analysis, Insights and Forecast, 2020-2032
- 8.1. Market Analysis, Insights and Forecast - by Component
- 8.1.1. Software
- 8.1.2. Services
- 8.2. Market Analysis, Insights and Forecast - by Deployment Mode
- 8.2.1. On-Premise
- 8.2.2. Cloud-Based
- 8.3. Market Analysis, Insights and Forecast - by Solution
- 8.3.1. Transaction Monitoring
- 8.3.2. Currency Transaction Reporting (CTR)
- 8.3.3. Suspicious Activity Reporting (SAR)
- 8.3.4. Enhanced Due Diligence (EDD)
- 8.3.5. Others
- 8.4. Market Analysis, Insights and Forecast - by Enterprise Size
- 8.4.1. Large Enterprises
- 8.4.2. Small & Medium Enterprises
- 8.5. Market Analysis, Insights and Forecast - by End User Industry
- 8.5.1. BFSI
- 8.5.2. Government
- 8.5.3. Healthcare
- 8.5.4. IT & Telecom
- 8.5.5. Others
- 8.1. Market Analysis, Insights and Forecast - by Component
- 9. Europe Anti-money Laundering Solution Analysis, Insights and Forecast, 2020-2032
- 9.1. Market Analysis, Insights and Forecast - by Component
- 9.1.1. Software
- 9.1.2. Services
- 9.2. Market Analysis, Insights and Forecast - by Deployment Mode
- 9.2.1. On-Premise
- 9.2.2. Cloud-Based
- 9.3. Market Analysis, Insights and Forecast - by Solution
- 9.3.1. Transaction Monitoring
- 9.3.2. Currency Transaction Reporting (CTR)
- 9.3.3. Suspicious Activity Reporting (SAR)
- 9.3.4. Enhanced Due Diligence (EDD)
- 9.3.5. Others
- 9.4. Market Analysis, Insights and Forecast - by Enterprise Size
- 9.4.1. Large Enterprises
- 9.4.2. Small & Medium Enterprises
- 9.5. Market Analysis, Insights and Forecast - by End User Industry
- 9.5.1. BFSI
- 9.5.2. Government
- 9.5.3. Healthcare
- 9.5.4. IT & Telecom
- 9.5.5. Others
- 9.1. Market Analysis, Insights and Forecast - by Component
- 10. Middle East & Africa Anti-money Laundering Solution Analysis, Insights and Forecast, 2020-2032
- 10.1. Market Analysis, Insights and Forecast - by Component
- 10.1.1. Software
- 10.1.2. Services
- 10.2. Market Analysis, Insights and Forecast - by Deployment Mode
- 10.2.1. On-Premise
- 10.2.2. Cloud-Based
- 10.3. Market Analysis, Insights and Forecast - by Solution
- 10.3.1. Transaction Monitoring
- 10.3.2. Currency Transaction Reporting (CTR)
- 10.3.3. Suspicious Activity Reporting (SAR)
- 10.3.4. Enhanced Due Diligence (EDD)
- 10.3.5. Others
- 10.4. Market Analysis, Insights and Forecast - by Enterprise Size
- 10.4.1. Large Enterprises
- 10.4.2. Small & Medium Enterprises
- 10.5. Market Analysis, Insights and Forecast - by End User Industry
- 10.5.1. BFSI
- 10.5.2. Government
- 10.5.3. Healthcare
- 10.5.4. IT & Telecom
- 10.5.5. Others
- 10.1. Market Analysis, Insights and Forecast - by Component
- 11. Asia Pacific Anti-money Laundering Solution Analysis, Insights and Forecast, 2020-2032
- 11.1. Market Analysis, Insights and Forecast - by Component
- 11.1.1. Software
- 11.1.2. Services
- 11.2. Market Analysis, Insights and Forecast - by Deployment Mode
- 11.2.1. On-Premise
- 11.2.2. Cloud-Based
- 11.3. Market Analysis, Insights and Forecast - by Solution
- 11.3.1. Transaction Monitoring
- 11.3.2. Currency Transaction Reporting (CTR)
- 11.3.3. Suspicious Activity Reporting (SAR)
- 11.3.4. Enhanced Due Diligence (EDD)
- 11.3.5. Others
- 11.4. Market Analysis, Insights and Forecast - by Enterprise Size
- 11.4.1. Large Enterprises
- 11.4.2. Small & Medium Enterprises
- 11.5. Market Analysis, Insights and Forecast - by End User Industry
- 11.5.1. BFSI
- 11.5.2. Government
- 11.5.3. Healthcare
- 11.5.4. IT & Telecom
- 11.5.5. Others
- 11.1. Market Analysis, Insights and Forecast - by Component
- 12. Competitive Analysis
- 12.1. Company Profiles
- 12.1.1 Oracle Corporation
- 12.1.1.1. Company Overview
- 12.1.1.2. Products
- 12.1.1.3. Company Financials
- 12.1.1.4. SWOT Analysis
- 12.1.2 BAE Systems
- 12.1.2.1. Company Overview
- 12.1.2.2. Products
- 12.1.2.3. Company Financials
- 12.1.2.4. SWOT Analysis
- 12.1.3 Accenture
- 12.1.3.1. Company Overview
- 12.1.3.2. Products
- 12.1.3.3. Company Financials
- 12.1.3.4. SWOT Analysis
- 12.1.4 NICE Actimize
- 12.1.4.1. Company Overview
- 12.1.4.2. Products
- 12.1.4.3. Company Financials
- 12.1.4.4. SWOT Analysis
- 12.1.5 Tata Consultancy Services Limited
- 12.1.5.1. Company Overview
- 12.1.5.2. Products
- 12.1.5.3. Company Financials
- 12.1.5.4. SWOT Analysis
- 12.1.6 Cognizant Technology Solutions Corporation
- 12.1.6.1. Company Overview
- 12.1.6.2. Products
- 12.1.6.3. Company Financials
- 12.1.6.4. SWOT Analysis
- 12.1.7 ACI Worldwide Inc.
- 12.1.7.1. Company Overview
- 12.1.7.2. Products
- 12.1.7.3. Company Financials
- 12.1.7.4. SWOT Analysis
- 12.1.8 SAS Institute Inc.
- 12.1.8.1. Company Overview
- 12.1.8.2. Products
- 12.1.8.3. Company Financials
- 12.1.8.4. SWOT Analysis
- 12.1.9 Fiserv Inc.
- 12.1.9.1. Company Overview
- 12.1.9.2. Products
- 12.1.9.3. Company Financials
- 12.1.9.4. SWOT Analysis
- 12.1.10 Open Text Corporation
- 12.1.10.1. Company Overview
- 12.1.10.2. Products
- 12.1.10.3. Company Financials
- 12.1.10.4. SWOT Analysis
- 12.1.11 Experian Information Solutions Inc.
- 12.1.11.1. Company Overview
- 12.1.11.2. Products
- 12.1.11.3. Company Financials
- 12.1.11.4. SWOT Analysis
- 12.1.12 FICO
- 12.1.12.1. Company Overview
- 12.1.12.2. Products
- 12.1.12.3. Company Financials
- 12.1.12.4. SWOT Analysis
- 12.1.13 Others
- 12.1.13.1. Company Overview
- 12.1.13.2. Products
- 12.1.13.3. Company Financials
- 12.1.13.4. SWOT Analysis
- 12.1.1 Oracle Corporation
- 12.2. Market Entropy
- 12.2.1 Company's Key Areas Served
- 12.2.2 Recent Developments
- 12.3. Company Market Share Analysis 2025
- 12.3.1 Top 5 Companies Market Share Analysis
- 12.3.2 Top 3 Companies Market Share Analysis
- 12.4. List of Potential Customers
- 13. Research Methodology
List of Figures
- Figure 1: Global Anti-money Laundering Solution Revenue Breakdown (million, %) by Region 2025 & 2033
- Figure 2: North America Anti-money Laundering Solution Revenue (million), by Component 2025 & 2033
- Figure 3: North America Anti-money Laundering Solution Revenue Share (%), by Component 2025 & 2033
- Figure 4: North America Anti-money Laundering Solution Revenue (million), by Deployment Mode 2025 & 2033
- Figure 5: North America Anti-money Laundering Solution Revenue Share (%), by Deployment Mode 2025 & 2033
- Figure 6: North America Anti-money Laundering Solution Revenue (million), by Solution 2025 & 2033
- Figure 7: North America Anti-money Laundering Solution Revenue Share (%), by Solution 2025 & 2033
- Figure 8: North America Anti-money Laundering Solution Revenue (million), by Enterprise Size 2025 & 2033
- Figure 9: North America Anti-money Laundering Solution Revenue Share (%), by Enterprise Size 2025 & 2033
- Figure 10: North America Anti-money Laundering Solution Revenue (million), by End User Industry 2025 & 2033
- Figure 11: North America Anti-money Laundering Solution Revenue Share (%), by End User Industry 2025 & 2033
- Figure 12: North America Anti-money Laundering Solution Revenue (million), by Country 2025 & 2033
- Figure 13: North America Anti-money Laundering Solution Revenue Share (%), by Country 2025 & 2033
- Figure 14: South America Anti-money Laundering Solution Revenue (million), by Component 2025 & 2033
- Figure 15: South America Anti-money Laundering Solution Revenue Share (%), by Component 2025 & 2033
- Figure 16: South America Anti-money Laundering Solution Revenue (million), by Deployment Mode 2025 & 2033
- Figure 17: South America Anti-money Laundering Solution Revenue Share (%), by Deployment Mode 2025 & 2033
- Figure 18: South America Anti-money Laundering Solution Revenue (million), by Solution 2025 & 2033
- Figure 19: South America Anti-money Laundering Solution Revenue Share (%), by Solution 2025 & 2033
- Figure 20: South America Anti-money Laundering Solution Revenue (million), by Enterprise Size 2025 & 2033
- Figure 21: South America Anti-money Laundering Solution Revenue Share (%), by Enterprise Size 2025 & 2033
- Figure 22: South America Anti-money Laundering Solution Revenue (million), by End User Industry 2025 & 2033
- Figure 23: South America Anti-money Laundering Solution Revenue Share (%), by End User Industry 2025 & 2033
- Figure 24: South America Anti-money Laundering Solution Revenue (million), by Country 2025 & 2033
- Figure 25: South America Anti-money Laundering Solution Revenue Share (%), by Country 2025 & 2033
- Figure 26: Europe Anti-money Laundering Solution Revenue (million), by Component 2025 & 2033
- Figure 27: Europe Anti-money Laundering Solution Revenue Share (%), by Component 2025 & 2033
- Figure 28: Europe Anti-money Laundering Solution Revenue (million), by Deployment Mode 2025 & 2033
- Figure 29: Europe Anti-money Laundering Solution Revenue Share (%), by Deployment Mode 2025 & 2033
- Figure 30: Europe Anti-money Laundering Solution Revenue (million), by Solution 2025 & 2033
- Figure 31: Europe Anti-money Laundering Solution Revenue Share (%), by Solution 2025 & 2033
- Figure 32: Europe Anti-money Laundering Solution Revenue (million), by Enterprise Size 2025 & 2033
- Figure 33: Europe Anti-money Laundering Solution Revenue Share (%), by Enterprise Size 2025 & 2033
- Figure 34: Europe Anti-money Laundering Solution Revenue (million), by End User Industry 2025 & 2033
- Figure 35: Europe Anti-money Laundering Solution Revenue Share (%), by End User Industry 2025 & 2033
- Figure 36: Europe Anti-money Laundering Solution Revenue (million), by Country 2025 & 2033
- Figure 37: Europe Anti-money Laundering Solution Revenue Share (%), by Country 2025 & 2033
- Figure 38: Middle East & Africa Anti-money Laundering Solution Revenue (million), by Component 2025 & 2033
- Figure 39: Middle East & Africa Anti-money Laundering Solution Revenue Share (%), by Component 2025 & 2033
- Figure 40: Middle East & Africa Anti-money Laundering Solution Revenue (million), by Deployment Mode 2025 & 2033
- Figure 41: Middle East & Africa Anti-money Laundering Solution Revenue Share (%), by Deployment Mode 2025 & 2033
- Figure 42: Middle East & Africa Anti-money Laundering Solution Revenue (million), by Solution 2025 & 2033
- Figure 43: Middle East & Africa Anti-money Laundering Solution Revenue Share (%), by Solution 2025 & 2033
- Figure 44: Middle East & Africa Anti-money Laundering Solution Revenue (million), by Enterprise Size 2025 & 2033
- Figure 45: Middle East & Africa Anti-money Laundering Solution Revenue Share (%), by Enterprise Size 2025 & 2033
- Figure 46: Middle East & Africa Anti-money Laundering Solution Revenue (million), by End User Industry 2025 & 2033
- Figure 47: Middle East & Africa Anti-money Laundering Solution Revenue Share (%), by End User Industry 2025 & 2033
- Figure 48: Middle East & Africa Anti-money Laundering Solution Revenue (million), by Country 2025 & 2033
- Figure 49: Middle East & Africa Anti-money Laundering Solution Revenue Share (%), by Country 2025 & 2033
- Figure 50: Asia Pacific Anti-money Laundering Solution Revenue (million), by Component 2025 & 2033
- Figure 51: Asia Pacific Anti-money Laundering Solution Revenue Share (%), by Component 2025 & 2033
- Figure 52: Asia Pacific Anti-money Laundering Solution Revenue (million), by Deployment Mode 2025 & 2033
- Figure 53: Asia Pacific Anti-money Laundering Solution Revenue Share (%), by Deployment Mode 2025 & 2033
- Figure 54: Asia Pacific Anti-money Laundering Solution Revenue (million), by Solution 2025 & 2033
- Figure 55: Asia Pacific Anti-money Laundering Solution Revenue Share (%), by Solution 2025 & 2033
- Figure 56: Asia Pacific Anti-money Laundering Solution Revenue (million), by Enterprise Size 2025 & 2033
- Figure 57: Asia Pacific Anti-money Laundering Solution Revenue Share (%), by Enterprise Size 2025 & 2033
- Figure 58: Asia Pacific Anti-money Laundering Solution Revenue (million), by End User Industry 2025 & 2033
- Figure 59: Asia Pacific Anti-money Laundering Solution Revenue Share (%), by End User Industry 2025 & 2033
- Figure 60: Asia Pacific Anti-money Laundering Solution Revenue (million), by Country 2025 & 2033
- Figure 61: Asia Pacific Anti-money Laundering Solution Revenue Share (%), by Country 2025 & 2033
List of Tables
- Table 1: Global Anti-money Laundering Solution Revenue million Forecast, by Component 2020 & 2033
- Table 2: Global Anti-money Laundering Solution Revenue million Forecast, by Deployment Mode 2020 & 2033
- Table 3: Global Anti-money Laundering Solution Revenue million Forecast, by Solution 2020 & 2033
- Table 4: Global Anti-money Laundering Solution Revenue million Forecast, by Enterprise Size 2020 & 2033
- Table 5: Global Anti-money Laundering Solution Revenue million Forecast, by End User Industry 2020 & 2033
- Table 6: Global Anti-money Laundering Solution Revenue million Forecast, by Region 2020 & 2033
- Table 7: Global Anti-money Laundering Solution Revenue million Forecast, by Component 2020 & 2033
- Table 8: Global Anti-money Laundering Solution Revenue million Forecast, by Deployment Mode 2020 & 2033
- Table 9: Global Anti-money Laundering Solution Revenue million Forecast, by Solution 2020 & 2033
- Table 10: Global Anti-money Laundering Solution Revenue million Forecast, by Enterprise Size 2020 & 2033
- Table 11: Global Anti-money Laundering Solution Revenue million Forecast, by End User Industry 2020 & 2033
- Table 12: Global Anti-money Laundering Solution Revenue million Forecast, by Country 2020 & 2033
- Table 13: United States Anti-money Laundering Solution Revenue (million) Forecast, by Application 2020 & 2033
- Table 14: Canada Anti-money Laundering Solution Revenue (million) Forecast, by Application 2020 & 2033
- Table 15: Mexico Anti-money Laundering Solution Revenue (million) Forecast, by Application 2020 & 2033
- Table 16: Global Anti-money Laundering Solution Revenue million Forecast, by Component 2020 & 2033
- Table 17: Global Anti-money Laundering Solution Revenue million Forecast, by Deployment Mode 2020 & 2033
- Table 18: Global Anti-money Laundering Solution Revenue million Forecast, by Solution 2020 & 2033
- Table 19: Global Anti-money Laundering Solution Revenue million Forecast, by Enterprise Size 2020 & 2033
- Table 20: Global Anti-money Laundering Solution Revenue million Forecast, by End User Industry 2020 & 2033
- Table 21: Global Anti-money Laundering Solution Revenue million Forecast, by Country 2020 & 2033
- Table 22: Brazil Anti-money Laundering Solution Revenue (million) Forecast, by Application 2020 & 2033
- Table 23: Argentina Anti-money Laundering Solution Revenue (million) Forecast, by Application 2020 & 2033
- Table 24: Rest of South America Anti-money Laundering Solution Revenue (million) Forecast, by Application 2020 & 2033
- Table 25: Global Anti-money Laundering Solution Revenue million Forecast, by Component 2020 & 2033
- Table 26: Global Anti-money Laundering Solution Revenue million Forecast, by Deployment Mode 2020 & 2033
- Table 27: Global Anti-money Laundering Solution Revenue million Forecast, by Solution 2020 & 2033
- Table 28: Global Anti-money Laundering Solution Revenue million Forecast, by Enterprise Size 2020 & 2033
- Table 29: Global Anti-money Laundering Solution Revenue million Forecast, by End User Industry 2020 & 2033
- Table 30: Global Anti-money Laundering Solution Revenue million Forecast, by Country 2020 & 2033
- Table 31: United Kingdom Anti-money Laundering Solution Revenue (million) Forecast, by Application 2020 & 2033
- Table 32: Germany Anti-money Laundering Solution Revenue (million) Forecast, by Application 2020 & 2033
- Table 33: France Anti-money Laundering Solution Revenue (million) Forecast, by Application 2020 & 2033
- Table 34: Italy Anti-money Laundering Solution Revenue (million) Forecast, by Application 2020 & 2033
- Table 35: Spain Anti-money Laundering Solution Revenue (million) Forecast, by Application 2020 & 2033
- Table 36: Russia Anti-money Laundering Solution Revenue (million) Forecast, by Application 2020 & 2033
- Table 37: Benelux Anti-money Laundering Solution Revenue (million) Forecast, by Application 2020 & 2033
- Table 38: Nordics Anti-money Laundering Solution Revenue (million) Forecast, by Application 2020 & 2033
- Table 39: Rest of Europe Anti-money Laundering Solution Revenue (million) Forecast, by Application 2020 & 2033
- Table 40: Global Anti-money Laundering Solution Revenue million Forecast, by Component 2020 & 2033
- Table 41: Global Anti-money Laundering Solution Revenue million Forecast, by Deployment Mode 2020 & 2033
- Table 42: Global Anti-money Laundering Solution Revenue million Forecast, by Solution 2020 & 2033
- Table 43: Global Anti-money Laundering Solution Revenue million Forecast, by Enterprise Size 2020 & 2033
- Table 44: Global Anti-money Laundering Solution Revenue million Forecast, by End User Industry 2020 & 2033
- Table 45: Global Anti-money Laundering Solution Revenue million Forecast, by Country 2020 & 2033
- Table 46: Turkey Anti-money Laundering Solution Revenue (million) Forecast, by Application 2020 & 2033
- Table 47: Israel Anti-money Laundering Solution Revenue (million) Forecast, by Application 2020 & 2033
- Table 48: GCC Anti-money Laundering Solution Revenue (million) Forecast, by Application 2020 & 2033
- Table 49: North Africa Anti-money Laundering Solution Revenue (million) Forecast, by Application 2020 & 2033
- Table 50: South Africa Anti-money Laundering Solution Revenue (million) Forecast, by Application 2020 & 2033
- Table 51: Rest of Middle East & Africa Anti-money Laundering Solution Revenue (million) Forecast, by Application 2020 & 2033
- Table 52: Global Anti-money Laundering Solution Revenue million Forecast, by Component 2020 & 2033
- Table 53: Global Anti-money Laundering Solution Revenue million Forecast, by Deployment Mode 2020 & 2033
- Table 54: Global Anti-money Laundering Solution Revenue million Forecast, by Solution 2020 & 2033
- Table 55: Global Anti-money Laundering Solution Revenue million Forecast, by Enterprise Size 2020 & 2033
- Table 56: Global Anti-money Laundering Solution Revenue million Forecast, by End User Industry 2020 & 2033
- Table 57: Global Anti-money Laundering Solution Revenue million Forecast, by Country 2020 & 2033
- Table 58: China Anti-money Laundering Solution Revenue (million) Forecast, by Application 2020 & 2033
- Table 59: India Anti-money Laundering Solution Revenue (million) Forecast, by Application 2020 & 2033
- Table 60: Japan Anti-money Laundering Solution Revenue (million) Forecast, by Application 2020 & 2033
- Table 61: South Korea Anti-money Laundering Solution Revenue (million) Forecast, by Application 2020 & 2033
- Table 62: ASEAN Anti-money Laundering Solution Revenue (million) Forecast, by Application 2020 & 2033
- Table 63: Oceania Anti-money Laundering Solution Revenue (million) Forecast, by Application 2020 & 2033
- Table 64: Rest of Asia Pacific Anti-money Laundering Solution Revenue (million) Forecast, by Application 2020 & 2033
Frequently Asked Questions
1. What is the projected Compound Annual Growth Rate (CAGR) of the Anti-money Laundering Solution?
The projected CAGR is approximately 12.6%.
2. Which companies are prominent players in the Anti-money Laundering Solution?
Key companies in the market include Oracle Corporation, BAE Systems, Accenture, NICE Actimize, Tata Consultancy Services Limited, Cognizant Technology Solutions Corporation, ACI Worldwide Inc., SAS Institute Inc., Fiserv, Inc., Open Text Corporation, Experian Information Solutions, Inc., FICO, Others.
3. What are the main segments of the Anti-money Laundering Solution?
The market segments include Component, Deployment Mode, Solution, Enterprise Size, End User Industry.
4. Can you provide details about the market size?
The market size is estimated to be USD 2783.2 million as of 2022.
5. What are some drivers contributing to market growth?
N/A
6. What are the notable trends driving market growth?
N/A
7. Are there any restraints impacting market growth?
N/A
8. Can you provide examples of recent developments in the market?
N/A
9. What pricing options are available for accessing the report?
Pricing options include single-user, multi-user, and enterprise licenses priced at USD 4900.00, USD 7350.00, and USD 9800.00 respectively.
10. Is the market size provided in terms of value or volume?
The market size is provided in terms of value, measured in million.
11. Are there any specific market keywords associated with the report?
Yes, the market keyword associated with the report is "Anti-money Laundering Solution," which aids in identifying and referencing the specific market segment covered.
12. How do I determine which pricing option suits my needs best?
The pricing options vary based on user requirements and access needs. Individual users may opt for single-user licenses, while businesses requiring broader access may choose multi-user or enterprise licenses for cost-effective access to the report.
13. Are there any additional resources or data provided in the Anti-money Laundering Solution report?
While the report offers comprehensive insights, it's advisable to review the specific contents or supplementary materials provided to ascertain if additional resources or data are available.
14. How can I stay updated on further developments or reports in the Anti-money Laundering Solution?
To stay informed about further developments, trends, and reports in the Anti-money Laundering Solution, consider subscribing to industry newsletters, following relevant companies and organizations, or regularly checking reputable industry news sources and publications.
Methodology
Step 1 - Identification of Relevant Samples Size from Population Database


Step 2 - Approaches for Defining Global Market Size (Value, Volume* & Price*)

Note*: In applicable scenarios
Step 3 - Data Sources
Primary Research
- Web Analytics
- Survey Reports
- Research Institute
- Latest Research Reports
- Opinion Leaders
Secondary Research
- Annual Reports
- White Paper
- Latest Press Release
- Industry Association
- Paid Database
- Investor Presentations

Step 4 - Data Triangulation
Involves using different sources of information in order to increase the validity of a study
These sources are likely to be stakeholders in a program - participants, other researchers, program staff, other community members, and so on.
Then we put all data in single framework & apply various statistical tools to find out the dynamic on the market.
During the analysis stage, feedback from the stakeholder groups would be compared to determine areas of agreement as well as areas of divergence