
Key Insights
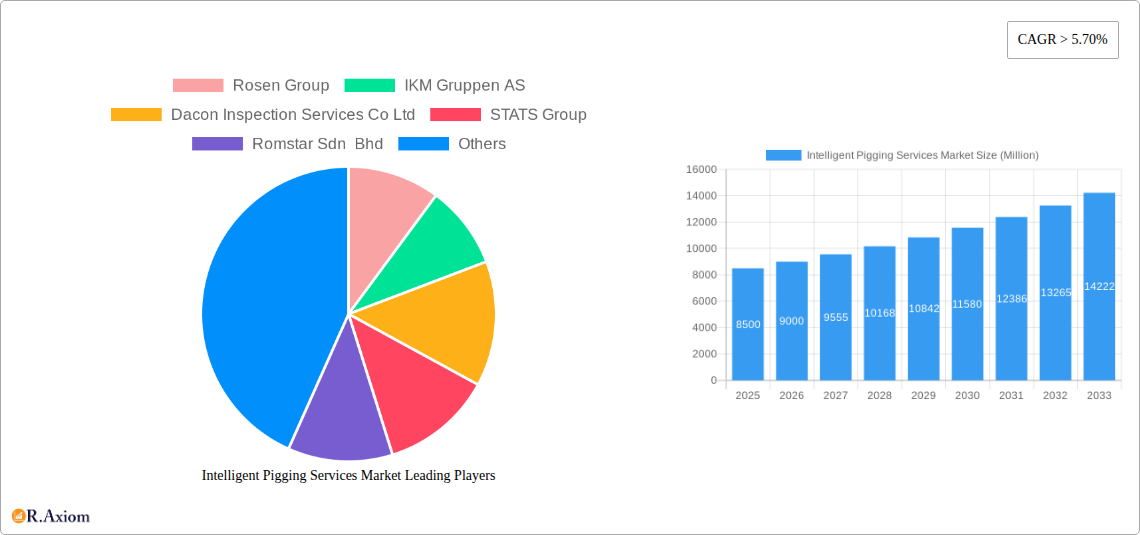
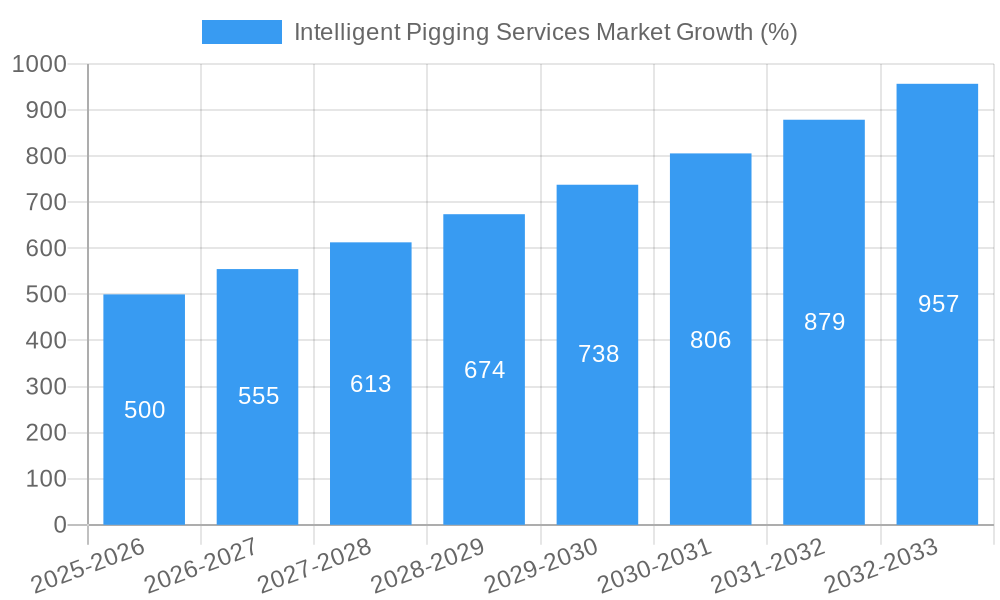
The Intelligent Pigging Services market is experiencing robust growth, driven by the increasing need for efficient and cost-effective pipeline inspection and maintenance across the oil and gas industry. The market's Compound Annual Growth Rate (CAGR) exceeding 5.70% from 2019-2024 signifies a strong upward trajectory, projected to continue into the forecast period (2025-2033). Key drivers include stringent regulatory compliance mandates emphasizing pipeline safety, the rising demand for enhanced operational efficiency in energy transportation, and the growing adoption of intelligent pigging technologies offering advanced data analysis capabilities compared to traditional methods. The market segmentation reveals a significant focus on intelligent pigging technology, showcasing its superior capabilities in crack and leakage detection, metal loss/corrosion detection, and geometry measurement compared to caliper pigging and other traditional methods. Demand is particularly high in the oil and gas pipeline segments, with geographical distribution reflecting the concentration of energy infrastructure and production activities in North America, Europe, and Asia Pacific. The competitive landscape is marked by a mix of established multinational corporations and specialized service providers, indicating a healthy level of both innovation and operational expertise. While challenges such as high initial investment costs for advanced technologies and regional variations in regulatory standards exist, the overall growth outlook remains positive, driven by the crucial role intelligent pigging plays in ensuring safe and reliable pipeline operations globally.
The continued expansion of global oil and gas infrastructure, coupled with a growing awareness of environmental concerns and the need to minimize pipeline failures, fuels further market expansion. Technological advancements leading to improved pigging technology capabilities, such as enhanced data analytics and remote monitoring, will further enhance market growth. The Asia-Pacific region, driven by rapid industrialization and energy infrastructure development, is expected to show significant growth potential. However, factors such as fluctuating oil and gas prices, and potential economic slowdowns in key regions could influence the pace of market expansion. Despite these potential headwinds, the long-term outlook for the intelligent pigging services market remains optimistic, driven by increasing industry demand for improved pipeline integrity management. We can expect continued innovation and diversification within the industry, leading to better and more efficient solutions for pipeline inspection and maintenance in the coming years.
This detailed report provides a comprehensive analysis of the Intelligent Pigging Services Market, offering actionable insights for industry stakeholders. The study covers the period 2019-2033, with 2025 as the base and estimated year, and a forecast period of 2025-2033. The report segments the market by pigging type, application, and pipeline fluid type, providing a granular understanding of market dynamics and growth potential. Key players like Rosen Group, IKM Gruppen AS, and others are analyzed for their market share and strategic initiatives. This report is essential for businesses seeking to navigate the complexities of this evolving market.
Intelligent Pigging Services Market Market Concentration & Innovation
The Intelligent Pigging Services market exhibits a moderately concentrated landscape, with a few major players holding significant market share. The top 5 companies – Rosen Group, IKM Gruppen AS, STATS Group, Dacon Inspection Services Co Ltd, and Oil States Industries – collectively account for approximately xx% of the global market in 2025. This concentration is driven by significant capital investments required for specialized equipment, expertise in data analysis, and extensive operational networks.
Market innovation is primarily focused on enhancing pigging technology to improve detection accuracy, data analysis capabilities, and efficiency. This includes the development of smart pigs with advanced sensors, improved data processing algorithms for faster and more precise results, and integration of automation and robotics for improved efficiency.
Regulatory frameworks, particularly concerning pipeline safety and environmental protection, significantly influence market growth. Stringent regulations drive demand for advanced intelligent pigging services to ensure compliance and prevent pipeline failures. Substitute technologies, such as conventional pipeline inspections, exist; however, intelligent pigging offers superior accuracy, efficiency, and cost-effectiveness for certain applications, especially in complex pipeline networks.
End-user trends indicate a growing preference for data-driven solutions and predictive maintenance strategies. Pipeline operators increasingly rely on intelligent pigging data to optimize maintenance schedules, reduce downtime, and prevent costly repairs. Mergers and acquisitions (M&A) activity in the industry is moderate, primarily driven by companies seeking to expand their service portfolios, geographic reach, and technological capabilities. Recent M&A deals have involved values ranging from xx Million to xx Million, facilitating market consolidation and driving technological advancements.
Intelligent Pigging Services Market Industry Trends & Insights
The Intelligent Pigging Services market is projected to experience a Compound Annual Growth Rate (CAGR) of xx% during the forecast period (2025-2033). This growth is fueled by several factors, including increasing global energy demand, the expansion of pipeline infrastructure, and stringent regulations concerning pipeline safety and environmental protection. Technological advancements, particularly in sensor technology, data analytics, and automation, are driving improvements in pigging efficiency and accuracy. The market penetration of intelligent pigging technology is steadily increasing across various pipeline applications, owing to its ability to provide detailed pipeline condition assessments, enabling proactive maintenance and minimizing the risk of costly failures. Competitive dynamics are characterized by a combination of intense rivalry among established players and the emergence of specialized niche players offering innovative solutions. The increasing adoption of digitalization and the integration of intelligent pigging data with other pipeline monitoring systems are also driving significant market growth. This trend is particularly evident in the oil and gas sector where safety concerns and efficiency gains are paramount. Market growth is unevenly distributed, with the highest growth rates observed in rapidly developing economies with significant pipeline infrastructure expansion.
Dominant Markets & Segments in Intelligent Pigging Services Market
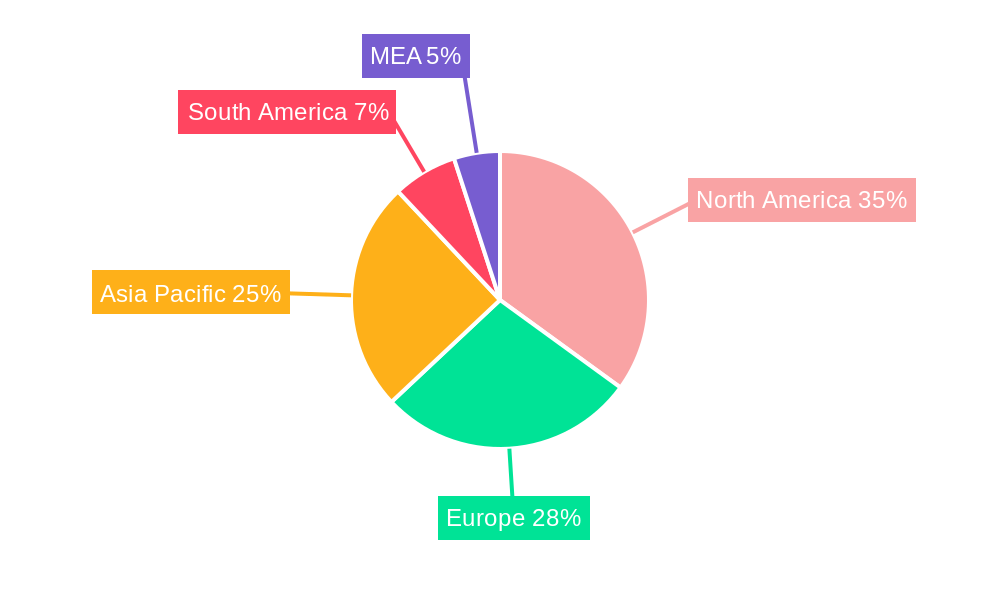
Dominant Region/Country: North America currently holds the largest market share in the intelligent pigging services market, driven by extensive pipeline networks, stringent regulatory frameworks, and high operational expenditure in the oil & gas industry. However, Asia-Pacific is projected to experience the highest growth rate during the forecast period.
Dominant Segments:
Pigging Type: Intelligent pigging holds the largest market share among all pigging types due to its enhanced capabilities in detecting various pipeline anomalies.
Application: Crack & Leakage detection and Metal Loss/Corrosion detection are the most dominant applications, largely driven by safety and regulatory concerns.
Pipeline Fluid Type: The oil and gas segment dominates the market due to the extensive use of pipelines in these industries.
Key Drivers by Segment:
- North America: Stringent safety regulations, robust oil and gas infrastructure, and established technological expertise.
- Asia-Pacific: Rapid industrialization, expanding pipeline networks to support economic growth, and increasing investment in energy infrastructure.
- Intelligent Pigging: Superior detection capabilities, improved accuracy, and cost-effectiveness compared to traditional methods.
- Crack & Leakage Detection: Safety concerns, regulatory compliance, and environmental protection mandates.
- Oil & Gas: Extensive pipeline networks and the critical need for ensuring pipeline integrity and operational safety.
Intelligent Pigging Services Market Product Developments
Recent product developments have focused on integrating advanced sensors, improved data analytics, and automation technologies into intelligent pigging tools. These advancements enhance detection accuracy, provide real-time data analysis, and minimize operational downtime. The integration of AI and machine learning algorithms further refines data interpretation, leading to faster and more precise anomaly identification. The development of smaller, more maneuverable pigs enhances accessibility to various pipeline sections, widening the applicability of intelligent pigging across a broad range of pipelines. These developments provide a competitive advantage by increasing accuracy, efficiency, and reducing overall inspection costs, making the technology more attractive to pipeline operators.
Report Scope & Segmentation Analysis
This report segments the Intelligent Pigging Services market by:
Pigging Type: Intelligent Pigging, Caliper Pigging, Others (xx Million market size in 2025, xx% CAGR). Intelligent pigging is projected to dominate with xx% market share.
Application: Crack & Leakage Detection (xx Million in 2025, xx% CAGR), Metal Loss/Corrosion Detection (xx Million in 2025, xx% CAGR), Geometry Measurement & Bend Detection (xx Million in 2025, xx% CAGR), Others (xx Million in 2025, xx% CAGR). Crack & leakage detection is the most significant application segment.
Pipeline Fluid Type: Oil (xx Million in 2025, xx% CAGR), Gas (xx Million in 2025, xx% CAGR). The oil segment is expected to retain the larger share.
Each segment's analysis includes projected market sizes, growth rates, and competitive landscapes, highlighting key players and their strategies.
Key Drivers of Intelligent Pigging Services Market Growth
Several factors propel the growth of the intelligent pigging services market. Firstly, stringent government regulations regarding pipeline safety and environmental protection mandate the use of advanced inspection techniques like intelligent pigging. Secondly, the rising demand for energy and the consequent expansion of pipeline networks create a significant need for efficient and reliable pipeline integrity management. Technological advancements, such as improved sensor technology and sophisticated data analysis, are also key drivers, improving the accuracy and efficiency of inspections. Lastly, the increasing adoption of predictive maintenance strategies within the oil and gas industry is further boosting the demand for intelligent pigging services.
Challenges in the Intelligent Pigging Services Market Sector
Despite substantial growth potential, the Intelligent Pigging Services market faces several challenges. High initial investment costs associated with specialized equipment and skilled personnel remain a barrier to entry for many companies. Furthermore, the complex nature of pipeline systems and the variety of pipeline configurations present significant technical challenges in designing and deploying effective pigging solutions. Supply chain disruptions and the availability of specialized components can also impact market growth and operational efficiency. Finally, the increasing competitiveness and the pressure to reduce costs can squeeze profit margins, making it imperative to develop cost-effective and highly efficient solutions.
Emerging Opportunities in Intelligent Pigging Services Market
Several emerging opportunities exist within the Intelligent Pigging Services market. The integration of advanced analytics, artificial intelligence, and machine learning into intelligent pigging systems is improving the accuracy and speed of anomaly detection. Furthermore, the growing adoption of digital twin technology and the integration of intelligent pigging data with other pipeline monitoring systems offer significant potential for predictive maintenance and improved asset management. The expansion of pipeline infrastructure in emerging economies presents further growth opportunities, while the development of specialized pigging solutions for specific pipeline types and fluids will further refine the technology.
Leading Players in the Intelligent Pigging Services Market Market
- Rosen Group
- IKM Gruppen AS
- Dacon Inspection Services Co Ltd
- STATS Group
- Romstar Sdn Bhd
- Penspen Limited
- Oil States Industries
- Rouge Pipeline & Process Services
- Baker Hughes Company
- Enduro Pipeline Services Inc
- Onstream Pipeline Inspection Ltd
- T D Williamson Inc
- NDT Global Services Ltd
Key Developments in Intelligent Pigging Services Market Industry
- January 2023: Rosen Group launched a new intelligent pigging system with enhanced data analytics capabilities.
- March 2022: IKM Gruppen AS acquired a smaller pigging services provider, expanding its geographic reach.
- October 2021: STATS Group introduced a new smart pig designed for improved detection of corrosion in high-pressure pipelines.
- (Add further developments with year/month and brief description)
Strategic Outlook for Intelligent Pigging Services Market Market
The Intelligent Pigging Services market is poised for significant growth, driven by increasing demand for efficient pipeline integrity management, technological advancements, and stringent regulatory compliance needs. The integration of AI, machine learning, and digitalization is expected to transform the industry. New market opportunities lie in emerging economies with expanding pipeline infrastructure, and focusing on cost-effective, highly efficient solutions will be vital for market success. The development of specialized pigging technologies for specific pipeline types and fluids will also drive market growth, enabling greater accessibility and applicability of this crucial technology.
Intelligent Pigging Services Market Segmentation
-
1. Pigging Type
-
1.1. Intelligent Pigging
- 1.1.1. Magnetic Flux Leakage (MFL) Pigging
- 1.1.2. Ultrasonic Test Pigging
- 1.1.3. Caliper Pigging
- 1.2. Others
-
1.1. Intelligent Pigging
-
2. Application
- 2.1. Crack & Leakage Detection
- 2.2. Metal Loss/Corrosion Detection
- 2.3. Geometry Measurement & Bend Detection
- 2.4. Others
-
3. Pipeline Fluid Type
- 3.1. Oil
- 3.2. Gas
Intelligent Pigging Services Market Segmentation By Geography
- 1. North America
- 2. Europe
- 3. Asia Pacific
- 4. Middle East and Africa
- 5. South America
Intelligent Pigging Services Market REPORT HIGHLIGHTS
| Aspects | Details |
|---|---|
| Study Period | 2019-2033 |
| Base Year | 2024 |
| Estimated Year | 2025 |
| Forecast Period | 2025-2033 |
| Historical Period | 2019-2024 |
| Growth Rate | CAGR of > 5.70% from 2019-2033 |
| Segmentation |
|
Table of Contents
- 1. Introduction
- 1.1. Research Scope
- 1.2. Market Segmentation
- 1.3. Research Methodology
- 1.4. Definitions and Assumptions
- 2. Executive Summary
- 2.1. Introduction
- 3. Market Dynamics
- 3.1. Introduction
- 3.2. Market Drivers
- 3.2.1. 4.; Growing Demand for Renewable Energy4.; Upcoming Investments in the Energy Sector and Supportive Renewable Energy Policies
- 3.3. Market Restrains
- 3.3.1. 4.; High Initial Investment Cost and Long Investment Return Period on Projects
- 3.4. Market Trends
- 3.4.1. Intelligent Pigging Segment to Dominate the Market
- 4. Market Factor Analysis
- 4.1. Porters Five Forces
- 4.2. Supply/Value Chain
- 4.3. PESTEL analysis
- 4.4. Market Entropy
- 4.5. Patent/Trademark Analysis
- 5. Global Intelligent Pigging Services Market Analysis, Insights and Forecast, 2019-2031
- 5.1. Market Analysis, Insights and Forecast - by Pigging Type
- 5.1.1. Intelligent Pigging
- 5.1.1.1. Magnetic Flux Leakage (MFL) Pigging
- 5.1.1.2. Ultrasonic Test Pigging
- 5.1.1.3. Caliper Pigging
- 5.1.2. Others
- 5.1.1. Intelligent Pigging
- 5.2. Market Analysis, Insights and Forecast - by Application
- 5.2.1. Crack & Leakage Detection
- 5.2.2. Metal Loss/Corrosion Detection
- 5.2.3. Geometry Measurement & Bend Detection
- 5.2.4. Others
- 5.3. Market Analysis, Insights and Forecast - by Pipeline Fluid Type
- 5.3.1. Oil
- 5.3.2. Gas
- 5.4. Market Analysis, Insights and Forecast - by Region
- 5.4.1. North America
- 5.4.2. Europe
- 5.4.3. Asia Pacific
- 5.4.4. Middle East and Africa
- 5.4.5. South America
- 5.1. Market Analysis, Insights and Forecast - by Pigging Type
- 6. North America Intelligent Pigging Services Market Analysis, Insights and Forecast, 2019-2031
- 6.1. Market Analysis, Insights and Forecast - by Pigging Type
- 6.1.1. Intelligent Pigging
- 6.1.1.1. Magnetic Flux Leakage (MFL) Pigging
- 6.1.1.2. Ultrasonic Test Pigging
- 6.1.1.3. Caliper Pigging
- 6.1.2. Others
- 6.1.1. Intelligent Pigging
- 6.2. Market Analysis, Insights and Forecast - by Application
- 6.2.1. Crack & Leakage Detection
- 6.2.2. Metal Loss/Corrosion Detection
- 6.2.3. Geometry Measurement & Bend Detection
- 6.2.4. Others
- 6.3. Market Analysis, Insights and Forecast - by Pipeline Fluid Type
- 6.3.1. Oil
- 6.3.2. Gas
- 6.1. Market Analysis, Insights and Forecast - by Pigging Type
- 7. Europe Intelligent Pigging Services Market Analysis, Insights and Forecast, 2019-2031
- 7.1. Market Analysis, Insights and Forecast - by Pigging Type
- 7.1.1. Intelligent Pigging
- 7.1.1.1. Magnetic Flux Leakage (MFL) Pigging
- 7.1.1.2. Ultrasonic Test Pigging
- 7.1.1.3. Caliper Pigging
- 7.1.2. Others
- 7.1.1. Intelligent Pigging
- 7.2. Market Analysis, Insights and Forecast - by Application
- 7.2.1. Crack & Leakage Detection
- 7.2.2. Metal Loss/Corrosion Detection
- 7.2.3. Geometry Measurement & Bend Detection
- 7.2.4. Others
- 7.3. Market Analysis, Insights and Forecast - by Pipeline Fluid Type
- 7.3.1. Oil
- 7.3.2. Gas
- 7.1. Market Analysis, Insights and Forecast - by Pigging Type
- 8. Asia Pacific Intelligent Pigging Services Market Analysis, Insights and Forecast, 2019-2031
- 8.1. Market Analysis, Insights and Forecast - by Pigging Type
- 8.1.1. Intelligent Pigging
- 8.1.1.1. Magnetic Flux Leakage (MFL) Pigging
- 8.1.1.2. Ultrasonic Test Pigging
- 8.1.1.3. Caliper Pigging
- 8.1.2. Others
- 8.1.1. Intelligent Pigging
- 8.2. Market Analysis, Insights and Forecast - by Application
- 8.2.1. Crack & Leakage Detection
- 8.2.2. Metal Loss/Corrosion Detection
- 8.2.3. Geometry Measurement & Bend Detection
- 8.2.4. Others
- 8.3. Market Analysis, Insights and Forecast - by Pipeline Fluid Type
- 8.3.1. Oil
- 8.3.2. Gas
- 8.1. Market Analysis, Insights and Forecast - by Pigging Type
- 9. Middle East and Africa Intelligent Pigging Services Market Analysis, Insights and Forecast, 2019-2031
- 9.1. Market Analysis, Insights and Forecast - by Pigging Type
- 9.1.1. Intelligent Pigging
- 9.1.1.1. Magnetic Flux Leakage (MFL) Pigging
- 9.1.1.2. Ultrasonic Test Pigging
- 9.1.1.3. Caliper Pigging
- 9.1.2. Others
- 9.1.1. Intelligent Pigging
- 9.2. Market Analysis, Insights and Forecast - by Application
- 9.2.1. Crack & Leakage Detection
- 9.2.2. Metal Loss/Corrosion Detection
- 9.2.3. Geometry Measurement & Bend Detection
- 9.2.4. Others
- 9.3. Market Analysis, Insights and Forecast - by Pipeline Fluid Type
- 9.3.1. Oil
- 9.3.2. Gas
- 9.1. Market Analysis, Insights and Forecast - by Pigging Type
- 10. South America Intelligent Pigging Services Market Analysis, Insights and Forecast, 2019-2031
- 10.1. Market Analysis, Insights and Forecast - by Pigging Type
- 10.1.1. Intelligent Pigging
- 10.1.1.1. Magnetic Flux Leakage (MFL) Pigging
- 10.1.1.2. Ultrasonic Test Pigging
- 10.1.1.3. Caliper Pigging
- 10.1.2. Others
- 10.1.1. Intelligent Pigging
- 10.2. Market Analysis, Insights and Forecast - by Application
- 10.2.1. Crack & Leakage Detection
- 10.2.2. Metal Loss/Corrosion Detection
- 10.2.3. Geometry Measurement & Bend Detection
- 10.2.4. Others
- 10.3. Market Analysis, Insights and Forecast - by Pipeline Fluid Type
- 10.3.1. Oil
- 10.3.2. Gas
- 10.1. Market Analysis, Insights and Forecast - by Pigging Type
- 11. North America Intelligent Pigging Services Market Analysis, Insights and Forecast, 2019-2031
- 11.1. Market Analysis, Insights and Forecast - By Country/Sub-region
- 11.1.1 United States
- 11.1.2 Canada
- 11.1.3 Mexico
- 12. Europe Intelligent Pigging Services Market Analysis, Insights and Forecast, 2019-2031
- 12.1. Market Analysis, Insights and Forecast - By Country/Sub-region
- 12.1.1 Germany
- 12.1.2 United Kingdom
- 12.1.3 France
- 12.1.4 Spain
- 12.1.5 Italy
- 12.1.6 Spain
- 12.1.7 Belgium
- 12.1.8 Netherland
- 12.1.9 Nordics
- 12.1.10 Rest of Europe
- 13. Asia Pacific Intelligent Pigging Services Market Analysis, Insights and Forecast, 2019-2031
- 13.1. Market Analysis, Insights and Forecast - By Country/Sub-region
- 13.1.1 China
- 13.1.2 Japan
- 13.1.3 India
- 13.1.4 South Korea
- 13.1.5 Southeast Asia
- 13.1.6 Australia
- 13.1.7 Indonesia
- 13.1.8 Phillipes
- 13.1.9 Singapore
- 13.1.10 Thailandc
- 13.1.11 Rest of Asia Pacific
- 14. South America Intelligent Pigging Services Market Analysis, Insights and Forecast, 2019-2031
- 14.1. Market Analysis, Insights and Forecast - By Country/Sub-region
- 14.1.1 Brazil
- 14.1.2 Argentina
- 14.1.3 Peru
- 14.1.4 Chile
- 14.1.5 Colombia
- 14.1.6 Ecuador
- 14.1.7 Venezuela
- 14.1.8 Rest of South America
- 15. MEA Intelligent Pigging Services Market Analysis, Insights and Forecast, 2019-2031
- 15.1. Market Analysis, Insights and Forecast - By Country/Sub-region
- 15.1.1 United Arab Emirates
- 15.1.2 Saudi Arabia
- 15.1.3 South Africa
- 15.1.4 Rest of Middle East and Africa
- 16. Competitive Analysis
- 16.1. Global Market Share Analysis 2024
- 16.2. Company Profiles
- 16.2.1 Rosen Group
- 16.2.1.1. Overview
- 16.2.1.2. Products
- 16.2.1.3. SWOT Analysis
- 16.2.1.4. Recent Developments
- 16.2.1.5. Financials (Based on Availability)
- 16.2.2 IKM Gruppen AS
- 16.2.2.1. Overview
- 16.2.2.2. Products
- 16.2.2.3. SWOT Analysis
- 16.2.2.4. Recent Developments
- 16.2.2.5. Financials (Based on Availability)
- 16.2.3 Dacon Inspection Services Co Ltd
- 16.2.3.1. Overview
- 16.2.3.2. Products
- 16.2.3.3. SWOT Analysis
- 16.2.3.4. Recent Developments
- 16.2.3.5. Financials (Based on Availability)
- 16.2.4 STATS Group
- 16.2.4.1. Overview
- 16.2.4.2. Products
- 16.2.4.3. SWOT Analysis
- 16.2.4.4. Recent Developments
- 16.2.4.5. Financials (Based on Availability)
- 16.2.5 Romstar Sdn Bhd
- 16.2.5.1. Overview
- 16.2.5.2. Products
- 16.2.5.3. SWOT Analysis
- 16.2.5.4. Recent Developments
- 16.2.5.5. Financials (Based on Availability)
- 16.2.6 Penspen Limited
- 16.2.6.1. Overview
- 16.2.6.2. Products
- 16.2.6.3. SWOT Analysis
- 16.2.6.4. Recent Developments
- 16.2.6.5. Financials (Based on Availability)
- 16.2.7 Oil States Industries
- 16.2.7.1. Overview
- 16.2.7.2. Products
- 16.2.7.3. SWOT Analysis
- 16.2.7.4. Recent Developments
- 16.2.7.5. Financials (Based on Availability)
- 16.2.8 Rouge Pipeline & Process Services
- 16.2.8.1. Overview
- 16.2.8.2. Products
- 16.2.8.3. SWOT Analysis
- 16.2.8.4. Recent Developments
- 16.2.8.5. Financials (Based on Availability)
- 16.2.9 Baker Hughes Company
- 16.2.9.1. Overview
- 16.2.9.2. Products
- 16.2.9.3. SWOT Analysis
- 16.2.9.4. Recent Developments
- 16.2.9.5. Financials (Based on Availability)
- 16.2.10 Enduro Pipeline Services Inc
- 16.2.10.1. Overview
- 16.2.10.2. Products
- 16.2.10.3. SWOT Analysis
- 16.2.10.4. Recent Developments
- 16.2.10.5. Financials (Based on Availability)
- 16.2.11 Onstream Pipeline Inspection Ltd
- 16.2.11.1. Overview
- 16.2.11.2. Products
- 16.2.11.3. SWOT Analysis
- 16.2.11.4. Recent Developments
- 16.2.11.5. Financials (Based on Availability)
- 16.2.12 T D Williamson Inc
- 16.2.12.1. Overview
- 16.2.12.2. Products
- 16.2.12.3. SWOT Analysis
- 16.2.12.4. Recent Developments
- 16.2.12.5. Financials (Based on Availability)
- 16.2.13 NDT Global Services Ltd
- 16.2.13.1. Overview
- 16.2.13.2. Products
- 16.2.13.3. SWOT Analysis
- 16.2.13.4. Recent Developments
- 16.2.13.5. Financials (Based on Availability)
- 16.2.1 Rosen Group
List of Figures
- Figure 1: Global Intelligent Pigging Services Market Revenue Breakdown (Million, %) by Region 2024 & 2032
- Figure 2: North America Intelligent Pigging Services Market Revenue (Million), by Country 2024 & 2032
- Figure 3: North America Intelligent Pigging Services Market Revenue Share (%), by Country 2024 & 2032
- Figure 4: Europe Intelligent Pigging Services Market Revenue (Million), by Country 2024 & 2032
- Figure 5: Europe Intelligent Pigging Services Market Revenue Share (%), by Country 2024 & 2032
- Figure 6: Asia Pacific Intelligent Pigging Services Market Revenue (Million), by Country 2024 & 2032
- Figure 7: Asia Pacific Intelligent Pigging Services Market Revenue Share (%), by Country 2024 & 2032
- Figure 8: South America Intelligent Pigging Services Market Revenue (Million), by Country 2024 & 2032
- Figure 9: South America Intelligent Pigging Services Market Revenue Share (%), by Country 2024 & 2032
- Figure 10: MEA Intelligent Pigging Services Market Revenue (Million), by Country 2024 & 2032
- Figure 11: MEA Intelligent Pigging Services Market Revenue Share (%), by Country 2024 & 2032
- Figure 12: North America Intelligent Pigging Services Market Revenue (Million), by Pigging Type 2024 & 2032
- Figure 13: North America Intelligent Pigging Services Market Revenue Share (%), by Pigging Type 2024 & 2032
- Figure 14: North America Intelligent Pigging Services Market Revenue (Million), by Application 2024 & 2032
- Figure 15: North America Intelligent Pigging Services Market Revenue Share (%), by Application 2024 & 2032
- Figure 16: North America Intelligent Pigging Services Market Revenue (Million), by Pipeline Fluid Type 2024 & 2032
- Figure 17: North America Intelligent Pigging Services Market Revenue Share (%), by Pipeline Fluid Type 2024 & 2032
- Figure 18: North America Intelligent Pigging Services Market Revenue (Million), by Country 2024 & 2032
- Figure 19: North America Intelligent Pigging Services Market Revenue Share (%), by Country 2024 & 2032
- Figure 20: Europe Intelligent Pigging Services Market Revenue (Million), by Pigging Type 2024 & 2032
- Figure 21: Europe Intelligent Pigging Services Market Revenue Share (%), by Pigging Type 2024 & 2032
- Figure 22: Europe Intelligent Pigging Services Market Revenue (Million), by Application 2024 & 2032
- Figure 23: Europe Intelligent Pigging Services Market Revenue Share (%), by Application 2024 & 2032
- Figure 24: Europe Intelligent Pigging Services Market Revenue (Million), by Pipeline Fluid Type 2024 & 2032
- Figure 25: Europe Intelligent Pigging Services Market Revenue Share (%), by Pipeline Fluid Type 2024 & 2032
- Figure 26: Europe Intelligent Pigging Services Market Revenue (Million), by Country 2024 & 2032
- Figure 27: Europe Intelligent Pigging Services Market Revenue Share (%), by Country 2024 & 2032
- Figure 28: Asia Pacific Intelligent Pigging Services Market Revenue (Million), by Pigging Type 2024 & 2032
- Figure 29: Asia Pacific Intelligent Pigging Services Market Revenue Share (%), by Pigging Type 2024 & 2032
- Figure 30: Asia Pacific Intelligent Pigging Services Market Revenue (Million), by Application 2024 & 2032
- Figure 31: Asia Pacific Intelligent Pigging Services Market Revenue Share (%), by Application 2024 & 2032
- Figure 32: Asia Pacific Intelligent Pigging Services Market Revenue (Million), by Pipeline Fluid Type 2024 & 2032
- Figure 33: Asia Pacific Intelligent Pigging Services Market Revenue Share (%), by Pipeline Fluid Type 2024 & 2032
- Figure 34: Asia Pacific Intelligent Pigging Services Market Revenue (Million), by Country 2024 & 2032
- Figure 35: Asia Pacific Intelligent Pigging Services Market Revenue Share (%), by Country 2024 & 2032
- Figure 36: Middle East and Africa Intelligent Pigging Services Market Revenue (Million), by Pigging Type 2024 & 2032
- Figure 37: Middle East and Africa Intelligent Pigging Services Market Revenue Share (%), by Pigging Type 2024 & 2032
- Figure 38: Middle East and Africa Intelligent Pigging Services Market Revenue (Million), by Application 2024 & 2032
- Figure 39: Middle East and Africa Intelligent Pigging Services Market Revenue Share (%), by Application 2024 & 2032
- Figure 40: Middle East and Africa Intelligent Pigging Services Market Revenue (Million), by Pipeline Fluid Type 2024 & 2032
- Figure 41: Middle East and Africa Intelligent Pigging Services Market Revenue Share (%), by Pipeline Fluid Type 2024 & 2032
- Figure 42: Middle East and Africa Intelligent Pigging Services Market Revenue (Million), by Country 2024 & 2032
- Figure 43: Middle East and Africa Intelligent Pigging Services Market Revenue Share (%), by Country 2024 & 2032
- Figure 44: South America Intelligent Pigging Services Market Revenue (Million), by Pigging Type 2024 & 2032
- Figure 45: South America Intelligent Pigging Services Market Revenue Share (%), by Pigging Type 2024 & 2032
- Figure 46: South America Intelligent Pigging Services Market Revenue (Million), by Application 2024 & 2032
- Figure 47: South America Intelligent Pigging Services Market Revenue Share (%), by Application 2024 & 2032
- Figure 48: South America Intelligent Pigging Services Market Revenue (Million), by Pipeline Fluid Type 2024 & 2032
- Figure 49: South America Intelligent Pigging Services Market Revenue Share (%), by Pipeline Fluid Type 2024 & 2032
- Figure 50: South America Intelligent Pigging Services Market Revenue (Million), by Country 2024 & 2032
- Figure 51: South America Intelligent Pigging Services Market Revenue Share (%), by Country 2024 & 2032
List of Tables
- Table 1: Global Intelligent Pigging Services Market Revenue Million Forecast, by Region 2019 & 2032
- Table 2: Global Intelligent Pigging Services Market Revenue Million Forecast, by Pigging Type 2019 & 2032
- Table 3: Global Intelligent Pigging Services Market Revenue Million Forecast, by Application 2019 & 2032
- Table 4: Global Intelligent Pigging Services Market Revenue Million Forecast, by Pipeline Fluid Type 2019 & 2032
- Table 5: Global Intelligent Pigging Services Market Revenue Million Forecast, by Region 2019 & 2032
- Table 6: Global Intelligent Pigging Services Market Revenue Million Forecast, by Country 2019 & 2032
- Table 7: United States Intelligent Pigging Services Market Revenue (Million) Forecast, by Application 2019 & 2032
- Table 8: Canada Intelligent Pigging Services Market Revenue (Million) Forecast, by Application 2019 & 2032
- Table 9: Mexico Intelligent Pigging Services Market Revenue (Million) Forecast, by Application 2019 & 2032
- Table 10: Global Intelligent Pigging Services Market Revenue Million Forecast, by Country 2019 & 2032
- Table 11: Germany Intelligent Pigging Services Market Revenue (Million) Forecast, by Application 2019 & 2032
- Table 12: United Kingdom Intelligent Pigging Services Market Revenue (Million) Forecast, by Application 2019 & 2032
- Table 13: France Intelligent Pigging Services Market Revenue (Million) Forecast, by Application 2019 & 2032
- Table 14: Spain Intelligent Pigging Services Market Revenue (Million) Forecast, by Application 2019 & 2032
- Table 15: Italy Intelligent Pigging Services Market Revenue (Million) Forecast, by Application 2019 & 2032
- Table 16: Spain Intelligent Pigging Services Market Revenue (Million) Forecast, by Application 2019 & 2032
- Table 17: Belgium Intelligent Pigging Services Market Revenue (Million) Forecast, by Application 2019 & 2032
- Table 18: Netherland Intelligent Pigging Services Market Revenue (Million) Forecast, by Application 2019 & 2032
- Table 19: Nordics Intelligent Pigging Services Market Revenue (Million) Forecast, by Application 2019 & 2032
- Table 20: Rest of Europe Intelligent Pigging Services Market Revenue (Million) Forecast, by Application 2019 & 2032
- Table 21: Global Intelligent Pigging Services Market Revenue Million Forecast, by Country 2019 & 2032
- Table 22: China Intelligent Pigging Services Market Revenue (Million) Forecast, by Application 2019 & 2032
- Table 23: Japan Intelligent Pigging Services Market Revenue (Million) Forecast, by Application 2019 & 2032
- Table 24: India Intelligent Pigging Services Market Revenue (Million) Forecast, by Application 2019 & 2032
- Table 25: South Korea Intelligent Pigging Services Market Revenue (Million) Forecast, by Application 2019 & 2032
- Table 26: Southeast Asia Intelligent Pigging Services Market Revenue (Million) Forecast, by Application 2019 & 2032
- Table 27: Australia Intelligent Pigging Services Market Revenue (Million) Forecast, by Application 2019 & 2032
- Table 28: Indonesia Intelligent Pigging Services Market Revenue (Million) Forecast, by Application 2019 & 2032
- Table 29: Phillipes Intelligent Pigging Services Market Revenue (Million) Forecast, by Application 2019 & 2032
- Table 30: Singapore Intelligent Pigging Services Market Revenue (Million) Forecast, by Application 2019 & 2032
- Table 31: Thailandc Intelligent Pigging Services Market Revenue (Million) Forecast, by Application 2019 & 2032
- Table 32: Rest of Asia Pacific Intelligent Pigging Services Market Revenue (Million) Forecast, by Application 2019 & 2032
- Table 33: Global Intelligent Pigging Services Market Revenue Million Forecast, by Country 2019 & 2032
- Table 34: Brazil Intelligent Pigging Services Market Revenue (Million) Forecast, by Application 2019 & 2032
- Table 35: Argentina Intelligent Pigging Services Market Revenue (Million) Forecast, by Application 2019 & 2032
- Table 36: Peru Intelligent Pigging Services Market Revenue (Million) Forecast, by Application 2019 & 2032
- Table 37: Chile Intelligent Pigging Services Market Revenue (Million) Forecast, by Application 2019 & 2032
- Table 38: Colombia Intelligent Pigging Services Market Revenue (Million) Forecast, by Application 2019 & 2032
- Table 39: Ecuador Intelligent Pigging Services Market Revenue (Million) Forecast, by Application 2019 & 2032
- Table 40: Venezuela Intelligent Pigging Services Market Revenue (Million) Forecast, by Application 2019 & 2032
- Table 41: Rest of South America Intelligent Pigging Services Market Revenue (Million) Forecast, by Application 2019 & 2032
- Table 42: Global Intelligent Pigging Services Market Revenue Million Forecast, by Country 2019 & 2032
- Table 43: United Arab Emirates Intelligent Pigging Services Market Revenue (Million) Forecast, by Application 2019 & 2032
- Table 44: Saudi Arabia Intelligent Pigging Services Market Revenue (Million) Forecast, by Application 2019 & 2032
- Table 45: South Africa Intelligent Pigging Services Market Revenue (Million) Forecast, by Application 2019 & 2032
- Table 46: Rest of Middle East and Africa Intelligent Pigging Services Market Revenue (Million) Forecast, by Application 2019 & 2032
- Table 47: Global Intelligent Pigging Services Market Revenue Million Forecast, by Pigging Type 2019 & 2032
- Table 48: Global Intelligent Pigging Services Market Revenue Million Forecast, by Application 2019 & 2032
- Table 49: Global Intelligent Pigging Services Market Revenue Million Forecast, by Pipeline Fluid Type 2019 & 2032
- Table 50: Global Intelligent Pigging Services Market Revenue Million Forecast, by Country 2019 & 2032
- Table 51: Global Intelligent Pigging Services Market Revenue Million Forecast, by Pigging Type 2019 & 2032
- Table 52: Global Intelligent Pigging Services Market Revenue Million Forecast, by Application 2019 & 2032
- Table 53: Global Intelligent Pigging Services Market Revenue Million Forecast, by Pipeline Fluid Type 2019 & 2032
- Table 54: Global Intelligent Pigging Services Market Revenue Million Forecast, by Country 2019 & 2032
- Table 55: Global Intelligent Pigging Services Market Revenue Million Forecast, by Pigging Type 2019 & 2032
- Table 56: Global Intelligent Pigging Services Market Revenue Million Forecast, by Application 2019 & 2032
- Table 57: Global Intelligent Pigging Services Market Revenue Million Forecast, by Pipeline Fluid Type 2019 & 2032
- Table 58: Global Intelligent Pigging Services Market Revenue Million Forecast, by Country 2019 & 2032
- Table 59: Global Intelligent Pigging Services Market Revenue Million Forecast, by Pigging Type 2019 & 2032
- Table 60: Global Intelligent Pigging Services Market Revenue Million Forecast, by Application 2019 & 2032
- Table 61: Global Intelligent Pigging Services Market Revenue Million Forecast, by Pipeline Fluid Type 2019 & 2032
- Table 62: Global Intelligent Pigging Services Market Revenue Million Forecast, by Country 2019 & 2032
- Table 63: Global Intelligent Pigging Services Market Revenue Million Forecast, by Pigging Type 2019 & 2032
- Table 64: Global Intelligent Pigging Services Market Revenue Million Forecast, by Application 2019 & 2032
- Table 65: Global Intelligent Pigging Services Market Revenue Million Forecast, by Pipeline Fluid Type 2019 & 2032
- Table 66: Global Intelligent Pigging Services Market Revenue Million Forecast, by Country 2019 & 2032
Frequently Asked Questions
1. What is the projected Compound Annual Growth Rate (CAGR) of the Intelligent Pigging Services Market?
The projected CAGR is approximately > 5.70%.
2. Which companies are prominent players in the Intelligent Pigging Services Market?
Key companies in the market include Rosen Group, IKM Gruppen AS, Dacon Inspection Services Co Ltd, STATS Group, Romstar Sdn Bhd, Penspen Limited, Oil States Industries, Rouge Pipeline & Process Services, Baker Hughes Company, Enduro Pipeline Services Inc, Onstream Pipeline Inspection Ltd, T D Williamson Inc, NDT Global Services Ltd.
3. What are the main segments of the Intelligent Pigging Services Market?
The market segments include Pigging Type, Application, Pipeline Fluid Type.
4. Can you provide details about the market size?
The market size is estimated to be USD XX Million as of 2022.
5. What are some drivers contributing to market growth?
4.; Growing Demand for Renewable Energy4.; Upcoming Investments in the Energy Sector and Supportive Renewable Energy Policies.
6. What are the notable trends driving market growth?
Intelligent Pigging Segment to Dominate the Market.
7. Are there any restraints impacting market growth?
4.; High Initial Investment Cost and Long Investment Return Period on Projects.
8. Can you provide examples of recent developments in the market?
N/A
9. What pricing options are available for accessing the report?
Pricing options include single-user, multi-user, and enterprise licenses priced at USD 4750, USD 5250, and USD 8750 respectively.
10. Is the market size provided in terms of value or volume?
The market size is provided in terms of value, measured in Million.
11. Are there any specific market keywords associated with the report?
Yes, the market keyword associated with the report is "Intelligent Pigging Services Market," which aids in identifying and referencing the specific market segment covered.
12. How do I determine which pricing option suits my needs best?
The pricing options vary based on user requirements and access needs. Individual users may opt for single-user licenses, while businesses requiring broader access may choose multi-user or enterprise licenses for cost-effective access to the report.
13. Are there any additional resources or data provided in the Intelligent Pigging Services Market report?
While the report offers comprehensive insights, it's advisable to review the specific contents or supplementary materials provided to ascertain if additional resources or data are available.
14. How can I stay updated on further developments or reports in the Intelligent Pigging Services Market?
To stay informed about further developments, trends, and reports in the Intelligent Pigging Services Market, consider subscribing to industry newsletters, following relevant companies and organizations, or regularly checking reputable industry news sources and publications.
Methodology
Step 1 - Identification of Relevant Samples Size from Population Database


Step 2 - Approaches for Defining Global Market Size (Value, Volume* & Price*)

Note*: In applicable scenarios
Step 3 - Data Sources
Primary Research
- Web Analytics
- Survey Reports
- Research Institute
- Latest Research Reports
- Opinion Leaders
Secondary Research
- Annual Reports
- White Paper
- Latest Press Release
- Industry Association
- Paid Database
- Investor Presentations

Step 4 - Data Triangulation
Involves using different sources of information in order to increase the validity of a study
These sources are likely to be stakeholders in a program - participants, other researchers, program staff, other community members, and so on.
Then we put all data in single framework & apply various statistical tools to find out the dynamic on the market.
During the analysis stage, feedback from the stakeholder groups would be compared to determine areas of agreement as well as areas of divergence


