
Key Insights
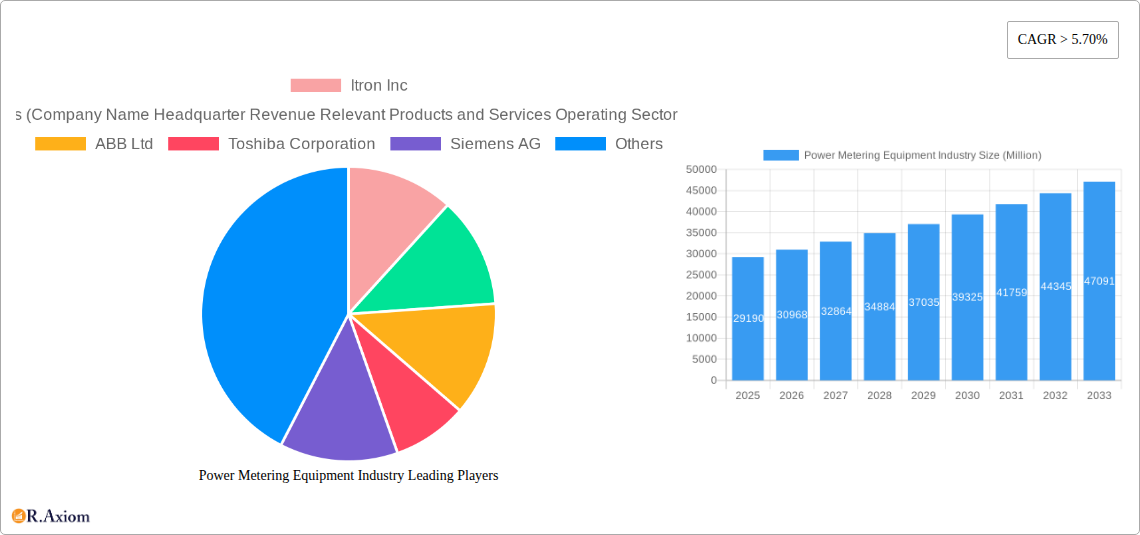
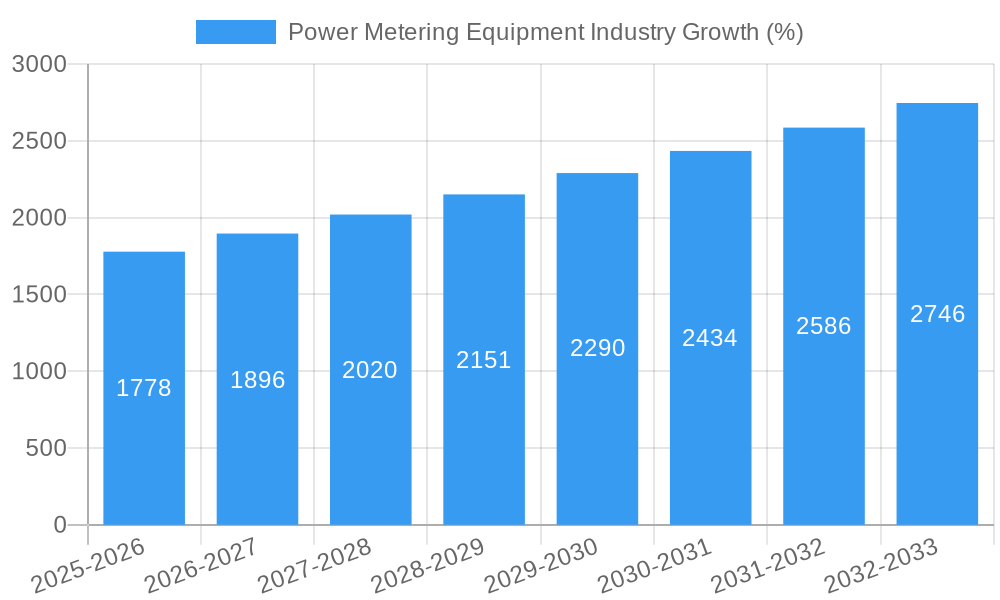
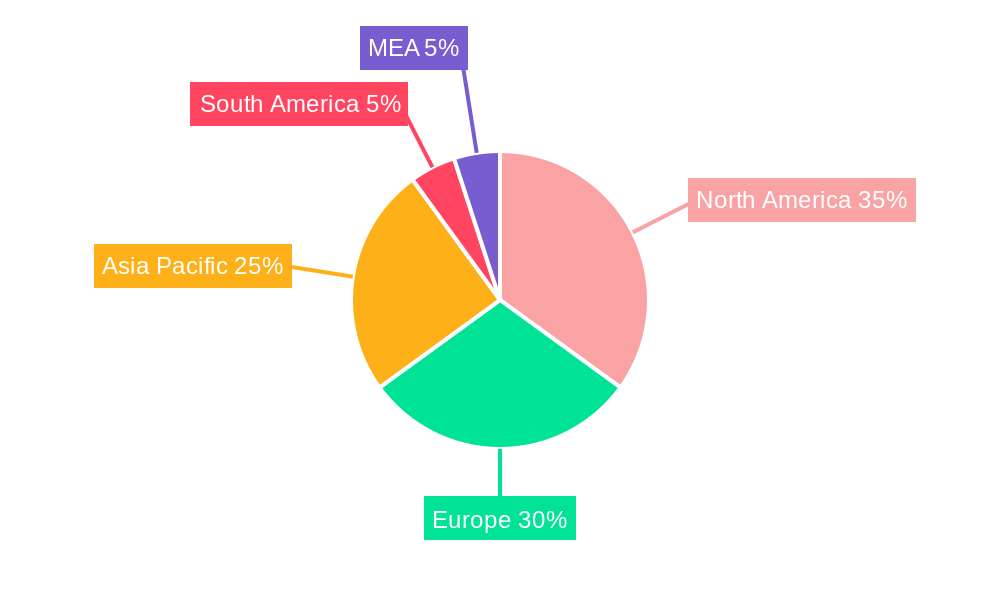
The global power metering equipment market, valued at $29.19 billion in 2025, is experiencing robust growth, projected to expand at a Compound Annual Growth Rate (CAGR) exceeding 5.70% from 2025 to 2033. This expansion is driven by several key factors. The increasing adoption of smart meters across residential, commercial, and industrial sectors is a significant catalyst. Smart meters offer enhanced energy efficiency monitoring, reduced energy theft, and improved grid management capabilities, making them highly attractive to utilities and consumers alike. Furthermore, stringent government regulations promoting energy conservation and renewable energy integration are compelling the widespread adoption of advanced metering infrastructure (AMI). Technological advancements, such as the development of more accurate and reliable digital and smart meters, further contribute to market growth. The growth is not uniform across all segments; the smart meter segment is experiencing the fastest growth rate due to its advanced features and benefits. Regional variations also exist, with North America and Europe currently holding significant market shares, though the Asia-Pacific region is expected to witness substantial growth in the coming years due to rapid urbanization and industrialization.
While the market presents substantial opportunities, certain challenges exist. High initial investment costs associated with smart meter deployments can hinder adoption, especially in developing economies. Concerns about data security and privacy related to smart meter data collection also pose a potential restraint. However, ongoing technological advancements are addressing these concerns, leading to the development of more secure and cost-effective solutions. The competitive landscape is characterized by the presence of both established players like Itron, Honeywell, ABB, Siemens, and Schneider Electric, and emerging companies introducing innovative technologies and solutions. This competition fosters innovation and drives down costs, ultimately benefiting consumers and utilities. The overall outlook for the power metering equipment market remains positive, with consistent growth anticipated throughout the forecast period, driven by technological progress and supportive regulatory frameworks.
This comprehensive report provides a detailed analysis of the global power metering equipment industry, covering market size, segmentation, growth drivers, challenges, and key players. The study period spans from 2019 to 2033, with 2025 as the base and estimated year. The report offers actionable insights for industry stakeholders, including manufacturers, investors, and policymakers.
Power Metering Equipment Industry Market Concentration & Innovation
The power metering equipment market exhibits a moderately concentrated landscape, dominated by a handful of multinational corporations alongside numerous regional players. Market share analysis reveals Itron Inc. and Honeywell International as leading players, commanding a combined xx% market share in 2024 (estimated). This concentration stems from significant R&D investments, economies of scale, and established distribution networks. However, the market is witnessing increasing innovation, driven by the growing adoption of smart meters and advancements in communication technologies.
- Market Concentration: High, with top 5 players accounting for xx% of global revenue in 2024.
- Innovation Drivers: Smart grid initiatives, increasing energy efficiency mandates, and the demand for real-time data analytics.
- Regulatory Frameworks: Stringent regulations regarding metering accuracy and data security are shaping market dynamics.
- Product Substitutes: Limited substitutes exist, with the primary competition stemming from alternative energy monitoring solutions.
- End-User Trends: Shift towards smart meters is driving market growth across residential, commercial, and industrial sectors.
- M&A Activities: Significant M&A activity observed in the recent past, with deal values exceeding USD xx billion in the last five years. These acquisitions have primarily focused on expanding product portfolios and geographic reach.
Power Metering Equipment Industry Industry Trends & Insights
The global power metering equipment market is experiencing robust growth, driven by the increasing demand for smart grid technologies and the rising focus on energy efficiency. The market is projected to witness a Compound Annual Growth Rate (CAGR) of xx% during the forecast period (2025-2033), expanding from USD xx billion in 2025 to USD xx billion by 2033. This growth is fueled by several factors, including governmental initiatives promoting smart meter deployments, the increasing adoption of renewable energy sources, and the growing need for accurate and reliable energy consumption data. Technological disruptions, such as the development of advanced metering infrastructure (AMI) and the integration of artificial intelligence (AI) and machine learning (ML) algorithms, are further accelerating market growth. Consumer preferences are also shifting towards smart, energy-efficient solutions, bolstering market demand. Intense competition among established players and emerging companies is further driving innovation and product development. Market penetration of smart meters remains relatively low in several regions, presenting significant growth opportunities.
Dominant Markets & Segments in Power Metering Equipment Industry
The Asia-Pacific region is projected to dominate the power metering equipment market during the forecast period, driven by large-scale infrastructure development, increasing urbanization, and government support for smart grid initiatives. China and India are key growth markets within this region. The Smart Meter National Program (SMNP) in India, aiming to replace 250 million meters, significantly contributes to this dominance.
- Dominant Region: Asia-Pacific
- Key Drivers (Asia-Pacific): Government initiatives (e.g., SMNP in India), rising energy consumption, increasing urbanization, expanding industrialization.
- Dominant Segment (End-User): Industrial and Commercial, due to higher electricity consumption and the need for advanced metering solutions.
- Dominant Segment (Technology): Smart meters are witnessing the highest growth, driven by their advanced features and capabilities.
The North American and European markets are also significant, characterized by a higher penetration of smart meters and robust regulatory frameworks supporting energy efficiency.
Power Metering Equipment Industry Product Developments
Recent product innovations focus on enhancing the functionalities of smart meters, incorporating features like advanced data analytics, remote monitoring capabilities, and improved security protocols. The integration of communication technologies, such as LTE-M and NB-IoT, is enabling wider network coverage and improved data transmission. These advancements are improving the efficiency of energy management systems, contributing to reduced energy waste and enhanced grid stability. The market is also witnessing the emergence of new applications for power metering equipment, including grid optimization, demand-side management, and energy theft detection.
Report Scope & Segmentation Analysis
This report segments the power metering equipment market based on end-user (Residential, Commercial, Industrial) and technology (Analog Meters, Digital Meters, Smart Meters). Each segment's market size, growth projections, and competitive dynamics are analyzed in detail. The residential segment is expected to experience steady growth, while the commercial and industrial segments are anticipated to showcase faster expansion rates due to rising energy demand and focus on operational efficiency. Smart meters are expected to experience the highest growth across all end-user segments, driven by increasing government initiatives and consumer preference. The market for analog and digital meters, while mature, will continue to have a presence, particularly in regions with limited infrastructure.
Key Drivers of Power Metering Equipment Industry Growth
Several factors are driving the growth of the power metering equipment market. Smart grid modernization initiatives across the globe are a key driver, pushing for advanced metering infrastructure (AMI) deployment. Rising energy prices and the growing need for energy efficiency are also fueling demand. Government regulations mandating smart meter installations, particularly in developing economies, are significantly impacting market growth. Furthermore, advancements in communication technologies and data analytics are enhancing the capabilities of power metering equipment, further stimulating growth.
Challenges in the Power Metering Equipment Industry Sector
The power metering equipment industry faces several challenges. High initial investment costs associated with smart meter deployment can hinder adoption, particularly in developing countries. Concerns over data security and privacy related to smart meters pose a significant challenge. Supply chain disruptions and the increasing cost of raw materials can impact profitability. Intense competition among established players and emerging technologies puts pressure on profit margins. Regulatory hurdles and varying standards across different regions also pose implementation challenges.
Emerging Opportunities in Power Metering Equipment Industry
The power metering equipment market presents several promising opportunities. The expansion of smart grid infrastructure in developing nations offers vast growth potential. The integration of renewable energy sources, such as solar and wind power, creates demand for sophisticated metering solutions. The increasing focus on distributed energy resources (DERs) is driving the adoption of advanced metering technologies. The development of new data analytics capabilities, such as predictive maintenance and energy theft detection, presents further opportunities.
Leading Players in the Power Metering Equipment Industry Market
- Itron Inc.
- Honeywell International
- ABB Ltd
- Toshiba Corporation
- Siemens AG
- Schneider Electric SE
- Kamstrup AS
- Eaton Corporation PLC
- Aclara Technologies LLC
- General Electric Company
Key Developments in Power Metering Equipment Industry Industry
- March 2024: Government of India announces the Smart Meter National Program (SMNP), aiming to replace 250 million conventional meters with smart meters, representing a USD 17.97 billion investment. This significantly impacts market growth in India.
- February 2024: Power regulator Enre in Buenos Aires establishes a public-private working group to accelerate smart meter deployment, further boosting AMI adoption in Argentina.
Strategic Outlook for Power Metering Equipment Industry Market
The power metering equipment market is poised for substantial growth over the next decade, driven by ongoing smart grid initiatives globally and the increasing need for efficient energy management. The continued innovation in smart metering technology, coupled with favorable government policies and rising consumer demand for energy-efficient solutions, will be key growth catalysts. The market presents considerable opportunities for established players and new entrants alike, with significant potential for expansion in developing economies and emerging applications for advanced metering solutions.
Power Metering Equipment Industry Segmentation
-
1. End User
- 1.1. Residential
- 1.2. Commercial
- 1.3. Industrial
-
2. Technology
- 2.1. Analog Meters
- 2.2. Digital Meters
- 2.3. Smart Meters
Power Metering Equipment Industry Segmentation By Geography
-
1. North America
- 1.1. United States
- 1.2. Canada
- 1.3. Rest of North America
-
2. Asia Pacific
- 2.1. China
- 2.2. India
- 2.3. Japan
- 2.4. South Korea
- 2.5. Malaysia
- 2.6. Thailand
- 2.7. Indonesia
- 2.8. Vietnam
- 2.9. Rest of Asia Pacific
-
3. Europe
- 3.1. Germany
- 3.2. France
- 3.3. United Kingdom
- 3.4. Spain
- 3.5. Nordic
- 3.6. Turkey
- 3.7. Russia
- 3.8. Rest of Europe
-
4. South America
- 4.1. Brazil
- 4.2. Argentina
- 4.3. Colombia
- 4.4. Rest of South America
-
5. Middle East and Africa
- 5.1. Saudi Arabia
- 5.2. United Arab Emirates
- 5.3. Qatar
- 5.4. South Africa
- 5.5. Nigeria
- 5.6. Oman
- 5.7. Egypt
- 5.8. Algeria
- 5.9. Rest of Middle East and Africa
Power Metering Equipment Industry REPORT HIGHLIGHTS
| Aspects | Details |
|---|---|
| Study Period | 2019-2033 |
| Base Year | 2024 |
| Estimated Year | 2025 |
| Forecast Period | 2025-2033 |
| Historical Period | 2019-2024 |
| Growth Rate | CAGR of > 5.70% from 2019-2033 |
| Segmentation |
|
Table of Contents
- 1. Introduction
- 1.1. Research Scope
- 1.2. Market Segmentation
- 1.3. Research Methodology
- 1.4. Definitions and Assumptions
- 2. Executive Summary
- 2.1. Introduction
- 3. Market Dynamics
- 3.1. Introduction
- 3.2. Market Drivers
- 3.2.1. 4.; Increasing Government Focus on the Development of Smart Grid Infrastructure 4.; Increase in Investments to Deploy Smart Meters
- 3.3. Market Restrains
- 3.3.1. 4.; Issues Related to Privacy and Standardization of Power Meters
- 3.4. Market Trends
- 3.4.1. Smart Meters Technology is Expected to Dominate the Market during the Forecast Period
- 4. Market Factor Analysis
- 4.1. Porters Five Forces
- 4.2. Supply/Value Chain
- 4.3. PESTEL analysis
- 4.4. Market Entropy
- 4.5. Patent/Trademark Analysis
- 5. Global Power Metering Equipment Industry Analysis, Insights and Forecast, 2019-2031
- 5.1. Market Analysis, Insights and Forecast - by End User
- 5.1.1. Residential
- 5.1.2. Commercial
- 5.1.3. Industrial
- 5.2. Market Analysis, Insights and Forecast - by Technology
- 5.2.1. Analog Meters
- 5.2.2. Digital Meters
- 5.2.3. Smart Meters
- 5.3. Market Analysis, Insights and Forecast - by Region
- 5.3.1. North America
- 5.3.2. Asia Pacific
- 5.3.3. Europe
- 5.3.4. South America
- 5.3.5. Middle East and Africa
- 5.1. Market Analysis, Insights and Forecast - by End User
- 6. North America Power Metering Equipment Industry Analysis, Insights and Forecast, 2019-2031
- 6.1. Market Analysis, Insights and Forecast - by End User
- 6.1.1. Residential
- 6.1.2. Commercial
- 6.1.3. Industrial
- 6.2. Market Analysis, Insights and Forecast - by Technology
- 6.2.1. Analog Meters
- 6.2.2. Digital Meters
- 6.2.3. Smart Meters
- 6.1. Market Analysis, Insights and Forecast - by End User
- 7. Asia Pacific Power Metering Equipment Industry Analysis, Insights and Forecast, 2019-2031
- 7.1. Market Analysis, Insights and Forecast - by End User
- 7.1.1. Residential
- 7.1.2. Commercial
- 7.1.3. Industrial
- 7.2. Market Analysis, Insights and Forecast - by Technology
- 7.2.1. Analog Meters
- 7.2.2. Digital Meters
- 7.2.3. Smart Meters
- 7.1. Market Analysis, Insights and Forecast - by End User
- 8. Europe Power Metering Equipment Industry Analysis, Insights and Forecast, 2019-2031
- 8.1. Market Analysis, Insights and Forecast - by End User
- 8.1.1. Residential
- 8.1.2. Commercial
- 8.1.3. Industrial
- 8.2. Market Analysis, Insights and Forecast - by Technology
- 8.2.1. Analog Meters
- 8.2.2. Digital Meters
- 8.2.3. Smart Meters
- 8.1. Market Analysis, Insights and Forecast - by End User
- 9. South America Power Metering Equipment Industry Analysis, Insights and Forecast, 2019-2031
- 9.1. Market Analysis, Insights and Forecast - by End User
- 9.1.1. Residential
- 9.1.2. Commercial
- 9.1.3. Industrial
- 9.2. Market Analysis, Insights and Forecast - by Technology
- 9.2.1. Analog Meters
- 9.2.2. Digital Meters
- 9.2.3. Smart Meters
- 9.1. Market Analysis, Insights and Forecast - by End User
- 10. Middle East and Africa Power Metering Equipment Industry Analysis, Insights and Forecast, 2019-2031
- 10.1. Market Analysis, Insights and Forecast - by End User
- 10.1.1. Residential
- 10.1.2. Commercial
- 10.1.3. Industrial
- 10.2. Market Analysis, Insights and Forecast - by Technology
- 10.2.1. Analog Meters
- 10.2.2. Digital Meters
- 10.2.3. Smart Meters
- 10.1. Market Analysis, Insights and Forecast - by End User
- 11. North America Power Metering Equipment Industry Analysis, Insights and Forecast, 2019-2031
- 11.1. Market Analysis, Insights and Forecast - By Country/Sub-region
- 11.1.1 United States
- 11.1.2 Canada
- 11.1.3 Mexico
- 12. Europe Power Metering Equipment Industry Analysis, Insights and Forecast, 2019-2031
- 12.1. Market Analysis, Insights and Forecast - By Country/Sub-region
- 12.1.1 Germany
- 12.1.2 United Kingdom
- 12.1.3 France
- 12.1.4 Spain
- 12.1.5 Italy
- 12.1.6 Spain
- 12.1.7 Belgium
- 12.1.8 Netherland
- 12.1.9 Nordics
- 12.1.10 Rest of Europe
- 13. Asia Pacific Power Metering Equipment Industry Analysis, Insights and Forecast, 2019-2031
- 13.1. Market Analysis, Insights and Forecast - By Country/Sub-region
- 13.1.1 China
- 13.1.2 Japan
- 13.1.3 India
- 13.1.4 South Korea
- 13.1.5 Southeast Asia
- 13.1.6 Australia
- 13.1.7 Indonesia
- 13.1.8 Phillipes
- 13.1.9 Singapore
- 13.1.10 Thailandc
- 13.1.11 Rest of Asia Pacific
- 14. South America Power Metering Equipment Industry Analysis, Insights and Forecast, 2019-2031
- 14.1. Market Analysis, Insights and Forecast - By Country/Sub-region
- 14.1.1 Brazil
- 14.1.2 Argentina
- 14.1.3 Peru
- 14.1.4 Chile
- 14.1.5 Colombia
- 14.1.6 Ecuador
- 14.1.7 Venezuela
- 14.1.8 Rest of South America
- 15. North America Power Metering Equipment Industry Analysis, Insights and Forecast, 2019-2031
- 15.1. Market Analysis, Insights and Forecast - By Country/Sub-region
- 15.1.1 United States
- 15.1.2 Canada
- 15.1.3 Mexico
- 16. MEA Power Metering Equipment Industry Analysis, Insights and Forecast, 2019-2031
- 16.1. Market Analysis, Insights and Forecast - By Country/Sub-region
- 16.1.1 United Arab Emirates
- 16.1.2 Saudi Arabia
- 16.1.3 South Africa
- 16.1.4 Rest of Middle East and Africa
- 17. Competitive Analysis
- 17.1. Global Market Share Analysis 2024
- 17.2. Company Profiles
- 17.2.1 Itron Inc
- 17.2.1.1. Overview
- 17.2.1.2. Products
- 17.2.1.3. SWOT Analysis
- 17.2.1.4. Recent Developments
- 17.2.1.5. Financials (Based on Availability)
- 17.2.2 Honeywell International*List Not Exhaustive 6 4 List of Other Prominent Companies (Company Name Headquarter Revenue Relevant Products and Services Operating Sector Recent Trends and Technology or Projects Contact Details etc )6 5 Market Ranking Analysi
- 17.2.2.1. Overview
- 17.2.2.2. Products
- 17.2.2.3. SWOT Analysis
- 17.2.2.4. Recent Developments
- 17.2.2.5. Financials (Based on Availability)
- 17.2.3 ABB Ltd
- 17.2.3.1. Overview
- 17.2.3.2. Products
- 17.2.3.3. SWOT Analysis
- 17.2.3.4. Recent Developments
- 17.2.3.5. Financials (Based on Availability)
- 17.2.4 Toshiba Corporation
- 17.2.4.1. Overview
- 17.2.4.2. Products
- 17.2.4.3. SWOT Analysis
- 17.2.4.4. Recent Developments
- 17.2.4.5. Financials (Based on Availability)
- 17.2.5 Siemens AG
- 17.2.5.1. Overview
- 17.2.5.2. Products
- 17.2.5.3. SWOT Analysis
- 17.2.5.4. Recent Developments
- 17.2.5.5. Financials (Based on Availability)
- 17.2.6 Schneider Electric SE
- 17.2.6.1. Overview
- 17.2.6.2. Products
- 17.2.6.3. SWOT Analysis
- 17.2.6.4. Recent Developments
- 17.2.6.5. Financials (Based on Availability)
- 17.2.7 Kamstrup AS
- 17.2.7.1. Overview
- 17.2.7.2. Products
- 17.2.7.3. SWOT Analysis
- 17.2.7.4. Recent Developments
- 17.2.7.5. Financials (Based on Availability)
- 17.2.8 Eaton Corporation PLC
- 17.2.8.1. Overview
- 17.2.8.2. Products
- 17.2.8.3. SWOT Analysis
- 17.2.8.4. Recent Developments
- 17.2.8.5. Financials (Based on Availability)
- 17.2.9 Aclara Technologies LLC
- 17.2.9.1. Overview
- 17.2.9.2. Products
- 17.2.9.3. SWOT Analysis
- 17.2.9.4. Recent Developments
- 17.2.9.5. Financials (Based on Availability)
- 17.2.10 General Electric Company
- 17.2.10.1. Overview
- 17.2.10.2. Products
- 17.2.10.3. SWOT Analysis
- 17.2.10.4. Recent Developments
- 17.2.10.5. Financials (Based on Availability)
- 17.2.1 Itron Inc
List of Figures
- Figure 1: Global Power Metering Equipment Industry Revenue Breakdown (Million, %) by Region 2024 & 2032
- Figure 2: North America Power Metering Equipment Industry Revenue (Million), by Country 2024 & 2032
- Figure 3: North America Power Metering Equipment Industry Revenue Share (%), by Country 2024 & 2032
- Figure 4: Europe Power Metering Equipment Industry Revenue (Million), by Country 2024 & 2032
- Figure 5: Europe Power Metering Equipment Industry Revenue Share (%), by Country 2024 & 2032
- Figure 6: Asia Pacific Power Metering Equipment Industry Revenue (Million), by Country 2024 & 2032
- Figure 7: Asia Pacific Power Metering Equipment Industry Revenue Share (%), by Country 2024 & 2032
- Figure 8: South America Power Metering Equipment Industry Revenue (Million), by Country 2024 & 2032
- Figure 9: South America Power Metering Equipment Industry Revenue Share (%), by Country 2024 & 2032
- Figure 10: North America Power Metering Equipment Industry Revenue (Million), by Country 2024 & 2032
- Figure 11: North America Power Metering Equipment Industry Revenue Share (%), by Country 2024 & 2032
- Figure 12: MEA Power Metering Equipment Industry Revenue (Million), by Country 2024 & 2032
- Figure 13: MEA Power Metering Equipment Industry Revenue Share (%), by Country 2024 & 2032
- Figure 14: North America Power Metering Equipment Industry Revenue (Million), by End User 2024 & 2032
- Figure 15: North America Power Metering Equipment Industry Revenue Share (%), by End User 2024 & 2032
- Figure 16: North America Power Metering Equipment Industry Revenue (Million), by Technology 2024 & 2032
- Figure 17: North America Power Metering Equipment Industry Revenue Share (%), by Technology 2024 & 2032
- Figure 18: North America Power Metering Equipment Industry Revenue (Million), by Country 2024 & 2032
- Figure 19: North America Power Metering Equipment Industry Revenue Share (%), by Country 2024 & 2032
- Figure 20: Asia Pacific Power Metering Equipment Industry Revenue (Million), by End User 2024 & 2032
- Figure 21: Asia Pacific Power Metering Equipment Industry Revenue Share (%), by End User 2024 & 2032
- Figure 22: Asia Pacific Power Metering Equipment Industry Revenue (Million), by Technology 2024 & 2032
- Figure 23: Asia Pacific Power Metering Equipment Industry Revenue Share (%), by Technology 2024 & 2032
- Figure 24: Asia Pacific Power Metering Equipment Industry Revenue (Million), by Country 2024 & 2032
- Figure 25: Asia Pacific Power Metering Equipment Industry Revenue Share (%), by Country 2024 & 2032
- Figure 26: Europe Power Metering Equipment Industry Revenue (Million), by End User 2024 & 2032
- Figure 27: Europe Power Metering Equipment Industry Revenue Share (%), by End User 2024 & 2032
- Figure 28: Europe Power Metering Equipment Industry Revenue (Million), by Technology 2024 & 2032
- Figure 29: Europe Power Metering Equipment Industry Revenue Share (%), by Technology 2024 & 2032
- Figure 30: Europe Power Metering Equipment Industry Revenue (Million), by Country 2024 & 2032
- Figure 31: Europe Power Metering Equipment Industry Revenue Share (%), by Country 2024 & 2032
- Figure 32: South America Power Metering Equipment Industry Revenue (Million), by End User 2024 & 2032
- Figure 33: South America Power Metering Equipment Industry Revenue Share (%), by End User 2024 & 2032
- Figure 34: South America Power Metering Equipment Industry Revenue (Million), by Technology 2024 & 2032
- Figure 35: South America Power Metering Equipment Industry Revenue Share (%), by Technology 2024 & 2032
- Figure 36: South America Power Metering Equipment Industry Revenue (Million), by Country 2024 & 2032
- Figure 37: South America Power Metering Equipment Industry Revenue Share (%), by Country 2024 & 2032
- Figure 38: Middle East and Africa Power Metering Equipment Industry Revenue (Million), by End User 2024 & 2032
- Figure 39: Middle East and Africa Power Metering Equipment Industry Revenue Share (%), by End User 2024 & 2032
- Figure 40: Middle East and Africa Power Metering Equipment Industry Revenue (Million), by Technology 2024 & 2032
- Figure 41: Middle East and Africa Power Metering Equipment Industry Revenue Share (%), by Technology 2024 & 2032
- Figure 42: Middle East and Africa Power Metering Equipment Industry Revenue (Million), by Country 2024 & 2032
- Figure 43: Middle East and Africa Power Metering Equipment Industry Revenue Share (%), by Country 2024 & 2032
List of Tables
- Table 1: Global Power Metering Equipment Industry Revenue Million Forecast, by Region 2019 & 2032
- Table 2: Global Power Metering Equipment Industry Revenue Million Forecast, by End User 2019 & 2032
- Table 3: Global Power Metering Equipment Industry Revenue Million Forecast, by Technology 2019 & 2032
- Table 4: Global Power Metering Equipment Industry Revenue Million Forecast, by Region 2019 & 2032
- Table 5: Global Power Metering Equipment Industry Revenue Million Forecast, by Country 2019 & 2032
- Table 6: United States Power Metering Equipment Industry Revenue (Million) Forecast, by Application 2019 & 2032
- Table 7: Canada Power Metering Equipment Industry Revenue (Million) Forecast, by Application 2019 & 2032
- Table 8: Mexico Power Metering Equipment Industry Revenue (Million) Forecast, by Application 2019 & 2032
- Table 9: Global Power Metering Equipment Industry Revenue Million Forecast, by Country 2019 & 2032
- Table 10: Germany Power Metering Equipment Industry Revenue (Million) Forecast, by Application 2019 & 2032
- Table 11: United Kingdom Power Metering Equipment Industry Revenue (Million) Forecast, by Application 2019 & 2032
- Table 12: France Power Metering Equipment Industry Revenue (Million) Forecast, by Application 2019 & 2032
- Table 13: Spain Power Metering Equipment Industry Revenue (Million) Forecast, by Application 2019 & 2032
- Table 14: Italy Power Metering Equipment Industry Revenue (Million) Forecast, by Application 2019 & 2032
- Table 15: Spain Power Metering Equipment Industry Revenue (Million) Forecast, by Application 2019 & 2032
- Table 16: Belgium Power Metering Equipment Industry Revenue (Million) Forecast, by Application 2019 & 2032
- Table 17: Netherland Power Metering Equipment Industry Revenue (Million) Forecast, by Application 2019 & 2032
- Table 18: Nordics Power Metering Equipment Industry Revenue (Million) Forecast, by Application 2019 & 2032
- Table 19: Rest of Europe Power Metering Equipment Industry Revenue (Million) Forecast, by Application 2019 & 2032
- Table 20: Global Power Metering Equipment Industry Revenue Million Forecast, by Country 2019 & 2032
- Table 21: China Power Metering Equipment Industry Revenue (Million) Forecast, by Application 2019 & 2032
- Table 22: Japan Power Metering Equipment Industry Revenue (Million) Forecast, by Application 2019 & 2032
- Table 23: India Power Metering Equipment Industry Revenue (Million) Forecast, by Application 2019 & 2032
- Table 24: South Korea Power Metering Equipment Industry Revenue (Million) Forecast, by Application 2019 & 2032
- Table 25: Southeast Asia Power Metering Equipment Industry Revenue (Million) Forecast, by Application 2019 & 2032
- Table 26: Australia Power Metering Equipment Industry Revenue (Million) Forecast, by Application 2019 & 2032
- Table 27: Indonesia Power Metering Equipment Industry Revenue (Million) Forecast, by Application 2019 & 2032
- Table 28: Phillipes Power Metering Equipment Industry Revenue (Million) Forecast, by Application 2019 & 2032
- Table 29: Singapore Power Metering Equipment Industry Revenue (Million) Forecast, by Application 2019 & 2032
- Table 30: Thailandc Power Metering Equipment Industry Revenue (Million) Forecast, by Application 2019 & 2032
- Table 31: Rest of Asia Pacific Power Metering Equipment Industry Revenue (Million) Forecast, by Application 2019 & 2032
- Table 32: Global Power Metering Equipment Industry Revenue Million Forecast, by Country 2019 & 2032
- Table 33: Brazil Power Metering Equipment Industry Revenue (Million) Forecast, by Application 2019 & 2032
- Table 34: Argentina Power Metering Equipment Industry Revenue (Million) Forecast, by Application 2019 & 2032
- Table 35: Peru Power Metering Equipment Industry Revenue (Million) Forecast, by Application 2019 & 2032
- Table 36: Chile Power Metering Equipment Industry Revenue (Million) Forecast, by Application 2019 & 2032
- Table 37: Colombia Power Metering Equipment Industry Revenue (Million) Forecast, by Application 2019 & 2032
- Table 38: Ecuador Power Metering Equipment Industry Revenue (Million) Forecast, by Application 2019 & 2032
- Table 39: Venezuela Power Metering Equipment Industry Revenue (Million) Forecast, by Application 2019 & 2032
- Table 40: Rest of South America Power Metering Equipment Industry Revenue (Million) Forecast, by Application 2019 & 2032
- Table 41: Global Power Metering Equipment Industry Revenue Million Forecast, by Country 2019 & 2032
- Table 42: United States Power Metering Equipment Industry Revenue (Million) Forecast, by Application 2019 & 2032
- Table 43: Canada Power Metering Equipment Industry Revenue (Million) Forecast, by Application 2019 & 2032
- Table 44: Mexico Power Metering Equipment Industry Revenue (Million) Forecast, by Application 2019 & 2032
- Table 45: Global Power Metering Equipment Industry Revenue Million Forecast, by Country 2019 & 2032
- Table 46: United Arab Emirates Power Metering Equipment Industry Revenue (Million) Forecast, by Application 2019 & 2032
- Table 47: Saudi Arabia Power Metering Equipment Industry Revenue (Million) Forecast, by Application 2019 & 2032
- Table 48: South Africa Power Metering Equipment Industry Revenue (Million) Forecast, by Application 2019 & 2032
- Table 49: Rest of Middle East and Africa Power Metering Equipment Industry Revenue (Million) Forecast, by Application 2019 & 2032
- Table 50: Global Power Metering Equipment Industry Revenue Million Forecast, by End User 2019 & 2032
- Table 51: Global Power Metering Equipment Industry Revenue Million Forecast, by Technology 2019 & 2032
- Table 52: Global Power Metering Equipment Industry Revenue Million Forecast, by Country 2019 & 2032
- Table 53: United States Power Metering Equipment Industry Revenue (Million) Forecast, by Application 2019 & 2032
- Table 54: Canada Power Metering Equipment Industry Revenue (Million) Forecast, by Application 2019 & 2032
- Table 55: Rest of North America Power Metering Equipment Industry Revenue (Million) Forecast, by Application 2019 & 2032
- Table 56: Global Power Metering Equipment Industry Revenue Million Forecast, by End User 2019 & 2032
- Table 57: Global Power Metering Equipment Industry Revenue Million Forecast, by Technology 2019 & 2032
- Table 58: Global Power Metering Equipment Industry Revenue Million Forecast, by Country 2019 & 2032
- Table 59: China Power Metering Equipment Industry Revenue (Million) Forecast, by Application 2019 & 2032
- Table 60: India Power Metering Equipment Industry Revenue (Million) Forecast, by Application 2019 & 2032
- Table 61: Japan Power Metering Equipment Industry Revenue (Million) Forecast, by Application 2019 & 2032
- Table 62: South Korea Power Metering Equipment Industry Revenue (Million) Forecast, by Application 2019 & 2032
- Table 63: Malaysia Power Metering Equipment Industry Revenue (Million) Forecast, by Application 2019 & 2032
- Table 64: Thailand Power Metering Equipment Industry Revenue (Million) Forecast, by Application 2019 & 2032
- Table 65: Indonesia Power Metering Equipment Industry Revenue (Million) Forecast, by Application 2019 & 2032
- Table 66: Vietnam Power Metering Equipment Industry Revenue (Million) Forecast, by Application 2019 & 2032
- Table 67: Rest of Asia Pacific Power Metering Equipment Industry Revenue (Million) Forecast, by Application 2019 & 2032
- Table 68: Global Power Metering Equipment Industry Revenue Million Forecast, by End User 2019 & 2032
- Table 69: Global Power Metering Equipment Industry Revenue Million Forecast, by Technology 2019 & 2032
- Table 70: Global Power Metering Equipment Industry Revenue Million Forecast, by Country 2019 & 2032
- Table 71: Germany Power Metering Equipment Industry Revenue (Million) Forecast, by Application 2019 & 2032
- Table 72: France Power Metering Equipment Industry Revenue (Million) Forecast, by Application 2019 & 2032
- Table 73: United Kingdom Power Metering Equipment Industry Revenue (Million) Forecast, by Application 2019 & 2032
- Table 74: Spain Power Metering Equipment Industry Revenue (Million) Forecast, by Application 2019 & 2032
- Table 75: Nordic Power Metering Equipment Industry Revenue (Million) Forecast, by Application 2019 & 2032
- Table 76: Turkey Power Metering Equipment Industry Revenue (Million) Forecast, by Application 2019 & 2032
- Table 77: Russia Power Metering Equipment Industry Revenue (Million) Forecast, by Application 2019 & 2032
- Table 78: Rest of Europe Power Metering Equipment Industry Revenue (Million) Forecast, by Application 2019 & 2032
- Table 79: Global Power Metering Equipment Industry Revenue Million Forecast, by End User 2019 & 2032
- Table 80: Global Power Metering Equipment Industry Revenue Million Forecast, by Technology 2019 & 2032
- Table 81: Global Power Metering Equipment Industry Revenue Million Forecast, by Country 2019 & 2032
- Table 82: Brazil Power Metering Equipment Industry Revenue (Million) Forecast, by Application 2019 & 2032
- Table 83: Argentina Power Metering Equipment Industry Revenue (Million) Forecast, by Application 2019 & 2032
- Table 84: Colombia Power Metering Equipment Industry Revenue (Million) Forecast, by Application 2019 & 2032
- Table 85: Rest of South America Power Metering Equipment Industry Revenue (Million) Forecast, by Application 2019 & 2032
- Table 86: Global Power Metering Equipment Industry Revenue Million Forecast, by End User 2019 & 2032
- Table 87: Global Power Metering Equipment Industry Revenue Million Forecast, by Technology 2019 & 2032
- Table 88: Global Power Metering Equipment Industry Revenue Million Forecast, by Country 2019 & 2032
- Table 89: Saudi Arabia Power Metering Equipment Industry Revenue (Million) Forecast, by Application 2019 & 2032
- Table 90: United Arab Emirates Power Metering Equipment Industry Revenue (Million) Forecast, by Application 2019 & 2032
- Table 91: Qatar Power Metering Equipment Industry Revenue (Million) Forecast, by Application 2019 & 2032
- Table 92: South Africa Power Metering Equipment Industry Revenue (Million) Forecast, by Application 2019 & 2032
- Table 93: Nigeria Power Metering Equipment Industry Revenue (Million) Forecast, by Application 2019 & 2032
- Table 94: Oman Power Metering Equipment Industry Revenue (Million) Forecast, by Application 2019 & 2032
- Table 95: Egypt Power Metering Equipment Industry Revenue (Million) Forecast, by Application 2019 & 2032
- Table 96: Algeria Power Metering Equipment Industry Revenue (Million) Forecast, by Application 2019 & 2032
- Table 97: Rest of Middle East and Africa Power Metering Equipment Industry Revenue (Million) Forecast, by Application 2019 & 2032
Frequently Asked Questions
1. What is the projected Compound Annual Growth Rate (CAGR) of the Power Metering Equipment Industry?
The projected CAGR is approximately > 5.70%.
2. Which companies are prominent players in the Power Metering Equipment Industry?
Key companies in the market include Itron Inc, Honeywell International*List Not Exhaustive 6 4 List of Other Prominent Companies (Company Name Headquarter Revenue Relevant Products and Services Operating Sector Recent Trends and Technology or Projects Contact Details etc )6 5 Market Ranking Analysi, ABB Ltd, Toshiba Corporation, Siemens AG, Schneider Electric SE, Kamstrup AS, Eaton Corporation PLC, Aclara Technologies LLC, General Electric Company.
3. What are the main segments of the Power Metering Equipment Industry?
The market segments include End User, Technology.
4. Can you provide details about the market size?
The market size is estimated to be USD 29.19 Million as of 2022.
5. What are some drivers contributing to market growth?
4.; Increasing Government Focus on the Development of Smart Grid Infrastructure 4.; Increase in Investments to Deploy Smart Meters.
6. What are the notable trends driving market growth?
Smart Meters Technology is Expected to Dominate the Market during the Forecast Period.
7. Are there any restraints impacting market growth?
4.; Issues Related to Privacy and Standardization of Power Meters.
8. Can you provide examples of recent developments in the market?
March 2024: The Government of India announced the Smart Meter National Program (SMNP). The program aims to replace 250 million conventional electricity meters with prepaid smart meters, along with upgrading infrastructure such as feeders and transformers. The project will be funded with an estimated capital expenditure of INR 1.5 trillion (approximately USD 17.97 billion) and is slated for implementation over the next five fiscal years.
9. What pricing options are available for accessing the report?
Pricing options include single-user, multi-user, and enterprise licenses priced at USD 4750, USD 5250, and USD 8750 respectively.
10. Is the market size provided in terms of value or volume?
The market size is provided in terms of value, measured in Million.
11. Are there any specific market keywords associated with the report?
Yes, the market keyword associated with the report is "Power Metering Equipment Industry," which aids in identifying and referencing the specific market segment covered.
12. How do I determine which pricing option suits my needs best?
The pricing options vary based on user requirements and access needs. Individual users may opt for single-user licenses, while businesses requiring broader access may choose multi-user or enterprise licenses for cost-effective access to the report.
13. Are there any additional resources or data provided in the Power Metering Equipment Industry report?
While the report offers comprehensive insights, it's advisable to review the specific contents or supplementary materials provided to ascertain if additional resources or data are available.
14. How can I stay updated on further developments or reports in the Power Metering Equipment Industry?
To stay informed about further developments, trends, and reports in the Power Metering Equipment Industry, consider subscribing to industry newsletters, following relevant companies and organizations, or regularly checking reputable industry news sources and publications.
Methodology
Step 1 - Identification of Relevant Samples Size from Population Database


Step 2 - Approaches for Defining Global Market Size (Value, Volume* & Price*)

Note*: In applicable scenarios
Step 3 - Data Sources
Primary Research
- Web Analytics
- Survey Reports
- Research Institute
- Latest Research Reports
- Opinion Leaders
Secondary Research
- Annual Reports
- White Paper
- Latest Press Release
- Industry Association
- Paid Database
- Investor Presentations

Step 4 - Data Triangulation
Involves using different sources of information in order to increase the validity of a study
These sources are likely to be stakeholders in a program - participants, other researchers, program staff, other community members, and so on.
Then we put all data in single framework & apply various statistical tools to find out the dynamic on the market.
During the analysis stage, feedback from the stakeholder groups would be compared to determine areas of agreement as well as areas of divergence


