
Key Insights
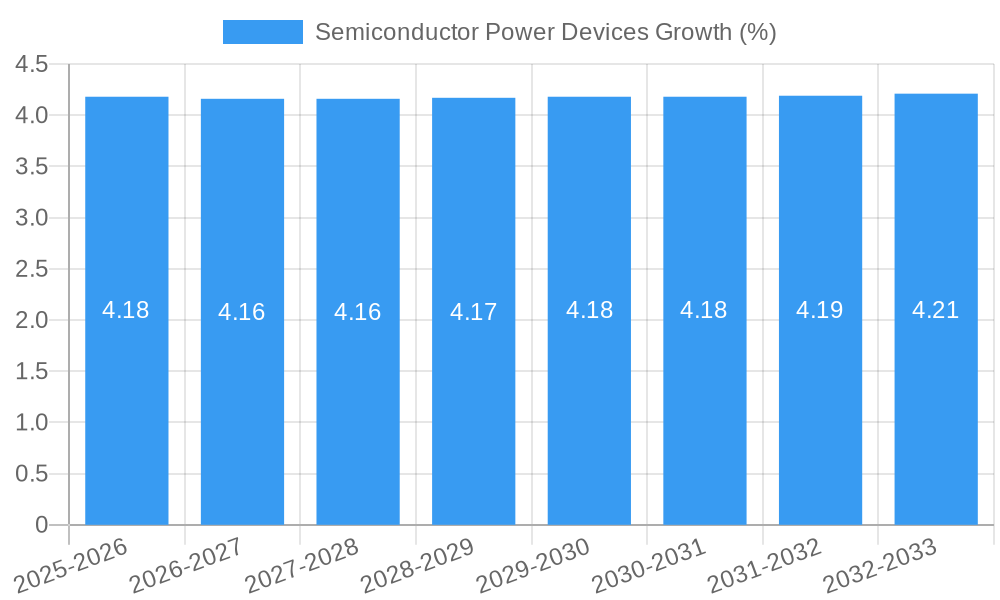
The global Semiconductor Power Devices market is poised for significant expansion, projected to reach an estimated USD 66,470 million by 2025, with a robust Compound Annual Growth Rate (CAGR) of 4.3% anticipated between 2025 and 2033. This sustained growth is propelled by a confluence of powerful drivers, most notably the insatiable demand from the Automotive & Transportation sector, driven by the accelerating adoption of electric vehicles (EVs) and advanced driver-assistance systems (ADAS). The increasing electrification of vehicle powertrains, battery management systems, and charging infrastructure inherently requires a substantial increase in high-performance power semiconductor components. Furthermore, the Industrial sector is a key contributor, with automation, smart grids, and energy-efficient machinery demanding sophisticated power control solutions. The Consumer Electronics segment also plays a vital role, fueled by the proliferation of energy-efficient appliances, portable devices, and the burgeoning Internet of Things (IoT) ecosystem. Emerging applications in high-frequency communication and advanced power management integrated circuits are also contributing to the upward trajectory of this market.
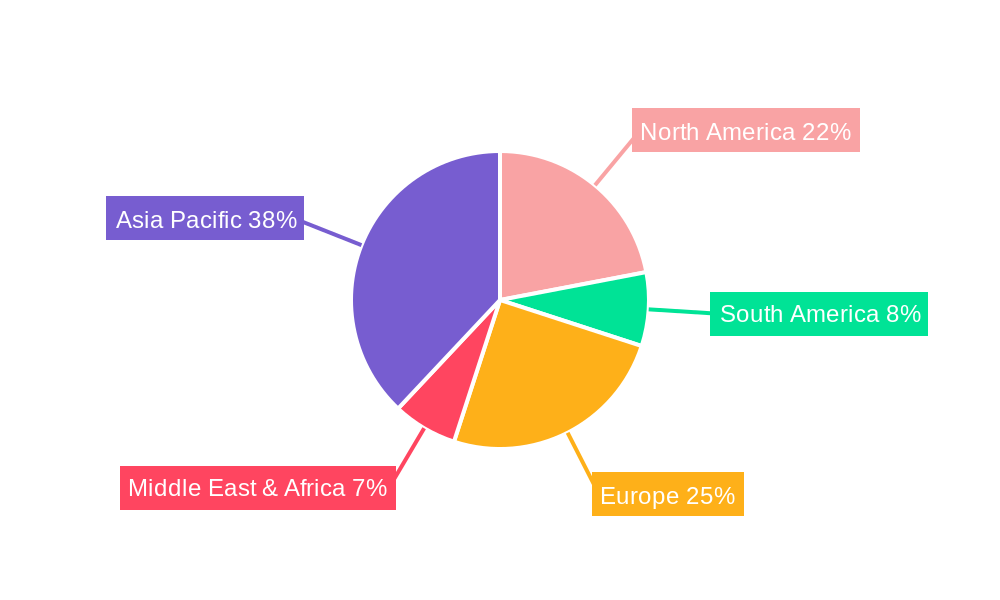
The market segmentation reveals a dynamic landscape where Power Discrete devices, such as MOSFETs and IGBTs, continue to be foundational, particularly in high-power applications. However, the growing complexity and miniaturization trends are pushing the adoption of Power Modules and Power ICs, which offer enhanced integration, improved thermal performance, and greater functionality for sophisticated power management. Key players like Infineon, Texas Instruments, and STMicroelectronics are at the forefront, investing heavily in research and development to innovate and expand their product portfolios to meet the evolving demands. Regional analysis indicates that Asia Pacific, particularly China, is expected to dominate the market share due to its strong manufacturing base and burgeoning demand across automotive, industrial, and consumer electronics sectors. North America and Europe are also significant markets, driven by technological advancements and stringent energy efficiency regulations. The market's trajectory is characterized by a focus on higher voltage and current capabilities, improved efficiency, and smaller form factors, all contributing to a sustainable and dynamic market outlook.
This comprehensive report offers a detailed exploration of the global Semiconductor Power Devices market, providing critical insights into market dynamics, growth trajectories, and competitive landscapes from 2019 to 2033. With a base year of 2025 and an estimated year also of 2025, the study delves into the historical performance (2019-2024) and projects future market penetration and expansion through the forecast period (2025-2033). The report is meticulously crafted for industry stakeholders, including manufacturers, suppliers, investors, and end-users, seeking to understand the intricate factors shaping this vital sector. We leverage high-traffic keywords such as "semiconductor power devices," "power electronics," "automotive semiconductors," "industrial power," "consumer electronics components," "high-power semiconductors," "SiC devices," "GaN devices," "power management ICs," and "power discrete market" to ensure maximum search visibility and relevance.

Semiconductor Power Devices Market Concentration & Innovation
The global semiconductor power devices market exhibits a moderate to high level of concentration, with a significant portion of market share held by a select few multinational corporations. In the base year 2025, key players like Infineon Technologies, Texas Instruments, STMicroelectronics, and ON Semiconductor collectively command a substantial market share, estimated to be over 50 million dollars. Innovation serves as a primary driver, fueled by the increasing demand for energy efficiency, miniaturization, and higher performance across all application segments. The continuous development of wide-bandgap semiconductors (SiC and GaN) is a testament to this innovation, enabling devices that operate at higher frequencies, voltages, and temperatures. Regulatory frameworks, particularly those focused on environmental sustainability and energy standards, are increasingly influencing product development, pushing for more efficient power solutions. Product substitutes are emerging, especially with advancements in alternative energy harvesting and storage technologies, though semiconductor power devices remain indispensable for power management and conversion. End-user trends point towards a growing preference for intelligent, connected, and highly efficient power systems, particularly in automotive and industrial applications. Mergers and acquisitions (M&A) activities continue to shape the market, with deal values in the historical period (2019-2024) averaging around 150 million dollars annually, as companies aim to consolidate their positions, acquire new technologies, or expand their product portfolios.
Semiconductor Power Devices Industry Trends & Insights
The semiconductor power devices industry is poised for robust growth, driven by a confluence of technological advancements, burgeoning application demands, and evolving consumer preferences. The market is projected to experience a Compound Annual Growth Rate (CAGR) of approximately 8% over the forecast period. This sustained expansion is underpinned by the exponential growth in electric vehicles (EVs), which require sophisticated power management systems for their powertrains, battery charging, and auxiliary functions. The industrial sector, with its increasing adoption of automation, robotics, and smart grid technologies, also represents a significant growth driver, demanding high-performance and reliable power components. Consumer electronics, from smartphones and laptops to advanced home appliances, are continuously incorporating more power-efficient solutions to enhance battery life and reduce energy consumption. Communication infrastructure, particularly the deployment of 5G networks and data centers, necessitates advanced power management ICs and power modules to handle the escalating data traffic and power requirements. Technological disruptions, such as the widespread adoption of Silicon Carbide (SiC) and Gallium Nitride (GaN) semiconductors, are revolutionizing power device capabilities, offering superior efficiency, smaller form factors, and higher operating temperatures compared to traditional silicon-based devices. Consumer preferences are increasingly leaning towards sustainability and energy conservation, creating a strong demand for power-efficient products. Competitive dynamics are characterized by intense innovation, strategic partnerships, and a growing emphasis on supply chain resilience. Market penetration of advanced power devices is accelerating as manufacturers strive to meet the performance and efficiency benchmarks set by emerging technologies and stringent environmental regulations. The total market size is projected to reach over 500 million dollars by 2033.
Dominant Markets & Segments in Semiconductor Power Devices
The Automotive & Transportation segment stands out as the dominant market for semiconductor power devices, projected to account for over 35% of the total market value in 2025, estimated at around 180 million dollars. This dominance is propelled by several key drivers.
Electric Vehicle (EV) Revolution: The rapid global adoption of electric vehicles is a primary catalyst. EVs rely heavily on power semiconductors for:
- Traction Inverters: Converting DC battery power to AC for electric motors.
- On-Board Chargers (OBCs): Enabling efficient charging from AC power sources.
- DC-DC Converters: Regulating voltage for various vehicle systems.
- Battery Management Systems (BMS): Monitoring and controlling battery health and performance. The increasing number of EV models and the growing global EV sales, projected to exceed 20 million units annually by 2025, directly translate to a substantial demand for high-performance power devices, particularly SiC and GaN-based solutions for improved efficiency and range.
Advanced Driver-Assistance Systems (ADAS) and Autonomous Driving: The integration of sophisticated ADAS features, including adaptive cruise control, lane keeping assist, and automated parking, requires significant power for sensors, processors, and actuators. This drives the demand for reliable and efficient power management ICs and discretes.
Stringent Emission Standards: Governments worldwide are implementing stricter emission regulations, compelling automakers to adopt more fuel-efficient technologies, including electrified powertrains that inherently demand advanced power electronics.
Industrial Automation and Smart Grids: The Industrial segment is another significant contributor, expected to capture approximately 25% of the market in 2025, estimated at 125 million dollars. Key drivers include:
- Factory Automation: The proliferation of robots, automated machinery, and variable speed drives in manufacturing facilities necessitates robust and efficient power control.
- Renewable Energy Integration: The expansion of solar and wind power generation requires advanced power converters and inverters for grid connection and energy management.
- Smart Grid Technologies: Modernization of electrical grids to improve efficiency, reliability, and integration of renewable sources drives demand for power electronics in substations and distribution networks.
The Power Discrete type is expected to hold a substantial market share, estimated at over 40% in 2025, valued at approximately 200 million dollars, due to its widespread use in various power conversion and switching applications across all segments. Power Modules, particularly those incorporating SiC and GaN, are experiencing rapid growth, driven by their ability to handle higher power densities and efficiency requirements in demanding applications like electric vehicles and industrial drives. Power ICs, especially power management ICs (PMICs), continue to see strong demand across consumer electronics, communication, and automotive applications for efficient voltage regulation and power sequencing.
Semiconductor Power Devices Product Developments
Recent product developments in semiconductor power devices are characterized by a strong focus on wide-bandgap technologies, particularly Silicon Carbide (SiC) and Gallium Nitride (GaN). Companies are launching higher-voltage SiC MOSFETs and diodes designed for electric vehicle powertrains and industrial power supplies, offering improved efficiency and reduced thermal management needs. GaN transistors are gaining traction in high-frequency applications like power adapters and data center power supplies, enabling smaller and more efficient designs. Innovations in modular power solutions are also prevalent, with integrated power modules combining multiple semiconductor components for enhanced performance and ease of integration. These advancements directly address the growing demand for higher power density, increased energy efficiency, and reduced form factors across automotive, industrial, and consumer electronics sectors, providing manufacturers with a competitive edge.
Report Scope & Segmentation Analysis
This report provides an exhaustive analysis of the semiconductor power devices market segmented by application and device type. The Automotive & Transportation segment, projected to be valued at over 180 million dollars in 2025, is a key growth area driven by electrification trends and ADAS integration. The Industrial segment, estimated at 125 million dollars in 2025, benefits from automation and renewable energy adoption. Consumer Electronics and Communication segments, though individually smaller, collectively represent significant volume, with projected market sizes of approximately 100 million dollars and 60 million dollars respectively in 2025, driven by demand for efficient power management in mobile devices, computing, and telecommunications infrastructure.
Segmentation by device type includes Power Discrete, anticipated to reach 200 million dollars in 2025, with widespread adoption in basic power switching and regulation. Power Modules, estimated at 150 million dollars in 2025, are witnessing rapid growth due to their high power density capabilities, especially in demanding applications like EVs. Power ICs, projected at 100 million dollars in 2025, are crucial for intelligent power management and control across all sectors. Each segment's competitive dynamics and growth projections have been meticulously analyzed throughout the study period.
Key Drivers of Semiconductor Power Devices Growth
The growth of the semiconductor power devices market is primarily propelled by several interconnected factors. The accelerating transition to electric vehicles (EVs) necessitates advanced and efficient power electronics for powertrains, charging, and battery management systems, a trend supported by global carbon emission reduction targets. The increasing adoption of automation and smart technologies in industrial sectors, including robotics and renewable energy integration, drives demand for high-performance power components. Furthermore, the relentless pursuit of energy efficiency across all consumer electronics and communication infrastructure, from data centers to mobile devices, compels the use of more sophisticated power management solutions. The continuous evolution and commercialization of wide-bandgap semiconductor technologies like Silicon Carbide (SiC) and Gallium Nitride (GaN) are enabling smaller, lighter, and more efficient power devices, further stimulating market expansion.
Challenges in the Semiconductor Power Devices Sector
Despite the robust growth trajectory, the semiconductor power devices sector faces several significant challenges. Supply chain disruptions, exacerbated by geopolitical tensions and component shortages, continue to pose a threat to production volumes and lead times, with potential impacts on market growth estimated to be in the range of 5-10% in affected periods. The intense price competition among manufacturers, particularly in the commodity power discrete segment, can compress profit margins. Furthermore, the rapidly evolving technological landscape, especially with the ongoing advancements in SiC and GaN technologies, requires continuous and substantial investment in R&D and manufacturing capabilities to remain competitive. Navigating complex and evolving global regulatory landscapes, particularly concerning environmental standards and trade policies, also presents a hurdle for market participants.
Emerging Opportunities in Semiconductor Power Devices
Emerging opportunities in the semiconductor power devices market are abundant, driven by ongoing technological advancements and shifting market demands. The continued growth of the electric vehicle market presents immense opportunities for power semiconductors, especially in next-generation battery architectures and high-voltage powertrains. The expanding deployment of 5G infrastructure and the burgeoning IoT ecosystem are creating significant demand for low-power, high-efficiency power management solutions. The increasing focus on renewable energy sources and smart grid technologies worldwide opens up new avenues for power electronics in grid-scale energy storage, distributed power generation, and smart metering. The development of advanced packaging technologies for power modules, enabling higher power density and better thermal performance, also represents a key area for innovation and market growth.
Leading Players in the Semiconductor Power Devices Market
- Infineon Technologies
- Texas Instruments
- STMicroelectronics
- Renesas Electronics
- ON Semiconductor
- Alpha & Omega Semiconductor
- Mitsubishi Electric (Vincotech)
- Toshiba
- Vishay Intertechnology
- Fuji Electric
- Rohm
- Nexperia
- Microsemi
- Littelfuse (IXYS)
- Cree (Wolfspeed)
- Microchip
- GeneSiC Semiconductor Inc.
- NXP Semiconductors
- Power Integrations, Inc.
- Broadcom
- Panasonic
- NEC Electronics
- Mikron
- Altech
- Jiangsu Jiejie Microelectronics
- OmniVision Technologies
- Jilin Sino-Microelectronics
- Fuman Electronics
- Yangzhou Yangjie Electronic Technology
- Suzhou Good-Ark Electronics
- SEMIKRON
- Stanson Technology
- MagnaChip
- KEC Corporation
- IKO-SEM
- Unisonic Technologies(UTC)
- CET-MOS Corporation
- Hangzhou Silan Microelectronics
- ABB
- Hitachi
- Danfoss
- CRRC
- BYD
Key Developments in Semiconductor Power Devices Industry
- 2023/01: Infineon Technologies launched a new series of SiC MOSFETs for electric vehicle powertrains, offering enhanced performance and efficiency.
- 2023/03: Texas Instruments announced the expansion of its GaN transistor portfolio for high-frequency power applications in consumer electronics and data centers.
- 2023/06: STMicroelectronics introduced an innovative power module designed for industrial motor control, improving energy savings.
- 2023/09: ON Semiconductor acquired a key player in SiC technology, strengthening its position in the electric vehicle market.
- 2024/01: Renesas Electronics unveiled a new family of high-performance power management ICs for automotive applications, supporting advanced driver-assistance systems.
- 2024/04: Alpha & Omega Semiconductor introduced a new generation of power MOSFETs with improved thermal performance for industrial applications.
- 2024/07: Mitsubishi Electric (Vincotech) launched a compact power module solution for renewable energy inverters, reducing system size and cost.
- 2024/10: Wolfspeed (Cree) announced significant capacity expansion for SiC wafer fabrication to meet growing demand.
Strategic Outlook for Semiconductor Power Devices Market
The strategic outlook for the semiconductor power devices market remains highly positive, driven by strong fundamental growth drivers and continuous technological innovation. The accelerating global adoption of electric vehicles, coupled with the increasing integration of renewable energy sources and the expansion of smart grid infrastructure, will continue to fuel demand for high-performance and efficient power solutions. The ongoing advancements in wide-bandgap semiconductor technologies (SiC and GaN) are expected to further disrupt the market, enabling next-generation power electronics with superior capabilities. Strategic investments in R&D, capacity expansion, and supply chain resilience will be crucial for market leaders to capitalize on emerging opportunities. Companies focusing on developing integrated solutions, addressing the evolving needs of automotive and industrial applications, and enhancing energy efficiency across consumer electronics will be well-positioned for sustained success and market leadership in the coming years.
Semiconductor Power Devices Segmentation
-
1. Application
- 1.1. Automotive & Transportation
- 1.2. Industrial
- 1.3. Consumer Electronics
- 1.4. Communication
-
2. Type
- 2.1. Power Discrete
- 2.2. Power Module
- 2.3. Power Ics
Semiconductor Power Devices Segmentation By Geography
-
1. North America
- 1.1. United States
- 1.2. Canada
- 1.3. Mexico
-
2. South America
- 2.1. Brazil
- 2.2. Argentina
- 2.3. Rest of South America
-
3. Europe
- 3.1. United Kingdom
- 3.2. Germany
- 3.3. France
- 3.4. Italy
- 3.5. Spain
- 3.6. Russia
- 3.7. Benelux
- 3.8. Nordics
- 3.9. Rest of Europe
-
4. Middle East & Africa
- 4.1. Turkey
- 4.2. Israel
- 4.3. GCC
- 4.4. North Africa
- 4.5. South Africa
- 4.6. Rest of Middle East & Africa
-
5. Asia Pacific
- 5.1. China
- 5.2. India
- 5.3. Japan
- 5.4. South Korea
- 5.5. ASEAN
- 5.6. Oceania
- 5.7. Rest of Asia Pacific
Semiconductor Power Devices REPORT HIGHLIGHTS
| Aspects | Details |
|---|---|
| Study Period | 2019-2033 |
| Base Year | 2024 |
| Estimated Year | 2025 |
| Forecast Period | 2025-2033 |
| Historical Period | 2019-2024 |
| Growth Rate | CAGR of 4.3% from 2019-2033 |
| Segmentation |
|
Table of Contents
- 1. Introduction
- 1.1. Research Scope
- 1.2. Market Segmentation
- 1.3. Research Methodology
- 1.4. Definitions and Assumptions
- 2. Executive Summary
- 2.1. Introduction
- 3. Market Dynamics
- 3.1. Introduction
- 3.2. Market Drivers
- 3.3. Market Restrains
- 3.4. Market Trends
- 4. Market Factor Analysis
- 4.1. Porters Five Forces
- 4.2. Supply/Value Chain
- 4.3. PESTEL analysis
- 4.4. Market Entropy
- 4.5. Patent/Trademark Analysis
- 5. Global Semiconductor Power Devices Analysis, Insights and Forecast, 2019-2031
- 5.1. Market Analysis, Insights and Forecast - by Application
- 5.1.1. Automotive & Transportation
- 5.1.2. Industrial
- 5.1.3. Consumer Electronics
- 5.1.4. Communication
- 5.2. Market Analysis, Insights and Forecast - by Type
- 5.2.1. Power Discrete
- 5.2.2. Power Module
- 5.2.3. Power Ics
- 5.3. Market Analysis, Insights and Forecast - by Region
- 5.3.1. North America
- 5.3.2. South America
- 5.3.3. Europe
- 5.3.4. Middle East & Africa
- 5.3.5. Asia Pacific
- 5.1. Market Analysis, Insights and Forecast - by Application
- 6. North America Semiconductor Power Devices Analysis, Insights and Forecast, 2019-2031
- 6.1. Market Analysis, Insights and Forecast - by Application
- 6.1.1. Automotive & Transportation
- 6.1.2. Industrial
- 6.1.3. Consumer Electronics
- 6.1.4. Communication
- 6.2. Market Analysis, Insights and Forecast - by Type
- 6.2.1. Power Discrete
- 6.2.2. Power Module
- 6.2.3. Power Ics
- 6.1. Market Analysis, Insights and Forecast - by Application
- 7. South America Semiconductor Power Devices Analysis, Insights and Forecast, 2019-2031
- 7.1. Market Analysis, Insights and Forecast - by Application
- 7.1.1. Automotive & Transportation
- 7.1.2. Industrial
- 7.1.3. Consumer Electronics
- 7.1.4. Communication
- 7.2. Market Analysis, Insights and Forecast - by Type
- 7.2.1. Power Discrete
- 7.2.2. Power Module
- 7.2.3. Power Ics
- 7.1. Market Analysis, Insights and Forecast - by Application
- 8. Europe Semiconductor Power Devices Analysis, Insights and Forecast, 2019-2031
- 8.1. Market Analysis, Insights and Forecast - by Application
- 8.1.1. Automotive & Transportation
- 8.1.2. Industrial
- 8.1.3. Consumer Electronics
- 8.1.4. Communication
- 8.2. Market Analysis, Insights and Forecast - by Type
- 8.2.1. Power Discrete
- 8.2.2. Power Module
- 8.2.3. Power Ics
- 8.1. Market Analysis, Insights and Forecast - by Application
- 9. Middle East & Africa Semiconductor Power Devices Analysis, Insights and Forecast, 2019-2031
- 9.1. Market Analysis, Insights and Forecast - by Application
- 9.1.1. Automotive & Transportation
- 9.1.2. Industrial
- 9.1.3. Consumer Electronics
- 9.1.4. Communication
- 9.2. Market Analysis, Insights and Forecast - by Type
- 9.2.1. Power Discrete
- 9.2.2. Power Module
- 9.2.3. Power Ics
- 9.1. Market Analysis, Insights and Forecast - by Application
- 10. Asia Pacific Semiconductor Power Devices Analysis, Insights and Forecast, 2019-2031
- 10.1. Market Analysis, Insights and Forecast - by Application
- 10.1.1. Automotive & Transportation
- 10.1.2. Industrial
- 10.1.3. Consumer Electronics
- 10.1.4. Communication
- 10.2. Market Analysis, Insights and Forecast - by Type
- 10.2.1. Power Discrete
- 10.2.2. Power Module
- 10.2.3. Power Ics
- 10.1. Market Analysis, Insights and Forecast - by Application
- 11. Competitive Analysis
- 11.1. Global Market Share Analysis 2024
- 11.2. Company Profiles
- 11.2.1 Infineon
- 11.2.1.1. Overview
- 11.2.1.2. Products
- 11.2.1.3. SWOT Analysis
- 11.2.1.4. Recent Developments
- 11.2.1.5. Financials (Based on Availability)
- 11.2.2 Texas Instruments
- 11.2.2.1. Overview
- 11.2.2.2. Products
- 11.2.2.3. SWOT Analysis
- 11.2.2.4. Recent Developments
- 11.2.2.5. Financials (Based on Availability)
- 11.2.3 ST Microelectronics
- 11.2.3.1. Overview
- 11.2.3.2. Products
- 11.2.3.3. SWOT Analysis
- 11.2.3.4. Recent Developments
- 11.2.3.5. Financials (Based on Availability)
- 11.2.4 Renesas Electronics
- 11.2.4.1. Overview
- 11.2.4.2. Products
- 11.2.4.3. SWOT Analysis
- 11.2.4.4. Recent Developments
- 11.2.4.5. Financials (Based on Availability)
- 11.2.5 ON Semiconductor
- 11.2.5.1. Overview
- 11.2.5.2. Products
- 11.2.5.3. SWOT Analysis
- 11.2.5.4. Recent Developments
- 11.2.5.5. Financials (Based on Availability)
- 11.2.6 Alpha & Omega Semiconductor
- 11.2.6.1. Overview
- 11.2.6.2. Products
- 11.2.6.3. SWOT Analysis
- 11.2.6.4. Recent Developments
- 11.2.6.5. Financials (Based on Availability)
- 11.2.7 Mitsubishi Electric (Vincotech)
- 11.2.7.1. Overview
- 11.2.7.2. Products
- 11.2.7.3. SWOT Analysis
- 11.2.7.4. Recent Developments
- 11.2.7.5. Financials (Based on Availability)
- 11.2.8 Toshiba
- 11.2.8.1. Overview
- 11.2.8.2. Products
- 11.2.8.3. SWOT Analysis
- 11.2.8.4. Recent Developments
- 11.2.8.5. Financials (Based on Availability)
- 11.2.9 Vishay Intertechnology
- 11.2.9.1. Overview
- 11.2.9.2. Products
- 11.2.9.3. SWOT Analysis
- 11.2.9.4. Recent Developments
- 11.2.9.5. Financials (Based on Availability)
- 11.2.10 Fuji Electric
- 11.2.10.1. Overview
- 11.2.10.2. Products
- 11.2.10.3. SWOT Analysis
- 11.2.10.4. Recent Developments
- 11.2.10.5. Financials (Based on Availability)
- 11.2.11 Rohm
- 11.2.11.1. Overview
- 11.2.11.2. Products
- 11.2.11.3. SWOT Analysis
- 11.2.11.4. Recent Developments
- 11.2.11.5. Financials (Based on Availability)
- 11.2.12 Nexperia
- 11.2.12.1. Overview
- 11.2.12.2. Products
- 11.2.12.3. SWOT Analysis
- 11.2.12.4. Recent Developments
- 11.2.12.5. Financials (Based on Availability)
- 11.2.13 Microsemi
- 11.2.13.1. Overview
- 11.2.13.2. Products
- 11.2.13.3. SWOT Analysis
- 11.2.13.4. Recent Developments
- 11.2.13.5. Financials (Based on Availability)
- 11.2.14 Littelfuse (IXYS)
- 11.2.14.1. Overview
- 11.2.14.2. Products
- 11.2.14.3. SWOT Analysis
- 11.2.14.4. Recent Developments
- 11.2.14.5. Financials (Based on Availability)
- 11.2.15 Cree (Wolfspeed)
- 11.2.15.1. Overview
- 11.2.15.2. Products
- 11.2.15.3. SWOT Analysis
- 11.2.15.4. Recent Developments
- 11.2.15.5. Financials (Based on Availability)
- 11.2.16 Microchip
- 11.2.16.1. Overview
- 11.2.16.2. Products
- 11.2.16.3. SWOT Analysis
- 11.2.16.4. Recent Developments
- 11.2.16.5. Financials (Based on Availability)
- 11.2.17 GeneSiC Semiconductor Inc.
- 11.2.17.1. Overview
- 11.2.17.2. Products
- 11.2.17.3. SWOT Analysis
- 11.2.17.4. Recent Developments
- 11.2.17.5. Financials (Based on Availability)
- 11.2.18 NXP Semiconductors
- 11.2.18.1. Overview
- 11.2.18.2. Products
- 11.2.18.3. SWOT Analysis
- 11.2.18.4. Recent Developments
- 11.2.18.5. Financials (Based on Availability)
- 11.2.19 Power Integrations Inc.
- 11.2.19.1. Overview
- 11.2.19.2. Products
- 11.2.19.3. SWOT Analysis
- 11.2.19.4. Recent Developments
- 11.2.19.5. Financials (Based on Availability)
- 11.2.20 Broadcom
- 11.2.20.1. Overview
- 11.2.20.2. Products
- 11.2.20.3. SWOT Analysis
- 11.2.20.4. Recent Developments
- 11.2.20.5. Financials (Based on Availability)
- 11.2.21 Panasonic
- 11.2.21.1. Overview
- 11.2.21.2. Products
- 11.2.21.3. SWOT Analysis
- 11.2.21.4. Recent Developments
- 11.2.21.5. Financials (Based on Availability)
- 11.2.22 NEC Electronics
- 11.2.22.1. Overview
- 11.2.22.2. Products
- 11.2.22.3. SWOT Analysis
- 11.2.22.4. Recent Developments
- 11.2.22.5. Financials (Based on Availability)
- 11.2.23 Mikron
- 11.2.23.1. Overview
- 11.2.23.2. Products
- 11.2.23.3. SWOT Analysis
- 11.2.23.4. Recent Developments
- 11.2.23.5. Financials (Based on Availability)
- 11.2.24 Altech
- 11.2.24.1. Overview
- 11.2.24.2. Products
- 11.2.24.3. SWOT Analysis
- 11.2.24.4. Recent Developments
- 11.2.24.5. Financials (Based on Availability)
- 11.2.25 Jiangsu Jiejie Microelectronics
- 11.2.25.1. Overview
- 11.2.25.2. Products
- 11.2.25.3. SWOT Analysis
- 11.2.25.4. Recent Developments
- 11.2.25.5. Financials (Based on Availability)
- 11.2.26 OmniVision Technologies
- 11.2.26.1. Overview
- 11.2.26.2. Products
- 11.2.26.3. SWOT Analysis
- 11.2.26.4. Recent Developments
- 11.2.26.5. Financials (Based on Availability)
- 11.2.27 Jilin Sino-Microelectronics
- 11.2.27.1. Overview
- 11.2.27.2. Products
- 11.2.27.3. SWOT Analysis
- 11.2.27.4. Recent Developments
- 11.2.27.5. Financials (Based on Availability)
- 11.2.28 Fuman Electronics
- 11.2.28.1. Overview
- 11.2.28.2. Products
- 11.2.28.3. SWOT Analysis
- 11.2.28.4. Recent Developments
- 11.2.28.5. Financials (Based on Availability)
- 11.2.29 Yangzhou Yangjie Electronic Technology
- 11.2.29.1. Overview
- 11.2.29.2. Products
- 11.2.29.3. SWOT Analysis
- 11.2.29.4. Recent Developments
- 11.2.29.5. Financials (Based on Availability)
- 11.2.30 Suzhou Good-Ark Electronics
- 11.2.30.1. Overview
- 11.2.30.2. Products
- 11.2.30.3. SWOT Analysis
- 11.2.30.4. Recent Developments
- 11.2.30.5. Financials (Based on Availability)
- 11.2.31 SEMIKRON
- 11.2.31.1. Overview
- 11.2.31.2. Products
- 11.2.31.3. SWOT Analysis
- 11.2.31.4. Recent Developments
- 11.2.31.5. Financials (Based on Availability)
- 11.2.32 Stanson Technology
- 11.2.32.1. Overview
- 11.2.32.2. Products
- 11.2.32.3. SWOT Analysis
- 11.2.32.4. Recent Developments
- 11.2.32.5. Financials (Based on Availability)
- 11.2.33 MagnaChip
- 11.2.33.1. Overview
- 11.2.33.2. Products
- 11.2.33.3. SWOT Analysis
- 11.2.33.4. Recent Developments
- 11.2.33.5. Financials (Based on Availability)
- 11.2.34 KEC Corporation
- 11.2.34.1. Overview
- 11.2.34.2. Products
- 11.2.34.3. SWOT Analysis
- 11.2.34.4. Recent Developments
- 11.2.34.5. Financials (Based on Availability)
- 11.2.35 IKO-SEM
- 11.2.35.1. Overview
- 11.2.35.2. Products
- 11.2.35.3. SWOT Analysis
- 11.2.35.4. Recent Developments
- 11.2.35.5. Financials (Based on Availability)
- 11.2.36 Unisonic Technologies(UTC)
- 11.2.36.1. Overview
- 11.2.36.2. Products
- 11.2.36.3. SWOT Analysis
- 11.2.36.4. Recent Developments
- 11.2.36.5. Financials (Based on Availability)
- 11.2.37 CET-MOS Corporation
- 11.2.37.1. Overview
- 11.2.37.2. Products
- 11.2.37.3. SWOT Analysis
- 11.2.37.4. Recent Developments
- 11.2.37.5. Financials (Based on Availability)
- 11.2.38 Hangzhou Silan Microelectronics
- 11.2.38.1. Overview
- 11.2.38.2. Products
- 11.2.38.3. SWOT Analysis
- 11.2.38.4. Recent Developments
- 11.2.38.5. Financials (Based on Availability)
- 11.2.39 ABB
- 11.2.39.1. Overview
- 11.2.39.2. Products
- 11.2.39.3. SWOT Analysis
- 11.2.39.4. Recent Developments
- 11.2.39.5. Financials (Based on Availability)
- 11.2.40 Hitachi
- 11.2.40.1. Overview
- 11.2.40.2. Products
- 11.2.40.3. SWOT Analysis
- 11.2.40.4. Recent Developments
- 11.2.40.5. Financials (Based on Availability)
- 11.2.41 Danfoss
- 11.2.41.1. Overview
- 11.2.41.2. Products
- 11.2.41.3. SWOT Analysis
- 11.2.41.4. Recent Developments
- 11.2.41.5. Financials (Based on Availability)
- 11.2.42 CRRC
- 11.2.42.1. Overview
- 11.2.42.2. Products
- 11.2.42.3. SWOT Analysis
- 11.2.42.4. Recent Developments
- 11.2.42.5. Financials (Based on Availability)
- 11.2.43 BYD
- 11.2.43.1. Overview
- 11.2.43.2. Products
- 11.2.43.3. SWOT Analysis
- 11.2.43.4. Recent Developments
- 11.2.43.5. Financials (Based on Availability)
- 11.2.1 Infineon
List of Figures
- Figure 1: Global Semiconductor Power Devices Revenue Breakdown (million, %) by Region 2024 & 2032
- Figure 2: North America Semiconductor Power Devices Revenue (million), by Application 2024 & 2032
- Figure 3: North America Semiconductor Power Devices Revenue Share (%), by Application 2024 & 2032
- Figure 4: North America Semiconductor Power Devices Revenue (million), by Type 2024 & 2032
- Figure 5: North America Semiconductor Power Devices Revenue Share (%), by Type 2024 & 2032
- Figure 6: North America Semiconductor Power Devices Revenue (million), by Country 2024 & 2032
- Figure 7: North America Semiconductor Power Devices Revenue Share (%), by Country 2024 & 2032
- Figure 8: South America Semiconductor Power Devices Revenue (million), by Application 2024 & 2032
- Figure 9: South America Semiconductor Power Devices Revenue Share (%), by Application 2024 & 2032
- Figure 10: South America Semiconductor Power Devices Revenue (million), by Type 2024 & 2032
- Figure 11: South America Semiconductor Power Devices Revenue Share (%), by Type 2024 & 2032
- Figure 12: South America Semiconductor Power Devices Revenue (million), by Country 2024 & 2032
- Figure 13: South America Semiconductor Power Devices Revenue Share (%), by Country 2024 & 2032
- Figure 14: Europe Semiconductor Power Devices Revenue (million), by Application 2024 & 2032
- Figure 15: Europe Semiconductor Power Devices Revenue Share (%), by Application 2024 & 2032
- Figure 16: Europe Semiconductor Power Devices Revenue (million), by Type 2024 & 2032
- Figure 17: Europe Semiconductor Power Devices Revenue Share (%), by Type 2024 & 2032
- Figure 18: Europe Semiconductor Power Devices Revenue (million), by Country 2024 & 2032
- Figure 19: Europe Semiconductor Power Devices Revenue Share (%), by Country 2024 & 2032
- Figure 20: Middle East & Africa Semiconductor Power Devices Revenue (million), by Application 2024 & 2032
- Figure 21: Middle East & Africa Semiconductor Power Devices Revenue Share (%), by Application 2024 & 2032
- Figure 22: Middle East & Africa Semiconductor Power Devices Revenue (million), by Type 2024 & 2032
- Figure 23: Middle East & Africa Semiconductor Power Devices Revenue Share (%), by Type 2024 & 2032
- Figure 24: Middle East & Africa Semiconductor Power Devices Revenue (million), by Country 2024 & 2032
- Figure 25: Middle East & Africa Semiconductor Power Devices Revenue Share (%), by Country 2024 & 2032
- Figure 26: Asia Pacific Semiconductor Power Devices Revenue (million), by Application 2024 & 2032
- Figure 27: Asia Pacific Semiconductor Power Devices Revenue Share (%), by Application 2024 & 2032
- Figure 28: Asia Pacific Semiconductor Power Devices Revenue (million), by Type 2024 & 2032
- Figure 29: Asia Pacific Semiconductor Power Devices Revenue Share (%), by Type 2024 & 2032
- Figure 30: Asia Pacific Semiconductor Power Devices Revenue (million), by Country 2024 & 2032
- Figure 31: Asia Pacific Semiconductor Power Devices Revenue Share (%), by Country 2024 & 2032
List of Tables
- Table 1: Global Semiconductor Power Devices Revenue million Forecast, by Region 2019 & 2032
- Table 2: Global Semiconductor Power Devices Revenue million Forecast, by Application 2019 & 2032
- Table 3: Global Semiconductor Power Devices Revenue million Forecast, by Type 2019 & 2032
- Table 4: Global Semiconductor Power Devices Revenue million Forecast, by Region 2019 & 2032
- Table 5: Global Semiconductor Power Devices Revenue million Forecast, by Application 2019 & 2032
- Table 6: Global Semiconductor Power Devices Revenue million Forecast, by Type 2019 & 2032
- Table 7: Global Semiconductor Power Devices Revenue million Forecast, by Country 2019 & 2032
- Table 8: United States Semiconductor Power Devices Revenue (million) Forecast, by Application 2019 & 2032
- Table 9: Canada Semiconductor Power Devices Revenue (million) Forecast, by Application 2019 & 2032
- Table 10: Mexico Semiconductor Power Devices Revenue (million) Forecast, by Application 2019 & 2032
- Table 11: Global Semiconductor Power Devices Revenue million Forecast, by Application 2019 & 2032
- Table 12: Global Semiconductor Power Devices Revenue million Forecast, by Type 2019 & 2032
- Table 13: Global Semiconductor Power Devices Revenue million Forecast, by Country 2019 & 2032
- Table 14: Brazil Semiconductor Power Devices Revenue (million) Forecast, by Application 2019 & 2032
- Table 15: Argentina Semiconductor Power Devices Revenue (million) Forecast, by Application 2019 & 2032
- Table 16: Rest of South America Semiconductor Power Devices Revenue (million) Forecast, by Application 2019 & 2032
- Table 17: Global Semiconductor Power Devices Revenue million Forecast, by Application 2019 & 2032
- Table 18: Global Semiconductor Power Devices Revenue million Forecast, by Type 2019 & 2032
- Table 19: Global Semiconductor Power Devices Revenue million Forecast, by Country 2019 & 2032
- Table 20: United Kingdom Semiconductor Power Devices Revenue (million) Forecast, by Application 2019 & 2032
- Table 21: Germany Semiconductor Power Devices Revenue (million) Forecast, by Application 2019 & 2032
- Table 22: France Semiconductor Power Devices Revenue (million) Forecast, by Application 2019 & 2032
- Table 23: Italy Semiconductor Power Devices Revenue (million) Forecast, by Application 2019 & 2032
- Table 24: Spain Semiconductor Power Devices Revenue (million) Forecast, by Application 2019 & 2032
- Table 25: Russia Semiconductor Power Devices Revenue (million) Forecast, by Application 2019 & 2032
- Table 26: Benelux Semiconductor Power Devices Revenue (million) Forecast, by Application 2019 & 2032
- Table 27: Nordics Semiconductor Power Devices Revenue (million) Forecast, by Application 2019 & 2032
- Table 28: Rest of Europe Semiconductor Power Devices Revenue (million) Forecast, by Application 2019 & 2032
- Table 29: Global Semiconductor Power Devices Revenue million Forecast, by Application 2019 & 2032
- Table 30: Global Semiconductor Power Devices Revenue million Forecast, by Type 2019 & 2032
- Table 31: Global Semiconductor Power Devices Revenue million Forecast, by Country 2019 & 2032
- Table 32: Turkey Semiconductor Power Devices Revenue (million) Forecast, by Application 2019 & 2032
- Table 33: Israel Semiconductor Power Devices Revenue (million) Forecast, by Application 2019 & 2032
- Table 34: GCC Semiconductor Power Devices Revenue (million) Forecast, by Application 2019 & 2032
- Table 35: North Africa Semiconductor Power Devices Revenue (million) Forecast, by Application 2019 & 2032
- Table 36: South Africa Semiconductor Power Devices Revenue (million) Forecast, by Application 2019 & 2032
- Table 37: Rest of Middle East & Africa Semiconductor Power Devices Revenue (million) Forecast, by Application 2019 & 2032
- Table 38: Global Semiconductor Power Devices Revenue million Forecast, by Application 2019 & 2032
- Table 39: Global Semiconductor Power Devices Revenue million Forecast, by Type 2019 & 2032
- Table 40: Global Semiconductor Power Devices Revenue million Forecast, by Country 2019 & 2032
- Table 41: China Semiconductor Power Devices Revenue (million) Forecast, by Application 2019 & 2032
- Table 42: India Semiconductor Power Devices Revenue (million) Forecast, by Application 2019 & 2032
- Table 43: Japan Semiconductor Power Devices Revenue (million) Forecast, by Application 2019 & 2032
- Table 44: South Korea Semiconductor Power Devices Revenue (million) Forecast, by Application 2019 & 2032
- Table 45: ASEAN Semiconductor Power Devices Revenue (million) Forecast, by Application 2019 & 2032
- Table 46: Oceania Semiconductor Power Devices Revenue (million) Forecast, by Application 2019 & 2032
- Table 47: Rest of Asia Pacific Semiconductor Power Devices Revenue (million) Forecast, by Application 2019 & 2032
Frequently Asked Questions
1. What is the projected Compound Annual Growth Rate (CAGR) of the Semiconductor Power Devices?
The projected CAGR is approximately 4.3%.
2. Which companies are prominent players in the Semiconductor Power Devices?
Key companies in the market include Infineon, Texas Instruments, ST Microelectronics, Renesas Electronics, ON Semiconductor, Alpha & Omega Semiconductor, Mitsubishi Electric (Vincotech), Toshiba, Vishay Intertechnology, Fuji Electric, Rohm, Nexperia, Microsemi, Littelfuse (IXYS), Cree (Wolfspeed), Microchip, GeneSiC Semiconductor Inc., NXP Semiconductors, Power Integrations, Inc., Broadcom, Panasonic, NEC Electronics, Mikron, Altech, Jiangsu Jiejie Microelectronics, OmniVision Technologies, Jilin Sino-Microelectronics, Fuman Electronics, Yangzhou Yangjie Electronic Technology, Suzhou Good-Ark Electronics, SEMIKRON, Stanson Technology, MagnaChip, KEC Corporation, IKO-SEM, Unisonic Technologies(UTC), CET-MOS Corporation, Hangzhou Silan Microelectronics, ABB, Hitachi, Danfoss, CRRC, BYD.
3. What are the main segments of the Semiconductor Power Devices?
The market segments include Application, Type.
4. Can you provide details about the market size?
The market size is estimated to be USD 66470 million as of 2022.
5. What are some drivers contributing to market growth?
N/A
6. What are the notable trends driving market growth?
N/A
7. Are there any restraints impacting market growth?
N/A
8. Can you provide examples of recent developments in the market?
N/A
9. What pricing options are available for accessing the report?
Pricing options include single-user, multi-user, and enterprise licenses priced at USD 2900.00, USD 4350.00, and USD 5800.00 respectively.
10. Is the market size provided in terms of value or volume?
The market size is provided in terms of value, measured in million.
11. Are there any specific market keywords associated with the report?
Yes, the market keyword associated with the report is "Semiconductor Power Devices," which aids in identifying and referencing the specific market segment covered.
12. How do I determine which pricing option suits my needs best?
The pricing options vary based on user requirements and access needs. Individual users may opt for single-user licenses, while businesses requiring broader access may choose multi-user or enterprise licenses for cost-effective access to the report.
13. Are there any additional resources or data provided in the Semiconductor Power Devices report?
While the report offers comprehensive insights, it's advisable to review the specific contents or supplementary materials provided to ascertain if additional resources or data are available.
14. How can I stay updated on further developments or reports in the Semiconductor Power Devices?
To stay informed about further developments, trends, and reports in the Semiconductor Power Devices, consider subscribing to industry newsletters, following relevant companies and organizations, or regularly checking reputable industry news sources and publications.
Methodology
Step 1 - Identification of Relevant Samples Size from Population Database


Step 2 - Approaches for Defining Global Market Size (Value, Volume* & Price*)

Note*: In applicable scenarios
Step 3 - Data Sources
Primary Research
- Web Analytics
- Survey Reports
- Research Institute
- Latest Research Reports
- Opinion Leaders
Secondary Research
- Annual Reports
- White Paper
- Latest Press Release
- Industry Association
- Paid Database
- Investor Presentations

Step 4 - Data Triangulation
Involves using different sources of information in order to increase the validity of a study
These sources are likely to be stakeholders in a program - participants, other researchers, program staff, other community members, and so on.
Then we put all data in single framework & apply various statistical tools to find out the dynamic on the market.
During the analysis stage, feedback from the stakeholder groups would be compared to determine areas of agreement as well as areas of divergence


