
Key Insights
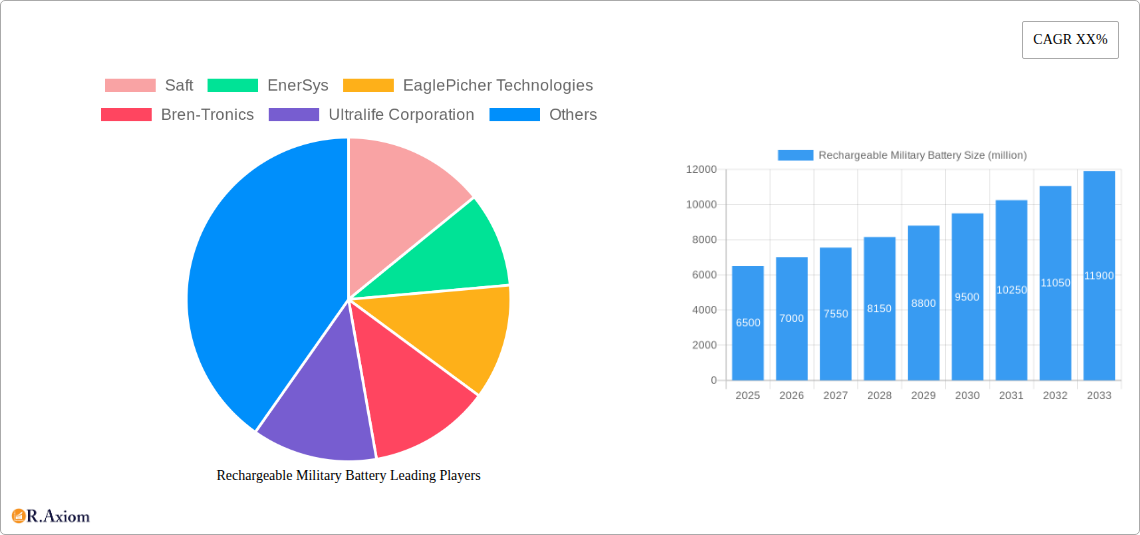
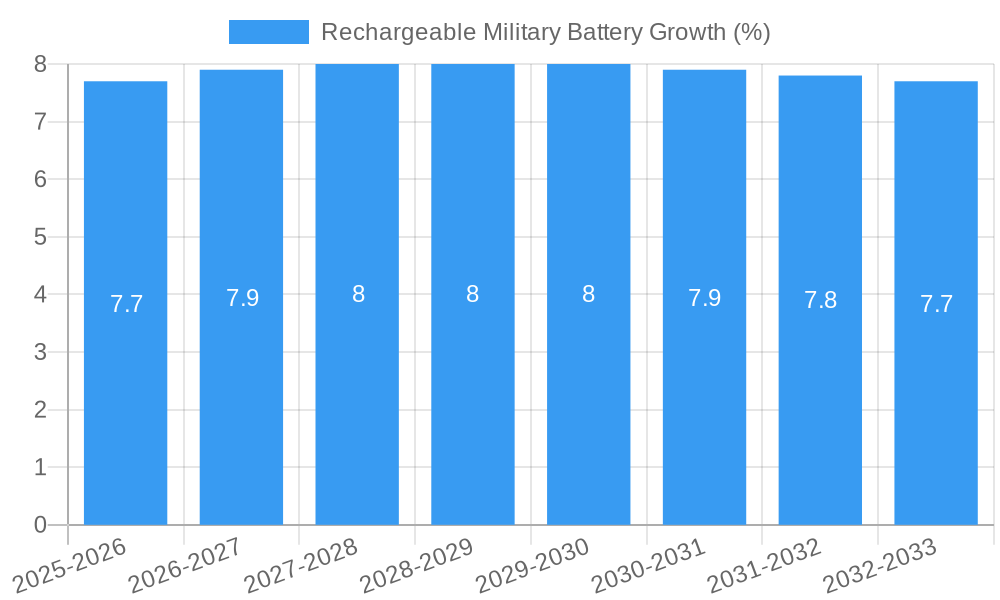
The global Rechargeable Military Battery market is poised for significant expansion, projected to reach a substantial market size of $6,500 million by 2025, with an estimated CAGR of 7.5% throughout the forecast period. This robust growth is underpinned by the increasing demand for advanced power solutions that can reliably support a wide array of sophisticated military applications. Key drivers include the continuous technological evolution in defense systems, requiring more powerful and longer-lasting batteries for portable electronics, communication devices, unmanned aerial vehicles (UAVs), and advanced weapon systems. The emphasis on enhanced soldier lethality and survivability through improved battlefield situational awareness and communication further fuels this demand. Additionally, the ongoing modernization of military fleets and the development of next-generation defense platforms necessitate innovative battery technologies that offer superior energy density, faster charging capabilities, and improved safety profiles.
The market is segmenting strategically, with Lithium Batteries anticipated to dominate due to their superior energy density, lighter weight, and longer cycle life compared to traditional lead-acid and nickel-based alternatives. Applications like Propulsion Systems and Auxiliary Power are expected to be major contributors, driven by the increasing electrification of military vehicles and the need for dependable power for critical onboard systems. Geographically, Asia Pacific is emerging as a high-growth region, propelled by significant defense spending and ongoing military modernization initiatives in countries like China and India. While the market benefits from strong demand, restraints such as the high cost of advanced battery chemistries and the complex regulatory landscape surrounding battery disposal and recycling present challenges. However, the persistent drive for operational efficiency, reduced logistical burden, and enhanced mission effectiveness ensures a dynamic and upward trajectory for the rechargeable military battery market.
Rechargeable Military Battery Market Concentration & Innovation
The rechargeable military battery market exhibits a moderate to high concentration, with key players like Saft, EnerSys, and EaglePicher Technologies dominating significant portions of the global landscape. Innovation is a primary driver, fueled by the continuous demand for enhanced power density, extended lifespan, improved safety features, and rapid charging capabilities to meet evolving military operational requirements. Regulatory frameworks, particularly those focusing on environmental sustainability and battery safety standards, are increasingly influencing product development and market entry. Product substitutes, such as advanced single-use batteries or alternative power sources, pose a constant challenge, albeit less prevalent in critical military applications where reliability and rechargeability are paramount. End-user trends are heavily skewed towards lighter, more compact, and higher-performing battery solutions for portable electronic devices, unmanned systems, and advanced combat vehicles. Mergers and Acquisitions (M&A) activities are strategically focused on consolidating expertise, expanding product portfolios, and securing market share. For instance, recent M&A deal values have reached several hundred million dollars, indicating significant investment and consolidation within the sector. Key innovation drivers include the development of next-generation battery chemistries, such as solid-state batteries, and advancements in battery management systems (BMS) to optimize performance and safety.
Rechargeable Military Battery Industry Trends & Insights
The global rechargeable military battery market is poised for substantial growth, driven by escalating defense budgets and the increasing adoption of advanced technologies in military operations worldwide. The market is projected to expand at a Compound Annual Growth Rate (CAGR) of approximately 7.5% from 2025 to 2033, with an estimated market size of over 40 million in 2025. This growth is underpinned by the burgeoning demand for reliable and high-performance power solutions for a wide array of military applications, including advanced communication systems, unmanned aerial vehicles (UAVs), sophisticated surveillance equipment, and modern soldier-worn electronics. Technological disruptions are playing a pivotal role, with significant advancements in lithium-ion battery technology, including lithium-sulfur and solid-state batteries, offering superior energy density and safety profiles compared to traditional chemistries. These innovations are crucial for reducing the weight and size of power sources, thereby enhancing soldier mobility and operational effectiveness. Consumer preferences within the military sector are evolving, with a strong emphasis on longer operational times, faster recharge capabilities, and greater durability in harsh environmental conditions. The competitive dynamics of the market are characterized by intense R&D efforts, strategic partnerships, and a continuous drive for cost optimization. Companies are investing heavily in developing batteries that can withstand extreme temperatures, shock, and vibration, ensuring operational continuity in diverse combat scenarios. Furthermore, the increasing reliance on portable electronic devices and networked warfare necessitates robust and dependable power sources. The market penetration of advanced battery technologies is expected to rise significantly as military forces worldwide prioritize modernization and the integration of cutting-edge equipment. The ongoing geopolitical landscape also contributes to the sustained demand, as nations seek to maintain a technological edge and enhance their defense capabilities. The emphasis on interoperability and standardization across different military platforms also influences battery design and development, pushing for versatile and adaptable power solutions.
Dominant Markets & Segments in Rechargeable Military Battery
The rechargeable military battery market is characterized by distinct dominant regions and segments, driven by specific military procurement policies, technological adoption rates, and operational requirements.
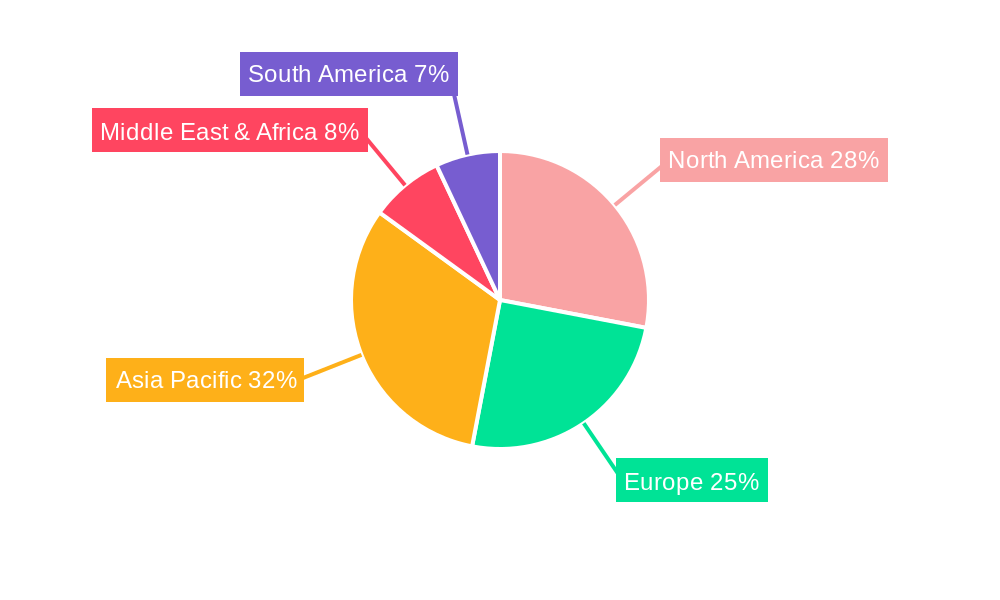
Dominant Region: North America, particularly the United States, currently holds a dominant position in the rechargeable military battery market.
- Key Drivers for North American Dominance:
- High Defense Spending: The United States consistently allocates substantial portions of its national budget to defense modernization and procurement, driving demand for advanced military equipment and, consequently, high-performance batteries.
- Technological Leadership: A strong ecosystem of research and development, coupled with leading battery manufacturers, enables the nation to pioneer and adopt cutting-edge battery technologies.
- Global Military Presence: The extensive deployment of military forces in various regions necessitates a robust supply chain for reliable and durable power solutions.
- Supportive Government Policies: Favorable government policies and funding for defense research and innovation foster the development and adoption of advanced battery technologies.
Dominant Segment by Application: Communication and Navigation systems represent a significant and growing segment within the rechargeable military battery market.
- Factors Contributing to Dominance:
- Ubiquitous Need: Modern warfare relies heavily on sophisticated communication and navigation equipment, from soldier-worn radios to airborne reconnaissance systems and ground vehicle command centers. These systems are power-intensive and require continuous, reliable power.
- Increased Sophistication: The trend towards networked warfare and the integration of advanced sensors, GPS, and secure communication protocols further amplify the power demands of these devices.
- Portable Electronics: The proliferation of portable electronic devices for soldiers, including tactical tablets, GPS units, and night vision devices, directly contributes to the high demand for rechargeable batteries for this segment.
- Endurance Requirements: Extended mission durations in remote and challenging environments necessitate batteries with high energy density and long operational lifespans for communication and navigation equipment.
Dominant Segment by Type: Lithium Battery technology currently dominates the rechargeable military battery market, and its dominance is expected to persist.
- Reasons for Lithium Battery Dominance:
- High Energy Density: Lithium-ion batteries offer significantly higher energy density compared to lead-acid or nickel-based batteries, allowing for smaller, lighter power sources without compromising operational time. This is crucial for portable and weight-sensitive military applications.
- Long Cycle Life: Modern lithium-ion chemistries provide a substantial number of charge-discharge cycles, reducing the total cost of ownership and the logistical burden of battery replacements.
- Low Self-Discharge Rate: This characteristic ensures that batteries retain their charge for extended periods, making them ideal for standby applications and long deployments.
- Versatility: Lithium batteries can be tailored to meet a wide range of voltage and capacity requirements, making them suitable for diverse military applications, from small tactical devices to larger vehicle systems.
- Technological Advancements: Continuous research and development in lithium-ion chemistry, including the exploration of advanced materials and architectures, further enhance their performance, safety, and cost-effectiveness.
The interplay of these regional and segment strengths shapes the overall market landscape, with ongoing investments and innovation likely to further solidify these dominance patterns while simultaneously fostering growth in emerging areas.
Rechargeable Military Battery Product Developments
Rechargeable military battery manufacturers are actively developing advanced products characterized by enhanced energy density, improved safety features, and extended operational lifespans. Innovations focus on next-generation lithium-ion chemistries, including solid-state batteries, which promise higher performance and inherent safety. These developments are driven by the demand for lighter, more compact power solutions for soldier-worn systems, unmanned vehicles, and advanced battlefield electronics. The competitive advantage lies in offering batteries that can withstand extreme environmental conditions, provide rapid charging capabilities, and integrate seamlessly with sophisticated military hardware, ultimately boosting operational efficiency and soldier effectiveness in demanding scenarios.
Report Scope & Segmentation Analysis
This report comprehensively analyzes the global rechargeable military battery market, segmenting it by application and battery type to provide detailed insights.
Application Segments:
- Propulsion Systems: This segment encompasses batteries powering electric vehicles, drones, and other mobile military platforms. Projected growth is substantial, driven by the increasing electrification of military assets. Market size is estimated to be in the hundreds of millions.
- Auxiliary Power: Batteries used for secondary functions like powering sensors, lighting, and communication devices on larger platforms. This segment shows steady growth due to the increasing complexity of military equipment. Market size is estimated to be in the hundreds of millions.
- Backup Power: Essential for critical systems to ensure continuity in case of primary power failure, this segment is vital for command centers, communication hubs, and essential equipment. It is expected to see consistent demand with a market size in the hundreds of millions.
- Communication and Navigation: As detailed previously, this is a dominant segment with robust growth, covering batteries for radios, GPS units, and tactical communication devices. Market size is estimated to be in the billions.
- Fire Fighting System: Batteries supporting fire suppression systems in military vehicles and facilities, a niche but critical segment with stable demand and a market size in the tens of millions.
- Other: This category includes batteries for a wide range of specialized military equipment not covered in the primary segments, exhibiting moderate growth and a market size in the hundreds of millions.
Type Segments:
- Lithium Battery: The leading segment, encompassing various lithium-ion chemistries, expected to witness robust growth due to its high performance. Market size is estimated to be in the billions.
- Lead-acid Battery: While declining in some advanced applications, still relevant for certain legacy systems and cost-sensitive applications. Market size is estimated to be in the hundreds of millions.
- Nickel Battery: Including NiCd and NiMH, these are being superseded by lithium-ion but remain in use for specific applications requiring robustness. Market size is estimated to be in the hundreds of millions.
- Others: This includes emerging battery technologies and less common chemistries, with potential for future growth and a market size in the tens of millions.
Key Drivers of Rechargeable Military Battery Growth
The growth of the rechargeable military battery market is propelled by several interconnected factors. Foremost is the escalating geopolitical instability and the consequent increase in global defense spending, leading to modernization efforts and the procurement of advanced military hardware. Technological advancements in battery chemistries, particularly lithium-ion, are crucial, offering higher energy density, longer cycle life, and improved safety, which are essential for modern warfare. The increasing adoption of unmanned systems (UAVs, UUVs, UGVs) across various military branches significantly boosts demand for lightweight and high-performance rechargeable batteries. Furthermore, the trend towards electrification of military vehicles and the growing reliance on portable electronic devices for soldiers further contribute to market expansion. Favorable government initiatives supporting domestic battery manufacturing and R&D also play a pivotal role.
Challenges in the Rechargeable Military Battery Sector
Despite the robust growth prospects, the rechargeable military battery sector faces several significant challenges. Stringent safety regulations and compliance standards, particularly concerning thermal runaway and operational safety in extreme conditions, can increase development costs and time-to-market. Supply chain disruptions, especially for critical raw materials like lithium, cobalt, and nickel, pose a constant threat, leading to price volatility and potential production delays. The high cost of advanced battery technologies, while decreasing, can still be a barrier for some military procurements. Furthermore, the need for batteries to withstand extreme environmental conditions, including wide temperature ranges, shock, and vibration, necessitates extensive and costly testing and validation processes. The competitive pressure from both established players and emerging technologies also demands continuous innovation and cost optimization.
Emerging Opportunities in Rechargeable Military Battery
The rechargeable military battery market presents several promising emerging opportunities. The development and widespread adoption of solid-state batteries offer a significant leap forward in terms of safety, energy density, and longevity, representing a key growth area. The increasing demand for specialized batteries for unmanned aerial vehicles (UAVs) and other autonomous systems, including long-endurance drones and underwater vehicles, is a rapidly expanding market. Furthermore, the trend towards battery-as-a-service models and advanced battery management systems (BMS) for predictive maintenance and optimized performance creates new business avenues. The focus on sustainable and ethical sourcing of raw materials also opens opportunities for manufacturers prioritizing eco-friendly and socially responsible battery production. Exploring new chemistries and advanced materials to further enhance performance and reduce costs will continue to drive innovation.
Leading Players in the Rechargeable Military Battery Market
- Saft
- EnerSys
- EaglePicher Technologies
- Bren-Tronics
- Ultralife Corporation
- EVE Energy
- Tadiran Batteries
- Denchi Group
- Kokam Battery
- Cell-Con
- Lincad
- Highpower Technology
- GS Yuasa Corporation
- GZPSC Co.,Ltd.
Key Developments in Rechargeable Military Battery Industry
- 2023: Saft launches a new generation of high-energy-density lithium-ion batteries for tactical radio applications, enhancing soldier portability and operational range.
- 2023: EnerSys announces a strategic partnership with a major defense contractor to develop advanced battery systems for next-generation armored vehicles.
- 2023: EaglePicher Technologies receives a significant contract to supply specialized batteries for advanced unmanned aerial systems, highlighting their expertise in high-performance solutions.
- 2022: Ultralife Corporation introduces a new family of intelligent batteries with integrated communication capabilities for enhanced battlefield situational awareness.
- 2022: Tadiran Batteries expands its product line with high-temperature tolerant batteries designed for extreme operating environments.
- 2022: EVE Energy invests heavily in R&D for solid-state battery technology, signaling a commitment to future power solutions.
- 2021: Bren-Tronics secures a multi-year agreement for the supply of ruggedized rechargeable batteries to a leading international defense force.
- 2021: Denchi Group acquires a specialist battery management system company, enhancing its integrated power solutions offering.
Strategic Outlook for Rechargeable Military Battery Market
The strategic outlook for the rechargeable military battery market remains exceptionally strong, driven by ongoing global defense modernization and the relentless pursuit of technological superiority by armed forces. Key growth catalysts include the continued demand for higher energy density, lighter weight, and more robust power solutions for a widening array of military applications, from advanced soldier systems to sophisticated unmanned platforms. Investments in R&D for next-generation battery chemistries, such as solid-state batteries, will be critical for maintaining a competitive edge. Furthermore, strategic partnerships and collaborations among battery manufacturers, defense contractors, and research institutions will be vital for accelerating innovation and meeting the evolving demands of the military sector. The market is expected to see continued consolidation and specialization as companies strive to offer comprehensive and integrated power solutions.
Rechargeable Military Battery Segmentation
-
1. Application
- 1.1. Propulsion Systems
- 1.2. Auxiliary Power
- 1.3. Backup Power
- 1.4. Communication and Navigation
- 1.5. Fire Fighting System
- 1.6. Other
-
2. Types
- 2.1. Lithium Battery
- 2.2. Lead-acid Battery
- 2.3. Nickel Battery
- 2.4. Others
Rechargeable Military Battery Segmentation By Geography
-
1. North America
- 1.1. United States
- 1.2. Canada
- 1.3. Mexico
-
2. South America
- 2.1. Brazil
- 2.2. Argentina
- 2.3. Rest of South America
-
3. Europe
- 3.1. United Kingdom
- 3.2. Germany
- 3.3. France
- 3.4. Italy
- 3.5. Spain
- 3.6. Russia
- 3.7. Benelux
- 3.8. Nordics
- 3.9. Rest of Europe
-
4. Middle East & Africa
- 4.1. Turkey
- 4.2. Israel
- 4.3. GCC
- 4.4. North Africa
- 4.5. South Africa
- 4.6. Rest of Middle East & Africa
-
5. Asia Pacific
- 5.1. China
- 5.2. India
- 5.3. Japan
- 5.4. South Korea
- 5.5. ASEAN
- 5.6. Oceania
- 5.7. Rest of Asia Pacific
Rechargeable Military Battery REPORT HIGHLIGHTS
| Aspects | Details |
|---|---|
| Study Period | 2019-2033 |
| Base Year | 2024 |
| Estimated Year | 2025 |
| Forecast Period | 2025-2033 |
| Historical Period | 2019-2024 |
| Growth Rate | CAGR of XX% from 2019-2033 |
| Segmentation |
|
Table of Contents
- 1. Introduction
- 1.1. Research Scope
- 1.2. Market Segmentation
- 1.3. Research Methodology
- 1.4. Definitions and Assumptions
- 2. Executive Summary
- 2.1. Introduction
- 3. Market Dynamics
- 3.1. Introduction
- 3.2. Market Drivers
- 3.3. Market Restrains
- 3.4. Market Trends
- 4. Market Factor Analysis
- 4.1. Porters Five Forces
- 4.2. Supply/Value Chain
- 4.3. PESTEL analysis
- 4.4. Market Entropy
- 4.5. Patent/Trademark Analysis
- 5. Global Rechargeable Military Battery Analysis, Insights and Forecast, 2019-2031
- 5.1. Market Analysis, Insights and Forecast - by Application
- 5.1.1. Propulsion Systems
- 5.1.2. Auxiliary Power
- 5.1.3. Backup Power
- 5.1.4. Communication and Navigation
- 5.1.5. Fire Fighting System
- 5.1.6. Other
- 5.2. Market Analysis, Insights and Forecast - by Types
- 5.2.1. Lithium Battery
- 5.2.2. Lead-acid Battery
- 5.2.3. Nickel Battery
- 5.2.4. Others
- 5.3. Market Analysis, Insights and Forecast - by Region
- 5.3.1. North America
- 5.3.2. South America
- 5.3.3. Europe
- 5.3.4. Middle East & Africa
- 5.3.5. Asia Pacific
- 5.1. Market Analysis, Insights and Forecast - by Application
- 6. North America Rechargeable Military Battery Analysis, Insights and Forecast, 2019-2031
- 6.1. Market Analysis, Insights and Forecast - by Application
- 6.1.1. Propulsion Systems
- 6.1.2. Auxiliary Power
- 6.1.3. Backup Power
- 6.1.4. Communication and Navigation
- 6.1.5. Fire Fighting System
- 6.1.6. Other
- 6.2. Market Analysis, Insights and Forecast - by Types
- 6.2.1. Lithium Battery
- 6.2.2. Lead-acid Battery
- 6.2.3. Nickel Battery
- 6.2.4. Others
- 6.1. Market Analysis, Insights and Forecast - by Application
- 7. South America Rechargeable Military Battery Analysis, Insights and Forecast, 2019-2031
- 7.1. Market Analysis, Insights and Forecast - by Application
- 7.1.1. Propulsion Systems
- 7.1.2. Auxiliary Power
- 7.1.3. Backup Power
- 7.1.4. Communication and Navigation
- 7.1.5. Fire Fighting System
- 7.1.6. Other
- 7.2. Market Analysis, Insights and Forecast - by Types
- 7.2.1. Lithium Battery
- 7.2.2. Lead-acid Battery
- 7.2.3. Nickel Battery
- 7.2.4. Others
- 7.1. Market Analysis, Insights and Forecast - by Application
- 8. Europe Rechargeable Military Battery Analysis, Insights and Forecast, 2019-2031
- 8.1. Market Analysis, Insights and Forecast - by Application
- 8.1.1. Propulsion Systems
- 8.1.2. Auxiliary Power
- 8.1.3. Backup Power
- 8.1.4. Communication and Navigation
- 8.1.5. Fire Fighting System
- 8.1.6. Other
- 8.2. Market Analysis, Insights and Forecast - by Types
- 8.2.1. Lithium Battery
- 8.2.2. Lead-acid Battery
- 8.2.3. Nickel Battery
- 8.2.4. Others
- 8.1. Market Analysis, Insights and Forecast - by Application
- 9. Middle East & Africa Rechargeable Military Battery Analysis, Insights and Forecast, 2019-2031
- 9.1. Market Analysis, Insights and Forecast - by Application
- 9.1.1. Propulsion Systems
- 9.1.2. Auxiliary Power
- 9.1.3. Backup Power
- 9.1.4. Communication and Navigation
- 9.1.5. Fire Fighting System
- 9.1.6. Other
- 9.2. Market Analysis, Insights and Forecast - by Types
- 9.2.1. Lithium Battery
- 9.2.2. Lead-acid Battery
- 9.2.3. Nickel Battery
- 9.2.4. Others
- 9.1. Market Analysis, Insights and Forecast - by Application
- 10. Asia Pacific Rechargeable Military Battery Analysis, Insights and Forecast, 2019-2031
- 10.1. Market Analysis, Insights and Forecast - by Application
- 10.1.1. Propulsion Systems
- 10.1.2. Auxiliary Power
- 10.1.3. Backup Power
- 10.1.4. Communication and Navigation
- 10.1.5. Fire Fighting System
- 10.1.6. Other
- 10.2. Market Analysis, Insights and Forecast - by Types
- 10.2.1. Lithium Battery
- 10.2.2. Lead-acid Battery
- 10.2.3. Nickel Battery
- 10.2.4. Others
- 10.1. Market Analysis, Insights and Forecast - by Application
- 11. Competitive Analysis
- 11.1. Global Market Share Analysis 2024
- 11.2. Company Profiles
- 11.2.1 Saft
- 11.2.1.1. Overview
- 11.2.1.2. Products
- 11.2.1.3. SWOT Analysis
- 11.2.1.4. Recent Developments
- 11.2.1.5. Financials (Based on Availability)
- 11.2.2 EnerSys
- 11.2.2.1. Overview
- 11.2.2.2. Products
- 11.2.2.3. SWOT Analysis
- 11.2.2.4. Recent Developments
- 11.2.2.5. Financials (Based on Availability)
- 11.2.3 EaglePicher Technologies
- 11.2.3.1. Overview
- 11.2.3.2. Products
- 11.2.3.3. SWOT Analysis
- 11.2.3.4. Recent Developments
- 11.2.3.5. Financials (Based on Availability)
- 11.2.4 Bren-Tronics
- 11.2.4.1. Overview
- 11.2.4.2. Products
- 11.2.4.3. SWOT Analysis
- 11.2.4.4. Recent Developments
- 11.2.4.5. Financials (Based on Availability)
- 11.2.5 Ultralife Corporation
- 11.2.5.1. Overview
- 11.2.5.2. Products
- 11.2.5.3. SWOT Analysis
- 11.2.5.4. Recent Developments
- 11.2.5.5. Financials (Based on Availability)
- 11.2.6 EVE Energy
- 11.2.6.1. Overview
- 11.2.6.2. Products
- 11.2.6.3. SWOT Analysis
- 11.2.6.4. Recent Developments
- 11.2.6.5. Financials (Based on Availability)
- 11.2.7 Tadiran Batteries
- 11.2.7.1. Overview
- 11.2.7.2. Products
- 11.2.7.3. SWOT Analysis
- 11.2.7.4. Recent Developments
- 11.2.7.5. Financials (Based on Availability)
- 11.2.8 Denchi Group
- 11.2.8.1. Overview
- 11.2.8.2. Products
- 11.2.8.3. SWOT Analysis
- 11.2.8.4. Recent Developments
- 11.2.8.5. Financials (Based on Availability)
- 11.2.9 Kokam Battery
- 11.2.9.1. Overview
- 11.2.9.2. Products
- 11.2.9.3. SWOT Analysis
- 11.2.9.4. Recent Developments
- 11.2.9.5. Financials (Based on Availability)
- 11.2.10 Cell-Con
- 11.2.10.1. Overview
- 11.2.10.2. Products
- 11.2.10.3. SWOT Analysis
- 11.2.10.4. Recent Developments
- 11.2.10.5. Financials (Based on Availability)
- 11.2.11 Lincad
- 11.2.11.1. Overview
- 11.2.11.2. Products
- 11.2.11.3. SWOT Analysis
- 11.2.11.4. Recent Developments
- 11.2.11.5. Financials (Based on Availability)
- 11.2.12 Highpower Technology
- 11.2.12.1. Overview
- 11.2.12.2. Products
- 11.2.12.3. SWOT Analysis
- 11.2.12.4. Recent Developments
- 11.2.12.5. Financials (Based on Availability)
- 11.2.13 GS Yuasa Corporation
- 11.2.13.1. Overview
- 11.2.13.2. Products
- 11.2.13.3. SWOT Analysis
- 11.2.13.4. Recent Developments
- 11.2.13.5. Financials (Based on Availability)
- 11.2.14 GZPSC Co.
- 11.2.14.1. Overview
- 11.2.14.2. Products
- 11.2.14.3. SWOT Analysis
- 11.2.14.4. Recent Developments
- 11.2.14.5. Financials (Based on Availability)
- 11.2.15 Ltd.
- 11.2.15.1. Overview
- 11.2.15.2. Products
- 11.2.15.3. SWOT Analysis
- 11.2.15.4. Recent Developments
- 11.2.15.5. Financials (Based on Availability)
- 11.2.1 Saft
List of Figures
- Figure 1: Global Rechargeable Military Battery Revenue Breakdown (million, %) by Region 2024 & 2032
- Figure 2: Global Rechargeable Military Battery Volume Breakdown (K, %) by Region 2024 & 2032
- Figure 3: North America Rechargeable Military Battery Revenue (million), by Application 2024 & 2032
- Figure 4: North America Rechargeable Military Battery Volume (K), by Application 2024 & 2032
- Figure 5: North America Rechargeable Military Battery Revenue Share (%), by Application 2024 & 2032
- Figure 6: North America Rechargeable Military Battery Volume Share (%), by Application 2024 & 2032
- Figure 7: North America Rechargeable Military Battery Revenue (million), by Types 2024 & 2032
- Figure 8: North America Rechargeable Military Battery Volume (K), by Types 2024 & 2032
- Figure 9: North America Rechargeable Military Battery Revenue Share (%), by Types 2024 & 2032
- Figure 10: North America Rechargeable Military Battery Volume Share (%), by Types 2024 & 2032
- Figure 11: North America Rechargeable Military Battery Revenue (million), by Country 2024 & 2032
- Figure 12: North America Rechargeable Military Battery Volume (K), by Country 2024 & 2032
- Figure 13: North America Rechargeable Military Battery Revenue Share (%), by Country 2024 & 2032
- Figure 14: North America Rechargeable Military Battery Volume Share (%), by Country 2024 & 2032
- Figure 15: South America Rechargeable Military Battery Revenue (million), by Application 2024 & 2032
- Figure 16: South America Rechargeable Military Battery Volume (K), by Application 2024 & 2032
- Figure 17: South America Rechargeable Military Battery Revenue Share (%), by Application 2024 & 2032
- Figure 18: South America Rechargeable Military Battery Volume Share (%), by Application 2024 & 2032
- Figure 19: South America Rechargeable Military Battery Revenue (million), by Types 2024 & 2032
- Figure 20: South America Rechargeable Military Battery Volume (K), by Types 2024 & 2032
- Figure 21: South America Rechargeable Military Battery Revenue Share (%), by Types 2024 & 2032
- Figure 22: South America Rechargeable Military Battery Volume Share (%), by Types 2024 & 2032
- Figure 23: South America Rechargeable Military Battery Revenue (million), by Country 2024 & 2032
- Figure 24: South America Rechargeable Military Battery Volume (K), by Country 2024 & 2032
- Figure 25: South America Rechargeable Military Battery Revenue Share (%), by Country 2024 & 2032
- Figure 26: South America Rechargeable Military Battery Volume Share (%), by Country 2024 & 2032
- Figure 27: Europe Rechargeable Military Battery Revenue (million), by Application 2024 & 2032
- Figure 28: Europe Rechargeable Military Battery Volume (K), by Application 2024 & 2032
- Figure 29: Europe Rechargeable Military Battery Revenue Share (%), by Application 2024 & 2032
- Figure 30: Europe Rechargeable Military Battery Volume Share (%), by Application 2024 & 2032
- Figure 31: Europe Rechargeable Military Battery Revenue (million), by Types 2024 & 2032
- Figure 32: Europe Rechargeable Military Battery Volume (K), by Types 2024 & 2032
- Figure 33: Europe Rechargeable Military Battery Revenue Share (%), by Types 2024 & 2032
- Figure 34: Europe Rechargeable Military Battery Volume Share (%), by Types 2024 & 2032
- Figure 35: Europe Rechargeable Military Battery Revenue (million), by Country 2024 & 2032
- Figure 36: Europe Rechargeable Military Battery Volume (K), by Country 2024 & 2032
- Figure 37: Europe Rechargeable Military Battery Revenue Share (%), by Country 2024 & 2032
- Figure 38: Europe Rechargeable Military Battery Volume Share (%), by Country 2024 & 2032
- Figure 39: Middle East & Africa Rechargeable Military Battery Revenue (million), by Application 2024 & 2032
- Figure 40: Middle East & Africa Rechargeable Military Battery Volume (K), by Application 2024 & 2032
- Figure 41: Middle East & Africa Rechargeable Military Battery Revenue Share (%), by Application 2024 & 2032
- Figure 42: Middle East & Africa Rechargeable Military Battery Volume Share (%), by Application 2024 & 2032
- Figure 43: Middle East & Africa Rechargeable Military Battery Revenue (million), by Types 2024 & 2032
- Figure 44: Middle East & Africa Rechargeable Military Battery Volume (K), by Types 2024 & 2032
- Figure 45: Middle East & Africa Rechargeable Military Battery Revenue Share (%), by Types 2024 & 2032
- Figure 46: Middle East & Africa Rechargeable Military Battery Volume Share (%), by Types 2024 & 2032
- Figure 47: Middle East & Africa Rechargeable Military Battery Revenue (million), by Country 2024 & 2032
- Figure 48: Middle East & Africa Rechargeable Military Battery Volume (K), by Country 2024 & 2032
- Figure 49: Middle East & Africa Rechargeable Military Battery Revenue Share (%), by Country 2024 & 2032
- Figure 50: Middle East & Africa Rechargeable Military Battery Volume Share (%), by Country 2024 & 2032
- Figure 51: Asia Pacific Rechargeable Military Battery Revenue (million), by Application 2024 & 2032
- Figure 52: Asia Pacific Rechargeable Military Battery Volume (K), by Application 2024 & 2032
- Figure 53: Asia Pacific Rechargeable Military Battery Revenue Share (%), by Application 2024 & 2032
- Figure 54: Asia Pacific Rechargeable Military Battery Volume Share (%), by Application 2024 & 2032
- Figure 55: Asia Pacific Rechargeable Military Battery Revenue (million), by Types 2024 & 2032
- Figure 56: Asia Pacific Rechargeable Military Battery Volume (K), by Types 2024 & 2032
- Figure 57: Asia Pacific Rechargeable Military Battery Revenue Share (%), by Types 2024 & 2032
- Figure 58: Asia Pacific Rechargeable Military Battery Volume Share (%), by Types 2024 & 2032
- Figure 59: Asia Pacific Rechargeable Military Battery Revenue (million), by Country 2024 & 2032
- Figure 60: Asia Pacific Rechargeable Military Battery Volume (K), by Country 2024 & 2032
- Figure 61: Asia Pacific Rechargeable Military Battery Revenue Share (%), by Country 2024 & 2032
- Figure 62: Asia Pacific Rechargeable Military Battery Volume Share (%), by Country 2024 & 2032
List of Tables
- Table 1: Global Rechargeable Military Battery Revenue million Forecast, by Region 2019 & 2032
- Table 2: Global Rechargeable Military Battery Volume K Forecast, by Region 2019 & 2032
- Table 3: Global Rechargeable Military Battery Revenue million Forecast, by Application 2019 & 2032
- Table 4: Global Rechargeable Military Battery Volume K Forecast, by Application 2019 & 2032
- Table 5: Global Rechargeable Military Battery Revenue million Forecast, by Types 2019 & 2032
- Table 6: Global Rechargeable Military Battery Volume K Forecast, by Types 2019 & 2032
- Table 7: Global Rechargeable Military Battery Revenue million Forecast, by Region 2019 & 2032
- Table 8: Global Rechargeable Military Battery Volume K Forecast, by Region 2019 & 2032
- Table 9: Global Rechargeable Military Battery Revenue million Forecast, by Application 2019 & 2032
- Table 10: Global Rechargeable Military Battery Volume K Forecast, by Application 2019 & 2032
- Table 11: Global Rechargeable Military Battery Revenue million Forecast, by Types 2019 & 2032
- Table 12: Global Rechargeable Military Battery Volume K Forecast, by Types 2019 & 2032
- Table 13: Global Rechargeable Military Battery Revenue million Forecast, by Country 2019 & 2032
- Table 14: Global Rechargeable Military Battery Volume K Forecast, by Country 2019 & 2032
- Table 15: United States Rechargeable Military Battery Revenue (million) Forecast, by Application 2019 & 2032
- Table 16: United States Rechargeable Military Battery Volume (K) Forecast, by Application 2019 & 2032
- Table 17: Canada Rechargeable Military Battery Revenue (million) Forecast, by Application 2019 & 2032
- Table 18: Canada Rechargeable Military Battery Volume (K) Forecast, by Application 2019 & 2032
- Table 19: Mexico Rechargeable Military Battery Revenue (million) Forecast, by Application 2019 & 2032
- Table 20: Mexico Rechargeable Military Battery Volume (K) Forecast, by Application 2019 & 2032
- Table 21: Global Rechargeable Military Battery Revenue million Forecast, by Application 2019 & 2032
- Table 22: Global Rechargeable Military Battery Volume K Forecast, by Application 2019 & 2032
- Table 23: Global Rechargeable Military Battery Revenue million Forecast, by Types 2019 & 2032
- Table 24: Global Rechargeable Military Battery Volume K Forecast, by Types 2019 & 2032
- Table 25: Global Rechargeable Military Battery Revenue million Forecast, by Country 2019 & 2032
- Table 26: Global Rechargeable Military Battery Volume K Forecast, by Country 2019 & 2032
- Table 27: Brazil Rechargeable Military Battery Revenue (million) Forecast, by Application 2019 & 2032
- Table 28: Brazil Rechargeable Military Battery Volume (K) Forecast, by Application 2019 & 2032
- Table 29: Argentina Rechargeable Military Battery Revenue (million) Forecast, by Application 2019 & 2032
- Table 30: Argentina Rechargeable Military Battery Volume (K) Forecast, by Application 2019 & 2032
- Table 31: Rest of South America Rechargeable Military Battery Revenue (million) Forecast, by Application 2019 & 2032
- Table 32: Rest of South America Rechargeable Military Battery Volume (K) Forecast, by Application 2019 & 2032
- Table 33: Global Rechargeable Military Battery Revenue million Forecast, by Application 2019 & 2032
- Table 34: Global Rechargeable Military Battery Volume K Forecast, by Application 2019 & 2032
- Table 35: Global Rechargeable Military Battery Revenue million Forecast, by Types 2019 & 2032
- Table 36: Global Rechargeable Military Battery Volume K Forecast, by Types 2019 & 2032
- Table 37: Global Rechargeable Military Battery Revenue million Forecast, by Country 2019 & 2032
- Table 38: Global Rechargeable Military Battery Volume K Forecast, by Country 2019 & 2032
- Table 39: United Kingdom Rechargeable Military Battery Revenue (million) Forecast, by Application 2019 & 2032
- Table 40: United Kingdom Rechargeable Military Battery Volume (K) Forecast, by Application 2019 & 2032
- Table 41: Germany Rechargeable Military Battery Revenue (million) Forecast, by Application 2019 & 2032
- Table 42: Germany Rechargeable Military Battery Volume (K) Forecast, by Application 2019 & 2032
- Table 43: France Rechargeable Military Battery Revenue (million) Forecast, by Application 2019 & 2032
- Table 44: France Rechargeable Military Battery Volume (K) Forecast, by Application 2019 & 2032
- Table 45: Italy Rechargeable Military Battery Revenue (million) Forecast, by Application 2019 & 2032
- Table 46: Italy Rechargeable Military Battery Volume (K) Forecast, by Application 2019 & 2032
- Table 47: Spain Rechargeable Military Battery Revenue (million) Forecast, by Application 2019 & 2032
- Table 48: Spain Rechargeable Military Battery Volume (K) Forecast, by Application 2019 & 2032
- Table 49: Russia Rechargeable Military Battery Revenue (million) Forecast, by Application 2019 & 2032
- Table 50: Russia Rechargeable Military Battery Volume (K) Forecast, by Application 2019 & 2032
- Table 51: Benelux Rechargeable Military Battery Revenue (million) Forecast, by Application 2019 & 2032
- Table 52: Benelux Rechargeable Military Battery Volume (K) Forecast, by Application 2019 & 2032
- Table 53: Nordics Rechargeable Military Battery Revenue (million) Forecast, by Application 2019 & 2032
- Table 54: Nordics Rechargeable Military Battery Volume (K) Forecast, by Application 2019 & 2032
- Table 55: Rest of Europe Rechargeable Military Battery Revenue (million) Forecast, by Application 2019 & 2032
- Table 56: Rest of Europe Rechargeable Military Battery Volume (K) Forecast, by Application 2019 & 2032
- Table 57: Global Rechargeable Military Battery Revenue million Forecast, by Application 2019 & 2032
- Table 58: Global Rechargeable Military Battery Volume K Forecast, by Application 2019 & 2032
- Table 59: Global Rechargeable Military Battery Revenue million Forecast, by Types 2019 & 2032
- Table 60: Global Rechargeable Military Battery Volume K Forecast, by Types 2019 & 2032
- Table 61: Global Rechargeable Military Battery Revenue million Forecast, by Country 2019 & 2032
- Table 62: Global Rechargeable Military Battery Volume K Forecast, by Country 2019 & 2032
- Table 63: Turkey Rechargeable Military Battery Revenue (million) Forecast, by Application 2019 & 2032
- Table 64: Turkey Rechargeable Military Battery Volume (K) Forecast, by Application 2019 & 2032
- Table 65: Israel Rechargeable Military Battery Revenue (million) Forecast, by Application 2019 & 2032
- Table 66: Israel Rechargeable Military Battery Volume (K) Forecast, by Application 2019 & 2032
- Table 67: GCC Rechargeable Military Battery Revenue (million) Forecast, by Application 2019 & 2032
- Table 68: GCC Rechargeable Military Battery Volume (K) Forecast, by Application 2019 & 2032
- Table 69: North Africa Rechargeable Military Battery Revenue (million) Forecast, by Application 2019 & 2032
- Table 70: North Africa Rechargeable Military Battery Volume (K) Forecast, by Application 2019 & 2032
- Table 71: South Africa Rechargeable Military Battery Revenue (million) Forecast, by Application 2019 & 2032
- Table 72: South Africa Rechargeable Military Battery Volume (K) Forecast, by Application 2019 & 2032
- Table 73: Rest of Middle East & Africa Rechargeable Military Battery Revenue (million) Forecast, by Application 2019 & 2032
- Table 74: Rest of Middle East & Africa Rechargeable Military Battery Volume (K) Forecast, by Application 2019 & 2032
- Table 75: Global Rechargeable Military Battery Revenue million Forecast, by Application 2019 & 2032
- Table 76: Global Rechargeable Military Battery Volume K Forecast, by Application 2019 & 2032
- Table 77: Global Rechargeable Military Battery Revenue million Forecast, by Types 2019 & 2032
- Table 78: Global Rechargeable Military Battery Volume K Forecast, by Types 2019 & 2032
- Table 79: Global Rechargeable Military Battery Revenue million Forecast, by Country 2019 & 2032
- Table 80: Global Rechargeable Military Battery Volume K Forecast, by Country 2019 & 2032
- Table 81: China Rechargeable Military Battery Revenue (million) Forecast, by Application 2019 & 2032
- Table 82: China Rechargeable Military Battery Volume (K) Forecast, by Application 2019 & 2032
- Table 83: India Rechargeable Military Battery Revenue (million) Forecast, by Application 2019 & 2032
- Table 84: India Rechargeable Military Battery Volume (K) Forecast, by Application 2019 & 2032
- Table 85: Japan Rechargeable Military Battery Revenue (million) Forecast, by Application 2019 & 2032
- Table 86: Japan Rechargeable Military Battery Volume (K) Forecast, by Application 2019 & 2032
- Table 87: South Korea Rechargeable Military Battery Revenue (million) Forecast, by Application 2019 & 2032
- Table 88: South Korea Rechargeable Military Battery Volume (K) Forecast, by Application 2019 & 2032
- Table 89: ASEAN Rechargeable Military Battery Revenue (million) Forecast, by Application 2019 & 2032
- Table 90: ASEAN Rechargeable Military Battery Volume (K) Forecast, by Application 2019 & 2032
- Table 91: Oceania Rechargeable Military Battery Revenue (million) Forecast, by Application 2019 & 2032
- Table 92: Oceania Rechargeable Military Battery Volume (K) Forecast, by Application 2019 & 2032
- Table 93: Rest of Asia Pacific Rechargeable Military Battery Revenue (million) Forecast, by Application 2019 & 2032
- Table 94: Rest of Asia Pacific Rechargeable Military Battery Volume (K) Forecast, by Application 2019 & 2032
Frequently Asked Questions
1. What is the projected Compound Annual Growth Rate (CAGR) of the Rechargeable Military Battery?
The projected CAGR is approximately XX%.
2. Which companies are prominent players in the Rechargeable Military Battery?
Key companies in the market include Saft, EnerSys, EaglePicher Technologies, Bren-Tronics, Ultralife Corporation, EVE Energy, Tadiran Batteries, Denchi Group, Kokam Battery, Cell-Con, Lincad, Highpower Technology, GS Yuasa Corporation, GZPSC Co., Ltd..
3. What are the main segments of the Rechargeable Military Battery?
The market segments include Application, Types.
4. Can you provide details about the market size?
The market size is estimated to be USD XXX million as of 2022.
5. What are some drivers contributing to market growth?
N/A
6. What are the notable trends driving market growth?
N/A
7. Are there any restraints impacting market growth?
N/A
8. Can you provide examples of recent developments in the market?
N/A
9. What pricing options are available for accessing the report?
Pricing options include single-user, multi-user, and enterprise licenses priced at USD 3950.00, USD 5925.00, and USD 7900.00 respectively.
10. Is the market size provided in terms of value or volume?
The market size is provided in terms of value, measured in million and volume, measured in K.
11. Are there any specific market keywords associated with the report?
Yes, the market keyword associated with the report is "Rechargeable Military Battery," which aids in identifying and referencing the specific market segment covered.
12. How do I determine which pricing option suits my needs best?
The pricing options vary based on user requirements and access needs. Individual users may opt for single-user licenses, while businesses requiring broader access may choose multi-user or enterprise licenses for cost-effective access to the report.
13. Are there any additional resources or data provided in the Rechargeable Military Battery report?
While the report offers comprehensive insights, it's advisable to review the specific contents or supplementary materials provided to ascertain if additional resources or data are available.
14. How can I stay updated on further developments or reports in the Rechargeable Military Battery?
To stay informed about further developments, trends, and reports in the Rechargeable Military Battery, consider subscribing to industry newsletters, following relevant companies and organizations, or regularly checking reputable industry news sources and publications.
Methodology
Step 1 - Identification of Relevant Samples Size from Population Database


Step 2 - Approaches for Defining Global Market Size (Value, Volume* & Price*)

Note*: In applicable scenarios
Step 3 - Data Sources
Primary Research
- Web Analytics
- Survey Reports
- Research Institute
- Latest Research Reports
- Opinion Leaders
Secondary Research
- Annual Reports
- White Paper
- Latest Press Release
- Industry Association
- Paid Database
- Investor Presentations

Step 4 - Data Triangulation
Involves using different sources of information in order to increase the validity of a study
These sources are likely to be stakeholders in a program - participants, other researchers, program staff, other community members, and so on.
Then we put all data in single framework & apply various statistical tools to find out the dynamic on the market.
During the analysis stage, feedback from the stakeholder groups would be compared to determine areas of agreement as well as areas of divergence


