Key Insights
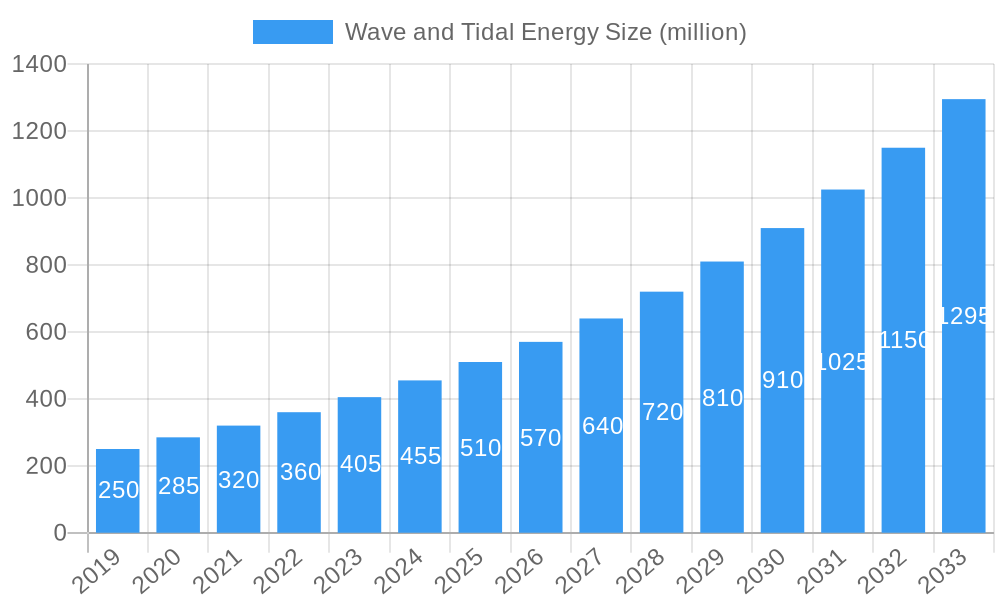
The global wave and tidal energy market is projected to experience substantial growth, reaching an estimated market size of $139 million by 2025. This expansion is driven by a notable Compound Annual Growth Rate (CAGR) of 11.3% from the base year. Key growth factors include supportive government initiatives, escalating demand for renewable energy sources, and technological advancements enhancing the commercial viability of wave and tidal power. The imperative to decarbonize energy systems and reduce fossil fuel dependency is a significant catalyst. The predictable nature of tidal energy, a distinct advantage over intermittent renewables like solar and wind, enhances grid stability and reliability, further stimulating market adoption. Emerging economies are also leveraging their extensive coastlines, opening new opportunities for market development.
Wave and Tidal Energy Market Size (In Million)
Market segmentation includes business and residential applications, with businesses adopting these predictable energy solutions. Residential adoption is anticipated to increase as technology becomes more accessible and cost-effective. Leading technologies include wave energy converters and tidal energy turbines, each offering unique deployment benefits and efficiency. Key geographical markets exhibiting strong potential are Europe, with the United Kingdom as a research and development leader, alongside growing interest in North America and the Asia Pacific. Potential restraints to market expansion include high initial capital investment, the requirement for specialized infrastructure, and complex environmental permitting processes. Nevertheless, continuous technological innovation and decreasing production costs are expected to overcome these challenges, ensuring sustained and significant market expansion.
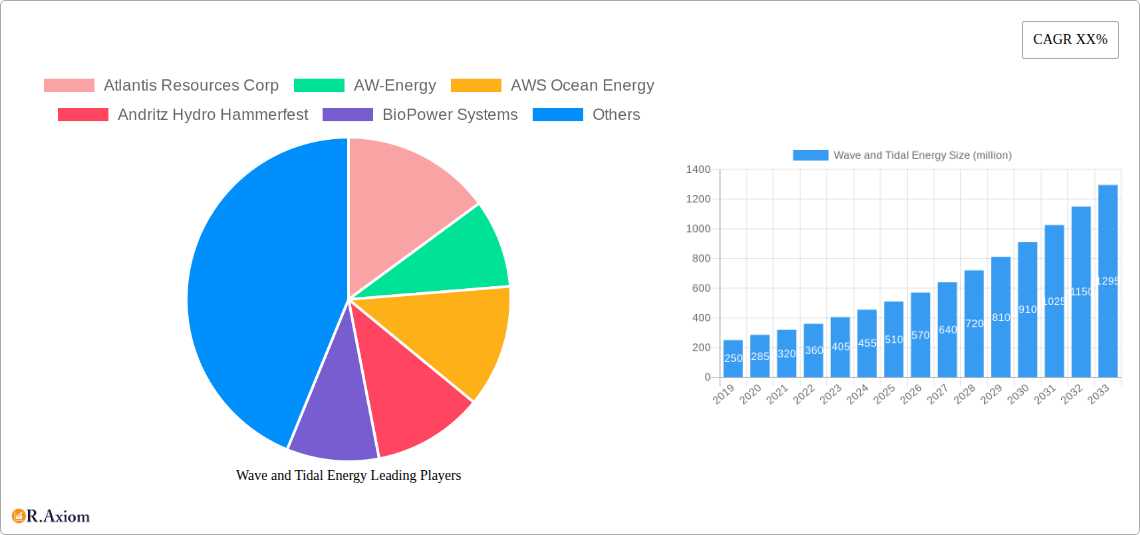
Wave and Tidal Energy Company Market Share
Wave and Tidal Energy Market Concentration & Innovation
The global wave and tidal energy market is characterized by a dynamic landscape where innovation and strategic partnerships are key drivers of growth. While still a nascent sector compared to other renewables, the market is exhibiting increasing concentration as leading companies invest heavily in research and development and secure crucial project funding. Key players like Atlantis Resources Corp, AW-Energy, and CorPower Ocean AB are at the forefront of this innovation, developing advanced turbine designs and wave energy converters (WECs) that promise greater efficiency and reliability. Regulatory frameworks are progressively maturing, with governments worldwide establishing supportive policies and incentives to accelerate the deployment of these technologies.
Key Metrics & Developments:
- Market Share: While precise current market share data is under continuous development, early adopters are beginning to establish dominant positions in pilot and pre-commercial projects. Atlantis Resources Corp, with its MeyGen project, is a significant player in tidal stream energy.
- Innovation Drivers: Technological advancements in materials science, power electronics, and marine engineering are paramount. Predictive maintenance algorithms and advanced hydrodynamic modeling are also crucial for optimizing performance and reducing operational costs.
- Regulatory Frameworks: Government support through feed-in tariffs, grants, and streamlined permitting processes is vital for de-risking investments. The European Union's Ocean Energy Strategy and national initiatives in countries like the UK, USA, and Australia are instrumental.
- Product Substitutes: While direct substitutes are limited in the energy sector, competing renewable energy sources like offshore wind and solar continue to evolve, putting pressure on wave and tidal energy to demonstrate competitive levelized cost of energy (LCOE).
- End-User Trends: Increasing demand for predictable, baseload renewable energy sources makes tidal energy particularly attractive. Wave energy is gaining traction for remote power applications and offshore infrastructure.
- M&A Activities: While still limited, strategic acquisitions and partnerships are expected to increase as the sector matures. Companies are seeking to acquire proprietary technologies, secure market access, or gain economies of scale. For instance, potential consolidation could occur as larger energy firms eye opportunities. Deal values are currently in the tens to hundreds of millions for significant project developments and technology acquisitions.
Wave and Tidal Energy Industry Trends & Insights
The wave and tidal energy sector is poised for significant expansion, driven by a confluence of technological breakthroughs, escalating demand for clean energy, and evolving environmental consciousness. The global market is anticipated to witness a robust Compound Annual Growth Rate (CAGR) of approximately 15-20% over the forecast period, projecting a market size potentially exceeding 50,000 million by 2033. This growth is underpinned by substantial investments in research and development aimed at enhancing the efficiency, reliability, and cost-effectiveness of wave and tidal energy conversion devices. Technological disruptions are continuously reshaping the industry, with advancements in materials science leading to more durable and corrosion-resistant components, crucial for surviving harsh marine environments. Furthermore, sophisticated predictive analytics and artificial intelligence are being integrated to optimize device performance, minimize maintenance downtime, and improve energy yield, thereby reducing the Levelized Cost of Energy (LCOE).
Consumer preferences are shifting towards sustainable and diversified energy portfolios. As governments and corporations set ambitious decarbonization targets, the unique attributes of wave and tidal energy – its predictability and high power density – are becoming increasingly attractive. Tidal energy, in particular, offers a predictable and consistent power source, making it an ideal complement to intermittent renewables like solar and wind, thus enhancing grid stability. Wave energy, while still facing more significant technological hurdles for large-scale commercialization, holds immense potential for distributed power generation and applications in remote or island communities.
Competitive dynamics are intensifying as established energy players begin to explore and invest in this emerging sector. Companies like Andritz Hydro Hammerfest and Voith Hydro are leveraging their expertise in hydropower to develop advanced tidal turbine solutions. Similarly, innovators such as CorPower Ocean AB and AW-Energy are making significant strides in wave energy converter (WEC) technology, focusing on survivability and efficient energy capture. Strategic alliances and collaborations between technology developers, project financiers, and grid operators are becoming more prevalent, aimed at de-risking projects and accelerating deployment. The market penetration of wave and tidal energy is currently low but is projected to grow substantially as demonstration projects transition to commercial-scale deployments, supported by supportive policy frameworks and declining LCOE. The increasing focus on marine renewable energy also stimulates job creation and economic development in coastal regions. The successful development of offshore renewable energy hubs will further catalyze this growth.
Dominant Markets & Segments in Wave and Tidal Energy
The global wave and tidal energy market is demonstrating a clear divergence in dominance across its various segments, with specific regions and applications showing stronger initial traction. The tidal energy segment, particularly for Businesses and industrial applications, is emerging as a frontrunner due to its inherent predictability and established technological pathways. Regions with strong tidal currents and supportive governmental policies, such as the United Kingdom, France, and parts of Canada, are leading the charge. The economic policies in these areas, including substantial R&D funding and attractive power purchase agreements, have been instrumental in fostering innovation and early-stage deployment.
Key Drivers for Dominance:
- Economic Policies: Subsidies, tax incentives, and favorable feed-in tariffs are crucial for reducing the initial investment burden and ensuring revenue certainty for wave and tidal energy projects.
- Infrastructure: The presence of existing or planned grid connections, port facilities, and skilled labor pools significantly impacts project viability. Coastal infrastructure development plays a pivotal role.
- Resource Availability: Geographical locations with abundant and consistent wave or tidal resources are naturally favored. Tidal stream energy projects, for example, are concentrated in areas with high flow rates.
- Regulatory Support: Streamlined permitting processes and clear consenting pathways reduce project development timelines and associated risks.
- Technological Maturity: Tidal stream turbines, benefiting from parallels with wind turbine technology, are currently more mature and commercially viable than many wave energy converter designs.
The dominance of tidal energy for business applications is driven by its capacity to provide reliable, baseload power, which is essential for industrial processes and large-scale energy needs. This predictability reduces the risk of supply interruption, a critical factor for commercial entities. Furthermore, the development of large-scale tidal stream projects, such as those spearheaded by ScottishPower Renewables Limited and Nova Innovation Limited, showcases the potential for significant energy generation and grid integration.
While wave energy also holds immense promise, its widespread adoption for powering Homes and Businesses is still in earlier stages of development. However, niche applications are emerging, such as powering offshore platforms, remote sensing equipment, and potentially localized microgrids for coastal communities. Companies like CorPower Ocean AB and AW-Energy are making significant advancements in WEC technology, focusing on efficiency, survivability, and cost reduction, which will be crucial for broader market penetration. The long-term outlook suggests that as wave energy technologies mature and LCOE decreases, its application for powering homes and businesses will expand considerably, particularly in island nations and remote coastal regions seeking energy independence. The demand for resilient and sustainable energy solutions is a universal trend that will eventually drive the adoption of both wave and tidal energy technologies across diverse applications.
Wave and Tidal Energy Product Developments
The wave and tidal energy sector is witnessing rapid product development, with a focus on increasing efficiency, durability, and cost-effectiveness. Innovations in tidal stream turbines, such as those developed by Atlantis Resources Corp and Andritz Hydro Hammerfest, emphasize optimized blade designs and advanced control systems for maximizing energy capture from tidal flows. In wave energy, companies like CorPower Ocean AB and AW-Energy are refining their Wave Energy Converter (WEC) designs, incorporating features like storm-proofing mechanisms and adaptive power take-off systems to ensure survivability and efficient energy generation across varied sea states. The competitive advantage of these new products lies in their enhanced reliability, reduced maintenance requirements, and lower projected Levelized Cost of Energy (LCOE), making them increasingly attractive for commercial deployment.
Report Scope & Segmentation Analysis
This report provides a comprehensive analysis of the global wave and tidal energy market, covering the period from 2019 to 2033. The market is segmented by Application, including Homes and Businesses, and by Type, encompassing Wave Energy and Tidal Energy.
Application Segments:
- Homes: This segment focuses on the potential for wave and tidal energy to power residential communities, particularly in remote or island locations, emphasizing micro-generation and off-grid solutions. Growth projections for this segment are moderate in the short term, driven by niche applications and increasing demand for energy independence.
- Businesses: This segment analyzes the deployment of wave and tidal energy for commercial and industrial use, including powering offshore installations, manufacturing facilities, and contributing to grid supply. This segment is projected to experience significant growth due to the demand for predictable and clean energy.
Type Segments:
- Wave Energy: This segment examines the various technologies and market dynamics related to harnessing energy from ocean waves. It includes an assessment of current technological readiness, deployment challenges, and future growth potential, with a focus on innovative WEC designs.
- Tidal Energy: This segment delves into the technologies and market trends associated with capturing energy from tidal currents and tidal ranges. It highlights the greater maturity of tidal stream technologies and their potential for large-scale grid connection.
Key Drivers of Wave and Tidal Energy Growth
The growth of the wave and tidal energy sector is propelled by a multifaceted set of drivers. Technologically, continuous innovation in turbine design, materials science, and power conversion systems is leading to more efficient and reliable devices. For example, advanced hydrodynamic modeling and smart control systems are optimizing energy capture from fluctuating ocean conditions. Economically, increasing global demand for clean, renewable energy sources, coupled with rising fossil fuel prices, makes wave and tidal energy increasingly competitive. Government incentives, such as research grants, tax credits, and favorable Power Purchase Agreements (PPAs), play a crucial role in de-risking investments and accelerating deployment. Furthermore, regulatory frameworks that support the development of marine renewable energy infrastructure are essential. The need for grid diversification and energy security also drives investment in these predictable renewable sources.
Challenges in the Wave and Tidal Energy Sector
Despite its potential, the wave and tidal energy sector faces several significant challenges. High upfront capital costs for the development and installation of marine energy devices remain a substantial barrier, exacerbated by the harsh and corrosive marine environment which necessitates robust and expensive materials. Regulatory hurdles and lengthy consenting processes can lead to project delays and increased costs. Supply chain limitations and the need for specialized infrastructure and skilled labor for installation and maintenance also present obstacles. Moreover, the intermittent nature of wave resources and the localized availability of strong tidal currents limit widespread deployment. Competitive pressures from more established renewable energy technologies, such as offshore wind and solar, also necessitate continuous cost reduction and performance improvements.
Emerging Opportunities in Wave and Tidal Energy
Emerging opportunities in the wave and tidal energy sector are largely centered on technological maturation and market diversification. The development of hybrid offshore energy systems, integrating wave and tidal energy with offshore wind or floating solar, presents a significant avenue for optimizing resource utilization and grid integration. Advances in floating offshore energy platforms are opening up new geographical areas for deployment, particularly in deeper waters where traditional fixed foundations are not feasible. The increasing demand for predictable, dispatchable renewable energy to balance intermittent sources like solar and wind is a key opportunity for tidal energy. Furthermore, the potential for wave and tidal energy to power remote communities, offshore infrastructure (like oil and gas platforms), and the burgeoning blue economy sector (e.g., aquaculture) offers significant growth prospects.
Leading Players in the Wave and Tidal Energy Market
- Atlantis Resources Corp
- AW-Energy
- AWS Ocean Energy
- Andritz Hydro Hammerfest
- BioPower Systems
- Kepler Energy Limited
- Minesto
- Ocean Power Technologies
- Pelamis Wave Power Limited
- Seabased AB
- Trident Energy
- Wave Dragon
- Wave Star Energy A/S
- Wello Oy
- Ocean Renewable Power Company
- Carnegie Clean Energy Limited
- CorPower Ocean AB
- Nautricity Limited
- Openhydro
- Seatricity Limited
- ScottishPower Renewables Limited
- Tocardo International BV
- Voith Hydro
- Aquamarine Power Limited
- Mako Tidal Turbines
- Nova Innovation Limited
Key Developments in Wave and Tidal Energy Industry
- 2023/09: CorPower Ocean AB successfully completes its third phase of testing for its flagship WEC, demonstrating significant power output and survivability in challenging sea conditions.
- 2023/07: Atlantis Resources Corp announces a new strategic partnership to develop a significant tidal stream project in Southeast Asia, aiming to leverage its proven turbine technology.
- 2023/05: AW-Energy’s WaveRoller device achieves a major milestone with sustained grid-connected operation, showcasing its potential for commercial wave energy generation.
- 2023/03: Nova Innovation Limited deploys its latest generation of tidal turbines in the Shetland Islands, demonstrating increased efficiency and reduced installation time.
- 2023/01: Minesto successfully completes the commissioning of its latest Kite Power System, marking a step towards the commercialization of its unique underwater kite technology.
- 2022/11: Ocean Power Technologies (OPT) announces the successful offshore testing of its PowerBuoy system, highlighting its capabilities for remote power applications.
- 2022/09: Andritz Hydro Hammerfest receives approval for a significant tidal energy project in Europe, signaling renewed investment in tidal stream technology.
- 2022/07: Carnegie Clean Energy Limited advances its CETO WEC technology with successful prototype testing in Australia, focusing on improved energy capture.
- 2022/05: Wello Oy progresses with its Penguin WEC technology, securing funding for a commercial-scale deployment project in the North Sea.
- 2022/03: Tocardo International BV expands its tidal turbine offerings, developing solutions for a wider range of flow conditions and power requirements.
Strategic Outlook for Wave and Tidal Energy Market
The strategic outlook for the wave and tidal energy market is one of burgeoning potential, driven by the global imperative for decarbonization and energy security. As technological advancements continue to drive down costs and improve performance, both wave and tidal energy are poised to play an increasingly significant role in the future energy mix. The predictability of tidal energy makes it a valuable asset for grid stability, complementing intermittent renewables. Emerging opportunities in powering remote communities and offshore industrial applications provide immediate growth avenues. Continued government support, coupled with strategic investments in research, development, and commercial-scale deployments, will be critical to unlocking the full potential of these vast marine resources and transforming them into a significant source of clean electricity worldwide.
Wave and Tidal Energy Segmentation
-
1. Application
- 1.1. Homes
- 1.2. Businesses
-
2. Types
- 2.1. Wave Energy
- 2.2. Tidal Energy
Wave and Tidal Energy Segmentation By Geography
-
1. North America
- 1.1. United States
- 1.2. Canada
- 1.3. Mexico
-
2. South America
- 2.1. Brazil
- 2.2. Argentina
- 2.3. Rest of South America
-
3. Europe
- 3.1. United Kingdom
- 3.2. Germany
- 3.3. France
- 3.4. Italy
- 3.5. Spain
- 3.6. Russia
- 3.7. Benelux
- 3.8. Nordics
- 3.9. Rest of Europe
-
4. Middle East & Africa
- 4.1. Turkey
- 4.2. Israel
- 4.3. GCC
- 4.4. North Africa
- 4.5. South Africa
- 4.6. Rest of Middle East & Africa
-
5. Asia Pacific
- 5.1. China
- 5.2. India
- 5.3. Japan
- 5.4. South Korea
- 5.5. ASEAN
- 5.6. Oceania
- 5.7. Rest of Asia Pacific
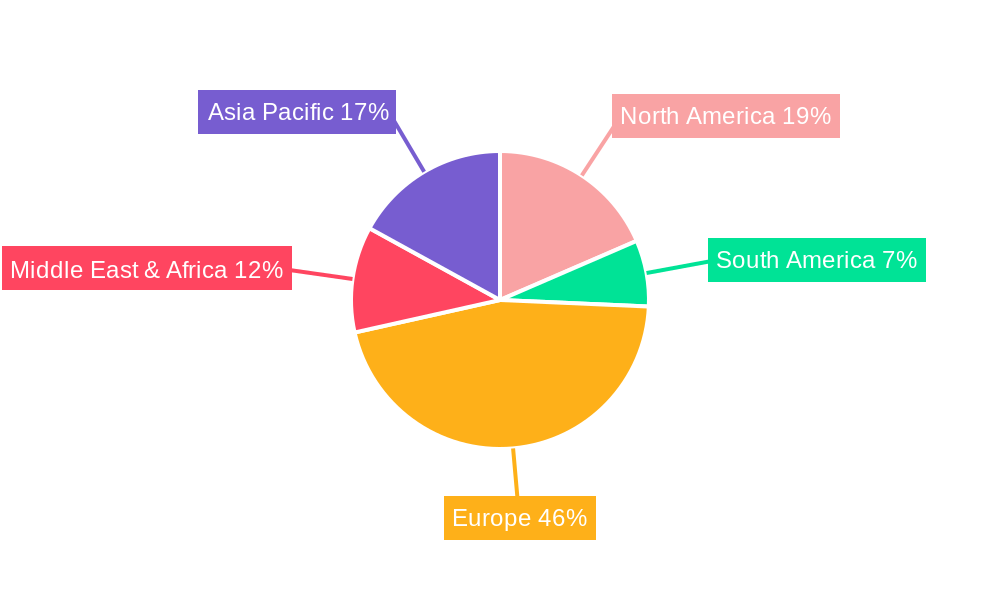
Wave and Tidal Energy Regional Market Share
Geographic Coverage of Wave and Tidal Energy
Wave and Tidal Energy REPORT HIGHLIGHTS
| Aspects | Details |
|---|---|
| Study Period | 2020-2034 |
| Base Year | 2025 |
| Estimated Year | 2026 |
| Forecast Period | 2026-2034 |
| Historical Period | 2020-2025 |
| Growth Rate | CAGR of 11.3% from 2020-2034 |
| Segmentation |
|
Table of Contents
- 1. Introduction
- 1.1. Research Scope
- 1.2. Market Segmentation
- 1.3. Research Objective
- 1.4. Definitions and Assumptions
- 2. Executive Summary
- 2.1. Market Snapshot
- 3. Market Dynamics
- 3.1. Market Drivers
- 3.2. Market Restrains
- 3.3. Market Trends
- 3.4. Market Opportunities
- 4. Market Factor Analysis
- 4.1. Porters Five Forces
- 4.1.1. Bargaining Power of Suppliers
- 4.1.2. Bargaining Power of Buyers
- 4.1.3. Threat of New Entrants
- 4.1.4. Threat of Substitutes
- 4.1.5. Competitive Rivalry
- 4.2. PESTEL analysis
- 4.3. BCG Analysis
- 4.3.1. Stars (High Growth, High Market Share)
- 4.3.2. Cash Cows (Low Growth, High Market Share)
- 4.3.3. Question Mark (High Growth, Low Market Share)
- 4.3.4. Dogs (Low Growth, Low Market Share)
- 4.4. Ansoff Matrix Analysis
- 4.5. Supply Chain Analysis
- 4.6. Regulatory Landscape
- 4.7. Current Market Potential and Opportunity Assessment (TAM–SAM–SOM Framework)
- 4.8. RAX Analyst Note
- 4.1. Porters Five Forces
- 5. Market Analysis, Insights and Forecast 2021-2033
- 5.1. Market Analysis, Insights and Forecast - by Application
- 5.1.1. Homes
- 5.1.2. Businesses
- 5.2. Market Analysis, Insights and Forecast - by Types
- 5.2.1. Wave Energy
- 5.2.2. Tidal Energy
- 5.3. Market Analysis, Insights and Forecast - by Region
- 5.3.1. North America
- 5.3.2. South America
- 5.3.3. Europe
- 5.3.4. Middle East & Africa
- 5.3.5. Asia Pacific
- 5.1. Market Analysis, Insights and Forecast - by Application
- 6. Global Wave and Tidal Energy Analysis, Insights and Forecast, 2021-2033
- 6.1. Market Analysis, Insights and Forecast - by Application
- 6.1.1. Homes
- 6.1.2. Businesses
- 6.2. Market Analysis, Insights and Forecast - by Types
- 6.2.1. Wave Energy
- 6.2.2. Tidal Energy
- 6.1. Market Analysis, Insights and Forecast - by Application
- 7. North America Wave and Tidal Energy Analysis, Insights and Forecast, 2020-2032
- 7.1. Market Analysis, Insights and Forecast - by Application
- 7.1.1. Homes
- 7.1.2. Businesses
- 7.2. Market Analysis, Insights and Forecast - by Types
- 7.2.1. Wave Energy
- 7.2.2. Tidal Energy
- 7.1. Market Analysis, Insights and Forecast - by Application
- 8. South America Wave and Tidal Energy Analysis, Insights and Forecast, 2020-2032
- 8.1. Market Analysis, Insights and Forecast - by Application
- 8.1.1. Homes
- 8.1.2. Businesses
- 8.2. Market Analysis, Insights and Forecast - by Types
- 8.2.1. Wave Energy
- 8.2.2. Tidal Energy
- 8.1. Market Analysis, Insights and Forecast - by Application
- 9. Europe Wave and Tidal Energy Analysis, Insights and Forecast, 2020-2032
- 9.1. Market Analysis, Insights and Forecast - by Application
- 9.1.1. Homes
- 9.1.2. Businesses
- 9.2. Market Analysis, Insights and Forecast - by Types
- 9.2.1. Wave Energy
- 9.2.2. Tidal Energy
- 9.1. Market Analysis, Insights and Forecast - by Application
- 10. Middle East & Africa Wave and Tidal Energy Analysis, Insights and Forecast, 2020-2032
- 10.1. Market Analysis, Insights and Forecast - by Application
- 10.1.1. Homes
- 10.1.2. Businesses
- 10.2. Market Analysis, Insights and Forecast - by Types
- 10.2.1. Wave Energy
- 10.2.2. Tidal Energy
- 10.1. Market Analysis, Insights and Forecast - by Application
- 11. Asia Pacific Wave and Tidal Energy Analysis, Insights and Forecast, 2020-2032
- 11.1. Market Analysis, Insights and Forecast - by Application
- 11.1.1. Homes
- 11.1.2. Businesses
- 11.2. Market Analysis, Insights and Forecast - by Types
- 11.2.1. Wave Energy
- 11.2.2. Tidal Energy
- 11.1. Market Analysis, Insights and Forecast - by Application
- 12. Competitive Analysis
- 12.1. Company Profiles
- 12.1.1 Atlantis Resources Corp
- 12.1.1.1. Company Overview
- 12.1.1.2. Products
- 12.1.1.3. Company Financials
- 12.1.1.4. SWOT Analysis
- 12.1.2 AW-Energy
- 12.1.2.1. Company Overview
- 12.1.2.2. Products
- 12.1.2.3. Company Financials
- 12.1.2.4. SWOT Analysis
- 12.1.3 AWS Ocean Energy
- 12.1.3.1. Company Overview
- 12.1.3.2. Products
- 12.1.3.3. Company Financials
- 12.1.3.4. SWOT Analysis
- 12.1.4 Andritz Hydro Hammerfest
- 12.1.4.1. Company Overview
- 12.1.4.2. Products
- 12.1.4.3. Company Financials
- 12.1.4.4. SWOT Analysis
- 12.1.5 BioPower Systems
- 12.1.5.1. Company Overview
- 12.1.5.2. Products
- 12.1.5.3. Company Financials
- 12.1.5.4. SWOT Analysis
- 12.1.6 Kepler Energy Limited
- 12.1.6.1. Company Overview
- 12.1.6.2. Products
- 12.1.6.3. Company Financials
- 12.1.6.4. SWOT Analysis
- 12.1.7 Minesto
- 12.1.7.1. Company Overview
- 12.1.7.2. Products
- 12.1.7.3. Company Financials
- 12.1.7.4. SWOT Analysis
- 12.1.8 Ocean Power Technologies
- 12.1.8.1. Company Overview
- 12.1.8.2. Products
- 12.1.8.3. Company Financials
- 12.1.8.4. SWOT Analysis
- 12.1.9 Pelamis Wave Power Limited
- 12.1.9.1. Company Overview
- 12.1.9.2. Products
- 12.1.9.3. Company Financials
- 12.1.9.4. SWOT Analysis
- 12.1.10 Seabased AB
- 12.1.10.1. Company Overview
- 12.1.10.2. Products
- 12.1.10.3. Company Financials
- 12.1.10.4. SWOT Analysis
- 12.1.11 Trident Energy
- 12.1.11.1. Company Overview
- 12.1.11.2. Products
- 12.1.11.3. Company Financials
- 12.1.11.4. SWOT Analysis
- 12.1.12 Wave Dragon
- 12.1.12.1. Company Overview
- 12.1.12.2. Products
- 12.1.12.3. Company Financials
- 12.1.12.4. SWOT Analysis
- 12.1.13 Wave Star Energy A/S
- 12.1.13.1. Company Overview
- 12.1.13.2. Products
- 12.1.13.3. Company Financials
- 12.1.13.4. SWOT Analysis
- 12.1.14 Wello Oy
- 12.1.14.1. Company Overview
- 12.1.14.2. Products
- 12.1.14.3. Company Financials
- 12.1.14.4. SWOT Analysis
- 12.1.15 Ocean Renewable Power Company
- 12.1.15.1. Company Overview
- 12.1.15.2. Products
- 12.1.15.3. Company Financials
- 12.1.15.4. SWOT Analysis
- 12.1.16 Carnegie Clean Energy Limited
- 12.1.16.1. Company Overview
- 12.1.16.2. Products
- 12.1.16.3. Company Financials
- 12.1.16.4. SWOT Analysis
- 12.1.17 CorPower Ocean AB
- 12.1.17.1. Company Overview
- 12.1.17.2. Products
- 12.1.17.3. Company Financials
- 12.1.17.4. SWOT Analysis
- 12.1.18 Nautricity Limited
- 12.1.18.1. Company Overview
- 12.1.18.2. Products
- 12.1.18.3. Company Financials
- 12.1.18.4. SWOT Analysis
- 12.1.19 Openhydro
- 12.1.19.1. Company Overview
- 12.1.19.2. Products
- 12.1.19.3. Company Financials
- 12.1.19.4. SWOT Analysis
- 12.1.20 Seatricity Limited
- 12.1.20.1. Company Overview
- 12.1.20.2. Products
- 12.1.20.3. Company Financials
- 12.1.20.4. SWOT Analysis
- 12.1.21 ScottishPower Renewables Limited
- 12.1.21.1. Company Overview
- 12.1.21.2. Products
- 12.1.21.3. Company Financials
- 12.1.21.4. SWOT Analysis
- 12.1.22 Tocardo International BV
- 12.1.22.1. Company Overview
- 12.1.22.2. Products
- 12.1.22.3. Company Financials
- 12.1.22.4. SWOT Analysis
- 12.1.23 Voith Hydro
- 12.1.23.1. Company Overview
- 12.1.23.2. Products
- 12.1.23.3. Company Financials
- 12.1.23.4. SWOT Analysis
- 12.1.24 Aquamarine Power Limited
- 12.1.24.1. Company Overview
- 12.1.24.2. Products
- 12.1.24.3. Company Financials
- 12.1.24.4. SWOT Analysis
- 12.1.25 Mako Tidal Turbines
- 12.1.25.1. Company Overview
- 12.1.25.2. Products
- 12.1.25.3. Company Financials
- 12.1.25.4. SWOT Analysis
- 12.1.26 Nova Innovation Limited
- 12.1.26.1. Company Overview
- 12.1.26.2. Products
- 12.1.26.3. Company Financials
- 12.1.26.4. SWOT Analysis
- 12.1.1 Atlantis Resources Corp
- 12.2. Market Entropy
- 12.2.1 Company's Key Areas Served
- 12.2.2 Recent Developments
- 12.3. Company Market Share Analysis 2025
- 12.3.1 Top 5 Companies Market Share Analysis
- 12.3.2 Top 3 Companies Market Share Analysis
- 12.4. List of Potential Customers
- 13. Research Methodology
List of Figures
- Figure 1: Global Wave and Tidal Energy Revenue Breakdown (million, %) by Region 2025 & 2033
- Figure 2: North America Wave and Tidal Energy Revenue (million), by Application 2025 & 2033
- Figure 3: North America Wave and Tidal Energy Revenue Share (%), by Application 2025 & 2033
- Figure 4: North America Wave and Tidal Energy Revenue (million), by Types 2025 & 2033
- Figure 5: North America Wave and Tidal Energy Revenue Share (%), by Types 2025 & 2033
- Figure 6: North America Wave and Tidal Energy Revenue (million), by Country 2025 & 2033
- Figure 7: North America Wave and Tidal Energy Revenue Share (%), by Country 2025 & 2033
- Figure 8: South America Wave and Tidal Energy Revenue (million), by Application 2025 & 2033
- Figure 9: South America Wave and Tidal Energy Revenue Share (%), by Application 2025 & 2033
- Figure 10: South America Wave and Tidal Energy Revenue (million), by Types 2025 & 2033
- Figure 11: South America Wave and Tidal Energy Revenue Share (%), by Types 2025 & 2033
- Figure 12: South America Wave and Tidal Energy Revenue (million), by Country 2025 & 2033
- Figure 13: South America Wave and Tidal Energy Revenue Share (%), by Country 2025 & 2033
- Figure 14: Europe Wave and Tidal Energy Revenue (million), by Application 2025 & 2033
- Figure 15: Europe Wave and Tidal Energy Revenue Share (%), by Application 2025 & 2033
- Figure 16: Europe Wave and Tidal Energy Revenue (million), by Types 2025 & 2033
- Figure 17: Europe Wave and Tidal Energy Revenue Share (%), by Types 2025 & 2033
- Figure 18: Europe Wave and Tidal Energy Revenue (million), by Country 2025 & 2033
- Figure 19: Europe Wave and Tidal Energy Revenue Share (%), by Country 2025 & 2033
- Figure 20: Middle East & Africa Wave and Tidal Energy Revenue (million), by Application 2025 & 2033
- Figure 21: Middle East & Africa Wave and Tidal Energy Revenue Share (%), by Application 2025 & 2033
- Figure 22: Middle East & Africa Wave and Tidal Energy Revenue (million), by Types 2025 & 2033
- Figure 23: Middle East & Africa Wave and Tidal Energy Revenue Share (%), by Types 2025 & 2033
- Figure 24: Middle East & Africa Wave and Tidal Energy Revenue (million), by Country 2025 & 2033
- Figure 25: Middle East & Africa Wave and Tidal Energy Revenue Share (%), by Country 2025 & 2033
- Figure 26: Asia Pacific Wave and Tidal Energy Revenue (million), by Application 2025 & 2033
- Figure 27: Asia Pacific Wave and Tidal Energy Revenue Share (%), by Application 2025 & 2033
- Figure 28: Asia Pacific Wave and Tidal Energy Revenue (million), by Types 2025 & 2033
- Figure 29: Asia Pacific Wave and Tidal Energy Revenue Share (%), by Types 2025 & 2033
- Figure 30: Asia Pacific Wave and Tidal Energy Revenue (million), by Country 2025 & 2033
- Figure 31: Asia Pacific Wave and Tidal Energy Revenue Share (%), by Country 2025 & 2033
List of Tables
- Table 1: Global Wave and Tidal Energy Revenue million Forecast, by Application 2020 & 2033
- Table 2: Global Wave and Tidal Energy Revenue million Forecast, by Types 2020 & 2033
- Table 3: Global Wave and Tidal Energy Revenue million Forecast, by Region 2020 & 2033
- Table 4: Global Wave and Tidal Energy Revenue million Forecast, by Application 2020 & 2033
- Table 5: Global Wave and Tidal Energy Revenue million Forecast, by Types 2020 & 2033
- Table 6: Global Wave and Tidal Energy Revenue million Forecast, by Country 2020 & 2033
- Table 7: United States Wave and Tidal Energy Revenue (million) Forecast, by Application 2020 & 2033
- Table 8: Canada Wave and Tidal Energy Revenue (million) Forecast, by Application 2020 & 2033
- Table 9: Mexico Wave and Tidal Energy Revenue (million) Forecast, by Application 2020 & 2033
- Table 10: Global Wave and Tidal Energy Revenue million Forecast, by Application 2020 & 2033
- Table 11: Global Wave and Tidal Energy Revenue million Forecast, by Types 2020 & 2033
- Table 12: Global Wave and Tidal Energy Revenue million Forecast, by Country 2020 & 2033
- Table 13: Brazil Wave and Tidal Energy Revenue (million) Forecast, by Application 2020 & 2033
- Table 14: Argentina Wave and Tidal Energy Revenue (million) Forecast, by Application 2020 & 2033
- Table 15: Rest of South America Wave and Tidal Energy Revenue (million) Forecast, by Application 2020 & 2033
- Table 16: Global Wave and Tidal Energy Revenue million Forecast, by Application 2020 & 2033
- Table 17: Global Wave and Tidal Energy Revenue million Forecast, by Types 2020 & 2033
- Table 18: Global Wave and Tidal Energy Revenue million Forecast, by Country 2020 & 2033
- Table 19: United Kingdom Wave and Tidal Energy Revenue (million) Forecast, by Application 2020 & 2033
- Table 20: Germany Wave and Tidal Energy Revenue (million) Forecast, by Application 2020 & 2033
- Table 21: France Wave and Tidal Energy Revenue (million) Forecast, by Application 2020 & 2033
- Table 22: Italy Wave and Tidal Energy Revenue (million) Forecast, by Application 2020 & 2033
- Table 23: Spain Wave and Tidal Energy Revenue (million) Forecast, by Application 2020 & 2033
- Table 24: Russia Wave and Tidal Energy Revenue (million) Forecast, by Application 2020 & 2033
- Table 25: Benelux Wave and Tidal Energy Revenue (million) Forecast, by Application 2020 & 2033
- Table 26: Nordics Wave and Tidal Energy Revenue (million) Forecast, by Application 2020 & 2033
- Table 27: Rest of Europe Wave and Tidal Energy Revenue (million) Forecast, by Application 2020 & 2033
- Table 28: Global Wave and Tidal Energy Revenue million Forecast, by Application 2020 & 2033
- Table 29: Global Wave and Tidal Energy Revenue million Forecast, by Types 2020 & 2033
- Table 30: Global Wave and Tidal Energy Revenue million Forecast, by Country 2020 & 2033
- Table 31: Turkey Wave and Tidal Energy Revenue (million) Forecast, by Application 2020 & 2033
- Table 32: Israel Wave and Tidal Energy Revenue (million) Forecast, by Application 2020 & 2033
- Table 33: GCC Wave and Tidal Energy Revenue (million) Forecast, by Application 2020 & 2033
- Table 34: North Africa Wave and Tidal Energy Revenue (million) Forecast, by Application 2020 & 2033
- Table 35: South Africa Wave and Tidal Energy Revenue (million) Forecast, by Application 2020 & 2033
- Table 36: Rest of Middle East & Africa Wave and Tidal Energy Revenue (million) Forecast, by Application 2020 & 2033
- Table 37: Global Wave and Tidal Energy Revenue million Forecast, by Application 2020 & 2033
- Table 38: Global Wave and Tidal Energy Revenue million Forecast, by Types 2020 & 2033
- Table 39: Global Wave and Tidal Energy Revenue million Forecast, by Country 2020 & 2033
- Table 40: China Wave and Tidal Energy Revenue (million) Forecast, by Application 2020 & 2033
- Table 41: India Wave and Tidal Energy Revenue (million) Forecast, by Application 2020 & 2033
- Table 42: Japan Wave and Tidal Energy Revenue (million) Forecast, by Application 2020 & 2033
- Table 43: South Korea Wave and Tidal Energy Revenue (million) Forecast, by Application 2020 & 2033
- Table 44: ASEAN Wave and Tidal Energy Revenue (million) Forecast, by Application 2020 & 2033
- Table 45: Oceania Wave and Tidal Energy Revenue (million) Forecast, by Application 2020 & 2033
- Table 46: Rest of Asia Pacific Wave and Tidal Energy Revenue (million) Forecast, by Application 2020 & 2033
Frequently Asked Questions
1. What is the projected Compound Annual Growth Rate (CAGR) of the Wave and Tidal Energy?
The projected CAGR is approximately 11.3%.
2. Which companies are prominent players in the Wave and Tidal Energy?
Key companies in the market include Atlantis Resources Corp, AW-Energy, AWS Ocean Energy, Andritz Hydro Hammerfest, BioPower Systems, Kepler Energy Limited, Minesto, Ocean Power Technologies, Pelamis Wave Power Limited, Seabased AB, Trident Energy, Wave Dragon, Wave Star Energy A/S, Wello Oy, Ocean Renewable Power Company, Carnegie Clean Energy Limited, CorPower Ocean AB, Nautricity Limited, Openhydro, Seatricity Limited, ScottishPower Renewables Limited, Tocardo International BV, Voith Hydro, Aquamarine Power Limited, Mako Tidal Turbines, Nova Innovation Limited.
3. What are the main segments of the Wave and Tidal Energy?
The market segments include Application, Types.
4. Can you provide details about the market size?
The market size is estimated to be USD 139 million as of 2022.
5. What are some drivers contributing to market growth?
N/A
6. What are the notable trends driving market growth?
N/A
7. Are there any restraints impacting market growth?
N/A
8. Can you provide examples of recent developments in the market?
N/A
9. What pricing options are available for accessing the report?
Pricing options include single-user, multi-user, and enterprise licenses priced at USD 5600.00, USD 8400.00, and USD 11200.00 respectively.
10. Is the market size provided in terms of value or volume?
The market size is provided in terms of value, measured in million.
11. Are there any specific market keywords associated with the report?
Yes, the market keyword associated with the report is "Wave and Tidal Energy," which aids in identifying and referencing the specific market segment covered.
12. How do I determine which pricing option suits my needs best?
The pricing options vary based on user requirements and access needs. Individual users may opt for single-user licenses, while businesses requiring broader access may choose multi-user or enterprise licenses for cost-effective access to the report.
13. Are there any additional resources or data provided in the Wave and Tidal Energy report?
While the report offers comprehensive insights, it's advisable to review the specific contents or supplementary materials provided to ascertain if additional resources or data are available.
14. How can I stay updated on further developments or reports in the Wave and Tidal Energy?
To stay informed about further developments, trends, and reports in the Wave and Tidal Energy, consider subscribing to industry newsletters, following relevant companies and organizations, or regularly checking reputable industry news sources and publications.
Methodology
Step 1 - Identification of Relevant Samples Size from Population Database


Step 2 - Approaches for Defining Global Market Size (Value, Volume* & Price*)

Note*: In applicable scenarios
Step 3 - Data Sources
Primary Research
- Web Analytics
- Survey Reports
- Research Institute
- Latest Research Reports
- Opinion Leaders
Secondary Research
- Annual Reports
- White Paper
- Latest Press Release
- Industry Association
- Paid Database
- Investor Presentations

Step 4 - Data Triangulation
Involves using different sources of information in order to increase the validity of a study
These sources are likely to be stakeholders in a program - participants, other researchers, program staff, other community members, and so on.
Then we put all data in single framework & apply various statistical tools to find out the dynamic on the market.
During the analysis stage, feedback from the stakeholder groups would be compared to determine areas of agreement as well as areas of divergence

