

Key Insights
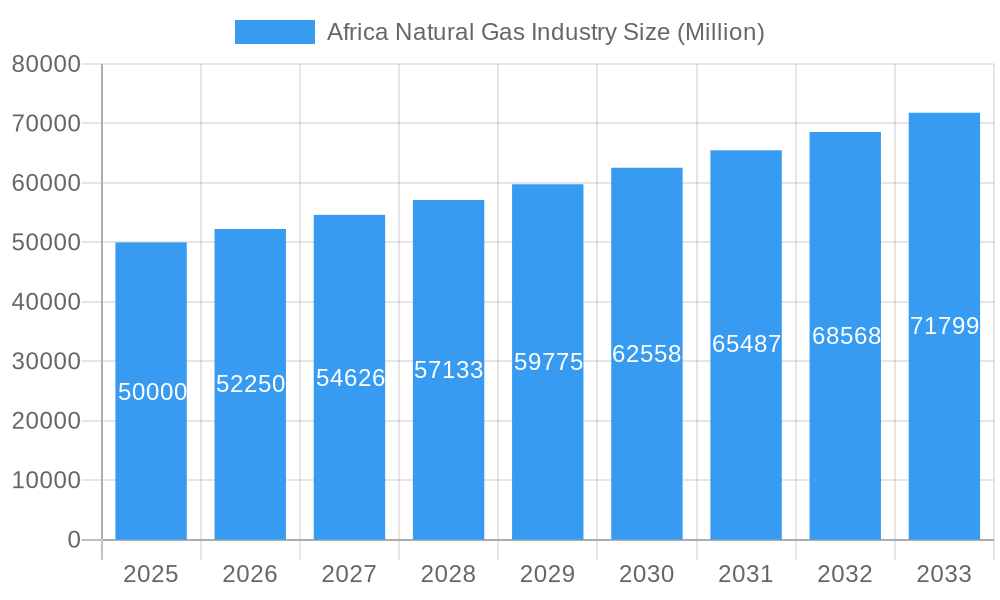
The African natural gas industry is poised for significant growth, exhibiting a Compound Annual Growth Rate (CAGR) exceeding 4.50% from 2025 to 2033. Driven by increasing energy demands across diverse sectors – power generation, industrial processes, and residential consumption – the market is experiencing a substantial expansion. South Africa, Sudan, Uganda, Tanzania, and Kenya are key regional contributors, representing a substantial portion of the overall market value. The industry's growth is fueled by several factors, including expanding infrastructure, government initiatives promoting energy diversification, and the rising adoption of natural gas as a cleaner alternative to traditional fuels. However, challenges persist, including inconsistent regulatory frameworks across different African nations, security concerns in certain regions, and the need for continuous investment in infrastructure development to support the projected growth. Furthermore, competition from renewable energy sources and fluctuating global natural gas prices present ongoing hurdles. The market segmentation reveals that large companies are currently dominating the sector, while small and medium-sized enterprises (SMEs) are anticipated to experience accelerated growth in the coming years, spurred by government support programs and opportunities within the expanding market.
Africa Natural Gas Industry Market Size (In Billion)
The diverse end-user segments within the African natural gas market contribute to its dynamic nature. The power generation sector represents a dominant portion of demand, followed by industrial applications and, increasingly, the residential sector as access to natural gas expands. Major players, including international energy giants such as Shell PLC, TotalEnergies SE, and Chevron Corporation, alongside national oil companies like Sonatrach and Nigerian National Petroleum Corporation, are actively shaping the market landscape through exploration, production, and infrastructure development. Their activities are crucial to driving economic growth and energy security across the continent. The strategic partnerships between these multinational corporations and local entities are key to ensuring sustainable and equitable development of Africa’s natural gas resources. Looking ahead, focused investments in infrastructure, technological advancements in gas exploration and processing, and supportive government policies are critical to fully realize the substantial potential of the African natural gas industry.
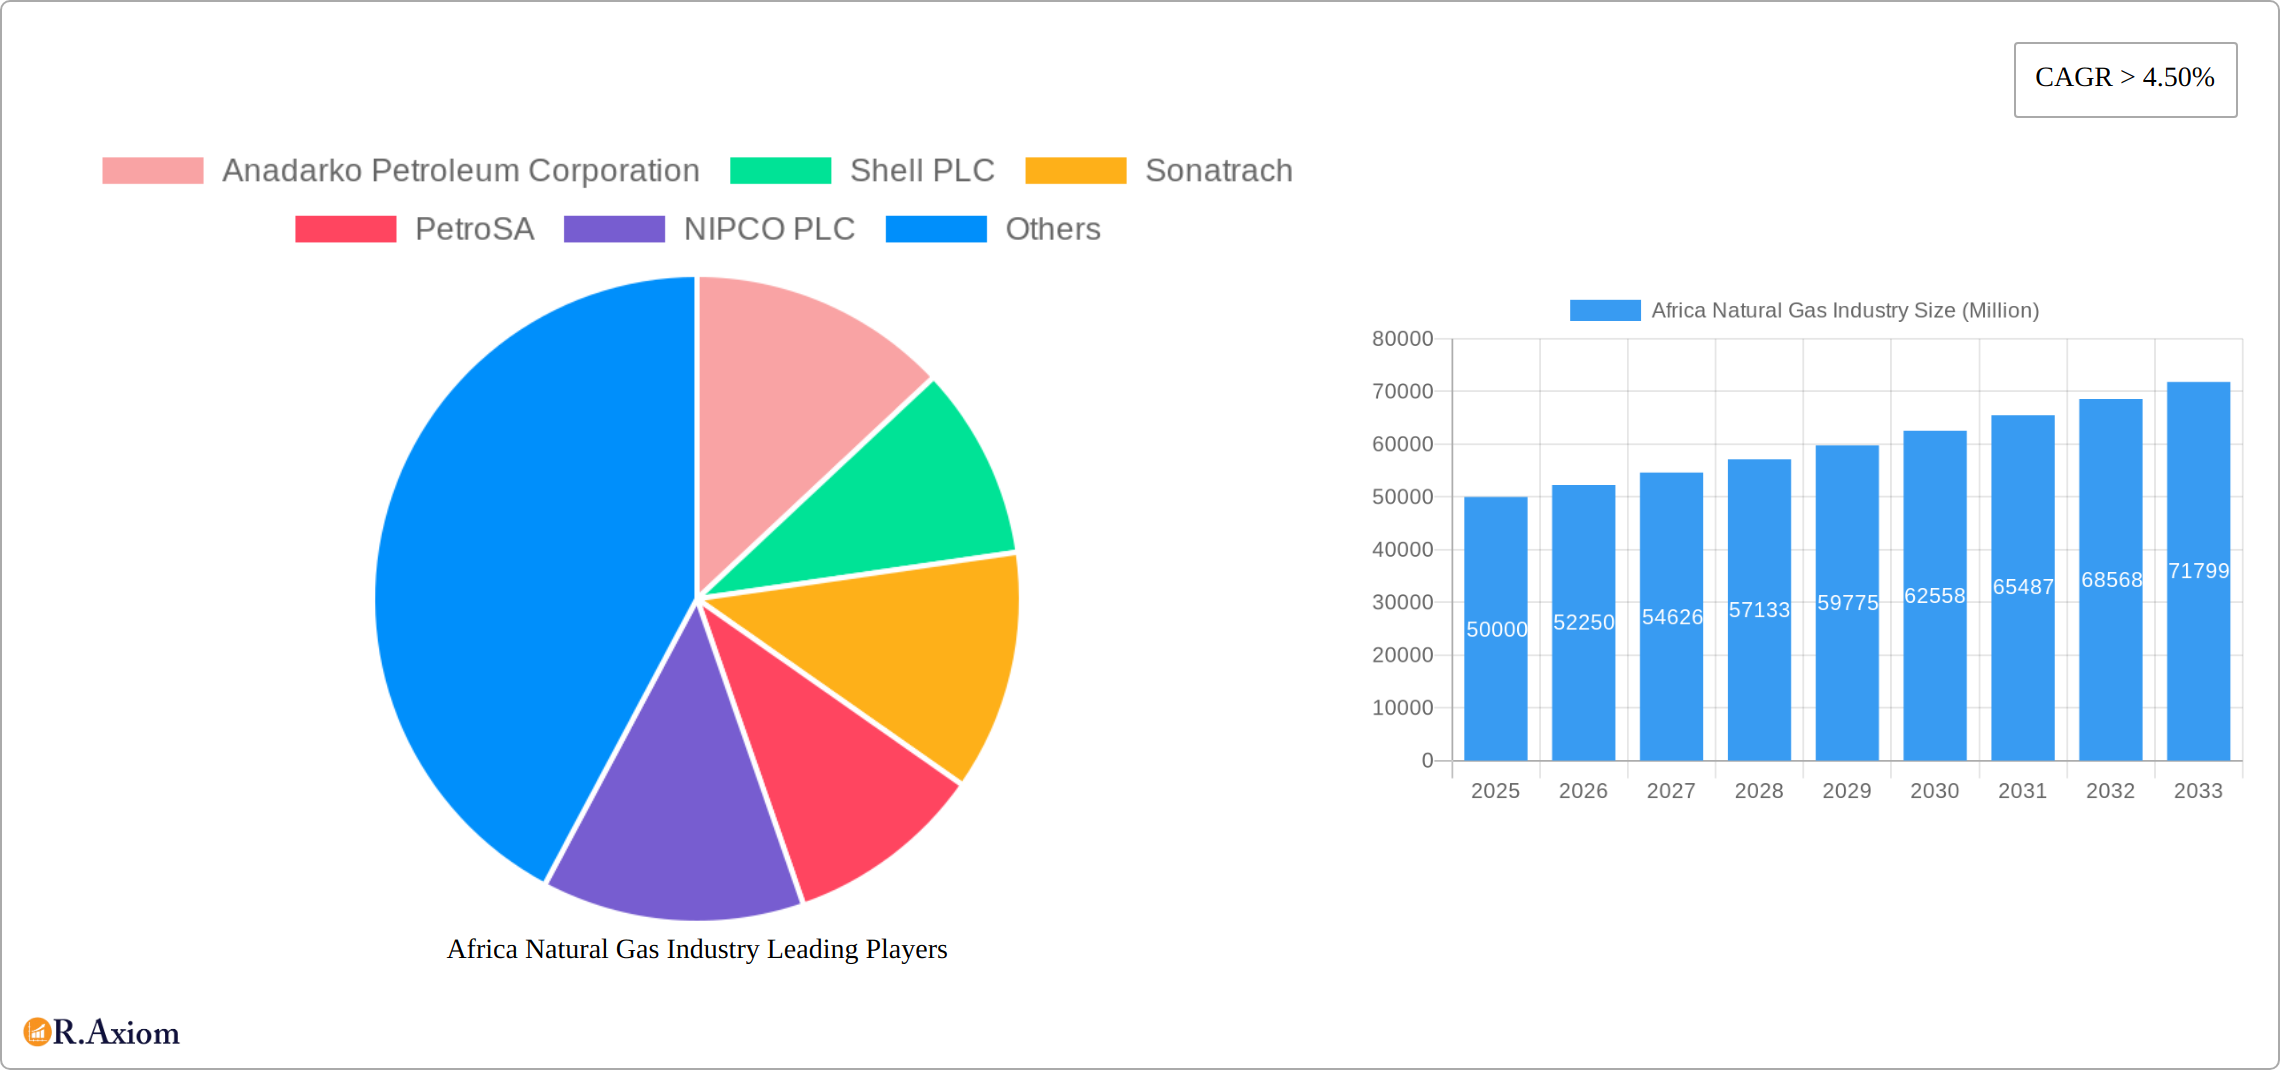
Africa Natural Gas Industry Company Market Share
Africa Natural Gas Industry: A Comprehensive Market Report (2019-2033)
This comprehensive report provides an in-depth analysis of the Africa Natural Gas Industry, covering market size, growth projections, key players, and future opportunities. With a study period spanning 2019-2033, a base year of 2025, and a forecast period of 2025-2033, this report offers actionable insights for industry stakeholders, investors, and policymakers. The report uses Million as the unit for all values.
Africa Natural Gas Industry Market Concentration & Innovation
This section analyzes the competitive landscape of the African natural gas market, examining market concentration, innovation drivers, regulatory frameworks, and M&A activities. The analysis incorporates data from the historical period (2019-2024) and projects trends into the future.
Market Concentration: The African natural gas market exhibits a moderately concentrated structure, with a few large multinational corporations holding significant market share. For example, Shell PLC, TotalEnergies SE, and Eni SpA represent major players, though the precise market share for each company in 2025 is estimated at xx%. Smaller, national companies like Sonatrach and the Nigerian National Petroleum Corporation also command substantial regional influence. The exact market share distribution will be further detailed in the full report.
Innovation Drivers: Innovation in the African natural gas sector is driven by the need for enhanced efficiency, reduced emissions, and improved infrastructure. This includes the adoption of advanced exploration and extraction technologies, the development of Liquefied Natural Gas (LNG) infrastructure, and the exploration of new gas reserves. Increased investments in R&D are also expected to further spur innovation.
Regulatory Frameworks & Product Substitutes: Regulatory frameworks vary across African nations, influencing investment decisions and market access. The presence of renewable energy sources, such as solar and wind power, presents a competitive pressure (substitutes) to natural gas in the power generation sector. The report will provide a comprehensive analysis of the regulatory environments and competitive pressures across different regions.
End-User Trends & M&A Activities: The increasing demand for electricity in rapidly growing African economies fuels demand for natural gas in power generation. Industrial applications of natural gas are also expanding. M&A activity in the sector is characterized by strategic partnerships and acquisitions aimed at consolidating assets and expanding market reach. The report will include an analysis of xx Million worth of M&A deals during the historical period, with projections for the forecast period.
Africa Natural Gas Industry Industry Trends & Insights
This section delves into the key trends shaping the African natural gas market. The compound annual growth rate (CAGR) for the forecast period (2025-2033) is projected at xx%, driven by factors described below.
The market growth is being fueled by rising energy demand, particularly in power generation and industrial sectors, across various African nations. Technological advancements, such as improved drilling techniques and pipeline infrastructure, contribute significantly. Furthermore, government initiatives to promote gas exploration and development play a crucial role. Shifting consumer preferences towards cleaner energy sources, however, pose some challenges for the natural gas industry. The competitive landscape is intensifying, with existing players facing competition from renewable energy sources and the emergence of new players. Market penetration of natural gas in the residential sector remains comparatively low, presenting a significant opportunity for growth. The report will provide a detailed assessment of market growth across different regions, analyzing market penetration rates and competitive intensity.
Dominant Markets & Segments in Africa Natural Gas Industry
This section identifies the leading regions, countries, and segments within the African natural gas industry.
Leading Regions:
- North Africa: Dominates due to established infrastructure, significant reserves, and export capacity (e.g., Algeria). Key drivers include existing infrastructure, supportive government policies, and strategic location for European gas imports.
- West Africa: Experiencing rapid growth, driven by substantial gas discoveries and expanding energy demand (e.g., Nigeria, Ghana). Development of new infrastructure remains a key driver, including significant ongoing projects like the Nigeria-Morocco gas pipeline.
Leading Countries:
- Algeria: A major exporter, with substantial reserves and established infrastructure.
- Nigeria: Possesses vast reserves, but infrastructure development is crucial for realizing full potential.
Leading End-User Segments:
- Power Generation: This segment holds the largest share, fueled by increasing electricity demand across Africa.
- Industrial: Industrial applications of natural gas are expanding steadily.
- Residential: This segment remains relatively small but presents significant growth potential.
Leading Company Sizes:
- Large: Multinational companies dominate this segment, possessing extensive resources and market expertise.
- Medium and Small: These companies play important roles in supporting infrastructure development and local gas supply.
Africa Natural Gas Industry Product Developments
Recent innovations in the African natural gas industry are significantly focused on improving efficiency and minimizing environmental impact. These advancements encompass the development of cutting-edge LNG technologies to optimize transportation and storage, as well as cleaner burning technologies aimed at drastically reducing methane emissions. These efforts are strongly aligned with the global shift towards sustainable energy solutions. The market viability of these new products hinges on their cost-competitiveness and their ability to effectively address the unique needs and infrastructure limitations prevalent in diverse African markets. This includes exploring solutions for smaller-scale applications and off-grid solutions to improve access to energy in underserved communities.
Report Scope & Segmentation Analysis
This comprehensive report provides a detailed segmentation of the African natural gas market across various key parameters. Geographical segmentation includes North Africa, West Africa, Central Africa, East Africa, and Southern Africa. End-user segmentation covers power generation, industrial applications, and residential consumption. Furthermore, the market is analyzed based on company size, categorized as large, medium, and small enterprises. The report meticulously assesses each segment's market size, growth trajectory, and competitive landscape. It offers precise projections for each segment's size in 2025, along with the projected Compound Annual Growth Rate (CAGR) for the forecast period. The competitive landscape analysis for each segment identifies key players and their respective market positions, providing valuable insights into market share and competitive strategies.
Key Drivers of Africa Natural Gas Industry Growth
The robust growth of the African natural gas industry is propelled by several significant factors. The burgeoning demand for energy, particularly electricity, in rapidly developing economies significantly fuels the demand for natural gas in power generation. Substantial investments in infrastructure development are enhancing access to gas resources and supporting expansion. Supportive government policies designed to bolster energy security and attract foreign investment play a vital role in fostering industry growth. Finally, continuous technological advancements in exploration and extraction techniques are contributing to improved efficiency and reduced costs, unlocking previously inaccessible reserves.
Challenges in the Africa Natural Gas Industry Sector
Despite its growth potential, the African natural gas industry grapples with several significant challenges. The development of robust and efficient infrastructure for transportation and distribution remains a critical hurdle, particularly in remote areas. Regulatory inconsistencies across different African nations create uncertainty for investors and hinder cross-border projects. Supply chain disruptions can significantly impact the reliability of gas supply. Furthermore, increasing competition from renewable energy sources, while beneficial for the environment, exerts pressure on the sector's growth trajectory. Addressing these challenges requires substantial investment in infrastructure, harmonization of regulatory frameworks, and diversification strategies to ensure the sustainable and responsible development of the African natural gas sector.
Emerging Opportunities in Africa Natural Gas Industry
Several opportunities exist for growth. The development of new gas reserves offers significant potential. Furthermore, there are opportunities for expanding the use of natural gas in industrial processes and for the development of gas-based petrochemical industries. Technological innovations can also improve efficiency and reduce emissions. The potential for regional gas trade and the increasing demand for LNG exports to global markets represent further avenues for expansion.
Leading Players in the Africa Natural Gas Industry Market
- Anadarko Petroleum Corporation
- Shell PLC
- Sonatrach
- PetroSA
- NIPCO PLC
- TotalEnergies SE
- Egyptian Natural Gas Holding Company
- Eni SpA
- Nigerian National Petroleum Corporation
- Chevron Corporation
Key Developments in Africa Natural Gas Industry Industry
- September 2022: The Nigerian National Petroleum Company Limited (NNPCL) announced an MoU for a 7,000-kilometer Nigeria-Morocco gas pipeline project, potentially supplying 3 billion standard cubic feet of gas to Europe annually. This significantly impacts West African gas supply and export capacity.
- May 2022: Sonatrach and Eni signed an MoU to accelerate the development of Algerian gas fields, aiming for an additional 3 billion cubic meters of annual gas exports via the Transmed pipeline. This boosts Algeria's export capabilities.
Strategic Outlook for Africa Natural Gas Industry Market
The future of the African natural gas industry is promising, driven by increasing energy demand, ongoing infrastructure development, and significant investment. The development of new gas reserves and the expansion of LNG infrastructure will fuel market growth. Strategic partnerships and technological innovation will play crucial roles in shaping the future competitive landscape. Successful navigation of the challenges will be vital to fully realize the immense potential of the African natural gas market.
Africa Natural Gas Industry Segmentation
-
1. Geography
- 1.1. Nigeria
- 1.2. Algeria
- 1.3. Egypt
- 1.4. South Africa
- 1.5. Rest of Africa
Africa Natural Gas Industry Segmentation By Geography
- 1. Nigeria
- 2. Algeria
- 3. Egypt
- 4. South Africa
- 5. Rest of Africa
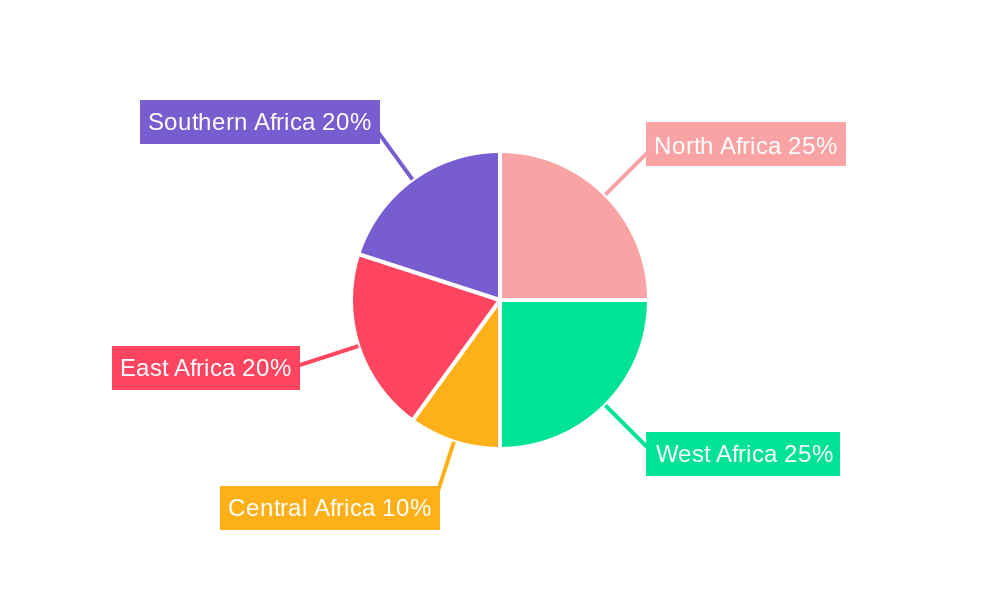
Africa Natural Gas Industry Regional Market Share
Geographic Coverage of Africa Natural Gas Industry
Africa Natural Gas Industry REPORT HIGHLIGHTS
| Aspects | Details |
|---|---|
| Study Period | 2020-2034 |
| Base Year | 2025 |
| Estimated Year | 2026 |
| Forecast Period | 2026-2034 |
| Historical Period | 2020-2025 |
| Growth Rate | CAGR of > 4.50% from 2020-2034 |
| Segmentation |
|
Table of Contents
- 1. Introduction
- 1.1. Research Scope
- 1.2. Market Segmentation
- 1.3. Research Objective
- 1.4. Definitions and Assumptions
- 2. Executive Summary
- 2.1. Market Snapshot
- 3. Market Dynamics
- 3.1. Market Drivers
- 3.2. Market Restrains
- 3.3. Market Trends
- 3.4. Market Opportunities
- 4. Market Factor Analysis
- 4.1. Porters Five Forces
- 4.1.1. Bargaining Power of Suppliers
- 4.1.2. Bargaining Power of Buyers
- 4.1.3. Threat of New Entrants
- 4.1.4. Threat of Substitutes
- 4.1.5. Competitive Rivalry
- 4.2. PESTEL analysis
- 4.3. BCG Analysis
- 4.3.1. Stars (High Growth, High Market Share)
- 4.3.2. Cash Cows (Low Growth, High Market Share)
- 4.3.3. Question Mark (High Growth, Low Market Share)
- 4.3.4. Dogs (Low Growth, Low Market Share)
- 4.4. Ansoff Matrix Analysis
- 4.5. Supply Chain Analysis
- 4.6. Regulatory Landscape
- 4.7. Current Market Potential and Opportunity Assessment (TAM–SAM–SOM Framework)
- 4.8. RAX Analyst Note
- 4.1. Porters Five Forces
- 5. Market Analysis, Insights and Forecast 2021-2033
- 5.1. Market Analysis, Insights and Forecast - by Geography
- 5.1.1. Nigeria
- 5.1.2. Algeria
- 5.1.3. Egypt
- 5.1.4. South Africa
- 5.1.5. Rest of Africa
- 5.2. Market Analysis, Insights and Forecast - by Region
- 5.2.1. Nigeria
- 5.2.2. Algeria
- 5.2.3. Egypt
- 5.2.4. South Africa
- 5.2.5. Rest of Africa
- 5.1. Market Analysis, Insights and Forecast - by Geography
- 6. Africa Natural Gas Industry Analysis, Insights and Forecast, 2021-2033
- 6.1. Market Analysis, Insights and Forecast - by Geography
- 6.1.1. Nigeria
- 6.1.2. Algeria
- 6.1.3. Egypt
- 6.1.4. South Africa
- 6.1.5. Rest of Africa
- 6.1. Market Analysis, Insights and Forecast - by Geography
- 7. Nigeria Africa Natural Gas Industry Analysis, Insights and Forecast, 2020-2032
- 7.1. Market Analysis, Insights and Forecast - by Geography
- 7.1.1. Nigeria
- 7.1.2. Algeria
- 7.1.3. Egypt
- 7.1.4. South Africa
- 7.1.5. Rest of Africa
- 7.1. Market Analysis, Insights and Forecast - by Geography
- 8. Algeria Africa Natural Gas Industry Analysis, Insights and Forecast, 2020-2032
- 8.1. Market Analysis, Insights and Forecast - by Geography
- 8.1.1. Nigeria
- 8.1.2. Algeria
- 8.1.3. Egypt
- 8.1.4. South Africa
- 8.1.5. Rest of Africa
- 8.1. Market Analysis, Insights and Forecast - by Geography
- 9. Egypt Africa Natural Gas Industry Analysis, Insights and Forecast, 2020-2032
- 9.1. Market Analysis, Insights and Forecast - by Geography
- 9.1.1. Nigeria
- 9.1.2. Algeria
- 9.1.3. Egypt
- 9.1.4. South Africa
- 9.1.5. Rest of Africa
- 9.1. Market Analysis, Insights and Forecast - by Geography
- 10. South Africa Africa Natural Gas Industry Analysis, Insights and Forecast, 2020-2032
- 10.1. Market Analysis, Insights and Forecast - by Geography
- 10.1.1. Nigeria
- 10.1.2. Algeria
- 10.1.3. Egypt
- 10.1.4. South Africa
- 10.1.5. Rest of Africa
- 10.1. Market Analysis, Insights and Forecast - by Geography
- 11. Rest of Africa Africa Natural Gas Industry Analysis, Insights and Forecast, 2020-2032
- 11.1. Market Analysis, Insights and Forecast - by Geography
- 11.1.1. Nigeria
- 11.1.2. Algeria
- 11.1.3. Egypt
- 11.1.4. South Africa
- 11.1.5. Rest of Africa
- 11.1. Market Analysis, Insights and Forecast - by Geography
- 12. Competitive Analysis
- 12.1. Company Profiles
- 12.1.1 Anadarko Petroleum Corporation
- 12.1.1.1. Company Overview
- 12.1.1.2. Products
- 12.1.1.3. Company Financials
- 12.1.1.4. SWOT Analysis
- 12.1.2 Shell PLC
- 12.1.2.1. Company Overview
- 12.1.2.2. Products
- 12.1.2.3. Company Financials
- 12.1.2.4. SWOT Analysis
- 12.1.3 Sonatrach
- 12.1.3.1. Company Overview
- 12.1.3.2. Products
- 12.1.3.3. Company Financials
- 12.1.3.4. SWOT Analysis
- 12.1.4 PetroSA
- 12.1.4.1. Company Overview
- 12.1.4.2. Products
- 12.1.4.3. Company Financials
- 12.1.4.4. SWOT Analysis
- 12.1.5 NIPCO PLC
- 12.1.5.1. Company Overview
- 12.1.5.2. Products
- 12.1.5.3. Company Financials
- 12.1.5.4. SWOT Analysis
- 12.1.6 TotalEnergies SE
- 12.1.6.1. Company Overview
- 12.1.6.2. Products
- 12.1.6.3. Company Financials
- 12.1.6.4. SWOT Analysis
- 12.1.7 Egyptian Natural Gas Holding Company
- 12.1.7.1. Company Overview
- 12.1.7.2. Products
- 12.1.7.3. Company Financials
- 12.1.7.4. SWOT Analysis
- 12.1.8 Eni SpA
- 12.1.8.1. Company Overview
- 12.1.8.2. Products
- 12.1.8.3. Company Financials
- 12.1.8.4. SWOT Analysis
- 12.1.9 Nigerian National Petroleum Corporation
- 12.1.9.1. Company Overview
- 12.1.9.2. Products
- 12.1.9.3. Company Financials
- 12.1.9.4. SWOT Analysis
- 12.1.10 Chevron Corporation
- 12.1.10.1. Company Overview
- 12.1.10.2. Products
- 12.1.10.3. Company Financials
- 12.1.10.4. SWOT Analysis
- 12.1.1 Anadarko Petroleum Corporation
- 12.2. Market Entropy
- 12.2.1 Company's Key Areas Served
- 12.2.2 Recent Developments
- 12.3. Company Market Share Analysis 2025
- 12.3.1 Top 5 Companies Market Share Analysis
- 12.3.2 Top 3 Companies Market Share Analysis
- 12.4. List of Potential Customers
- 13. Research Methodology
List of Figures
- Figure 1: Africa Natural Gas Industry Revenue Breakdown (Million, %) by Product 2025 & 2033
- Figure 2: Africa Natural Gas Industry Share (%) by Company 2025
List of Tables
- Table 1: Africa Natural Gas Industry Revenue Million Forecast, by Geography 2020 & 2033
- Table 2: Africa Natural Gas Industry Volume Tonnes Forecast, by Geography 2020 & 2033
- Table 3: Africa Natural Gas Industry Revenue Million Forecast, by Region 2020 & 2033
- Table 4: Africa Natural Gas Industry Volume Tonnes Forecast, by Region 2020 & 2033
- Table 5: Africa Natural Gas Industry Revenue Million Forecast, by Geography 2020 & 2033
- Table 6: Africa Natural Gas Industry Volume Tonnes Forecast, by Geography 2020 & 2033
- Table 7: Africa Natural Gas Industry Revenue Million Forecast, by Country 2020 & 2033
- Table 8: Africa Natural Gas Industry Volume Tonnes Forecast, by Country 2020 & 2033
- Table 9: Africa Natural Gas Industry Revenue Million Forecast, by Geography 2020 & 2033
- Table 10: Africa Natural Gas Industry Volume Tonnes Forecast, by Geography 2020 & 2033
- Table 11: Africa Natural Gas Industry Revenue Million Forecast, by Country 2020 & 2033
- Table 12: Africa Natural Gas Industry Volume Tonnes Forecast, by Country 2020 & 2033
- Table 13: Africa Natural Gas Industry Revenue Million Forecast, by Geography 2020 & 2033
- Table 14: Africa Natural Gas Industry Volume Tonnes Forecast, by Geography 2020 & 2033
- Table 15: Africa Natural Gas Industry Revenue Million Forecast, by Country 2020 & 2033
- Table 16: Africa Natural Gas Industry Volume Tonnes Forecast, by Country 2020 & 2033
- Table 17: Africa Natural Gas Industry Revenue Million Forecast, by Geography 2020 & 2033
- Table 18: Africa Natural Gas Industry Volume Tonnes Forecast, by Geography 2020 & 2033
- Table 19: Africa Natural Gas Industry Revenue Million Forecast, by Country 2020 & 2033
- Table 20: Africa Natural Gas Industry Volume Tonnes Forecast, by Country 2020 & 2033
- Table 21: Africa Natural Gas Industry Revenue Million Forecast, by Geography 2020 & 2033
- Table 22: Africa Natural Gas Industry Volume Tonnes Forecast, by Geography 2020 & 2033
- Table 23: Africa Natural Gas Industry Revenue Million Forecast, by Country 2020 & 2033
- Table 24: Africa Natural Gas Industry Volume Tonnes Forecast, by Country 2020 & 2033
Frequently Asked Questions
1. What is the projected Compound Annual Growth Rate (CAGR) of the Africa Natural Gas Industry?
The projected CAGR is approximately > 4.50%.
2. Which companies are prominent players in the Africa Natural Gas Industry?
Key companies in the market include Anadarko Petroleum Corporation, Shell PLC, Sonatrach, PetroSA, NIPCO PLC, TotalEnergies SE, Egyptian Natural Gas Holding Company, Eni SpA, Nigerian National Petroleum Corporation, Chevron Corporation.
3. What are the main segments of the Africa Natural Gas Industry?
The market segments include Geography.
4. Can you provide details about the market size?
The market size is estimated to be USD XX Million as of 2022.
5. What are some drivers contributing to market growth?
4.; Increasing Amount of Waste Generation. Growing Concern for Waste Management to Meet the Needs for Sustainable Urban Living4.; Increasing Focus on Non-fossil Fuel Sources of Energy.
6. What are the notable trends driving market growth?
Governments Moving Towards the Cleaner Energy Sources is Driving the Market.
7. Are there any restraints impacting market growth?
4.; Expensive Nature of Incinerators.
8. Can you provide examples of recent developments in the market?
In September 2022, The Nigerian National Petroleum Company Limited (NNPCL) announced its intention to sign a Memorandum of Understanding (MoU) on developing a gas pipeline with Morocco's National Office of Hydrocarbons and Mines and the commission of the Economic Community of West African States (ECOWAS). As a result of the MoU, the 7,000-kilometre Nigeria-Morocco gas pipeline project is expected to ramp up gas supply to Europe. Upon the project completion, 3 billion standard cubic feet of gas is expected to be supplied along the coast of West Africa from Nigeria, Benin, Togo, Ghana, Cote d'Ivoire, Liberia, Sierra Leone, Guinea, Guinea Bissau, Gambia, Senegal, Mauritania to Morocco.
9. What pricing options are available for accessing the report?
Pricing options include single-user, multi-user, and enterprise licenses priced at USD 4750, USD 5250, and USD 8750 respectively.
10. Is the market size provided in terms of value or volume?
The market size is provided in terms of value, measured in Million and volume, measured in Tonnes.
11. Are there any specific market keywords associated with the report?
Yes, the market keyword associated with the report is "Africa Natural Gas Industry," which aids in identifying and referencing the specific market segment covered.
12. How do I determine which pricing option suits my needs best?
The pricing options vary based on user requirements and access needs. Individual users may opt for single-user licenses, while businesses requiring broader access may choose multi-user or enterprise licenses for cost-effective access to the report.
13. Are there any additional resources or data provided in the Africa Natural Gas Industry report?
While the report offers comprehensive insights, it's advisable to review the specific contents or supplementary materials provided to ascertain if additional resources or data are available.
14. How can I stay updated on further developments or reports in the Africa Natural Gas Industry?
To stay informed about further developments, trends, and reports in the Africa Natural Gas Industry, consider subscribing to industry newsletters, following relevant companies and organizations, or regularly checking reputable industry news sources and publications.
Methodology
Step 1 - Identification of Relevant Samples Size from Population Database


Step 2 - Approaches for Defining Global Market Size (Value, Volume* & Price*)

Note*: In applicable scenarios
Step 3 - Data Sources
Primary Research
- Web Analytics
- Survey Reports
- Research Institute
- Latest Research Reports
- Opinion Leaders
Secondary Research
- Annual Reports
- White Paper
- Latest Press Release
- Industry Association
- Paid Database
- Investor Presentations

Step 4 - Data Triangulation
Involves using different sources of information in order to increase the validity of a study
These sources are likely to be stakeholders in a program - participants, other researchers, program staff, other community members, and so on.
Then we put all data in single framework & apply various statistical tools to find out the dynamic on the market.
During the analysis stage, feedback from the stakeholder groups would be compared to determine areas of agreement as well as areas of divergence