
Key Insights
The ASEAN Power EPC (Engineering, Procurement, and Construction) market is experiencing robust growth, driven by increasing energy demand fueled by rapid economic development and urbanization across the region. A significant factor contributing to this expansion is the substantial investment in renewable energy sources, particularly solar and wind power, aligned with regional sustainability goals. Government initiatives promoting energy diversification and infrastructure development further bolster market expansion. While traditional thermal power plants still constitute a considerable segment, the shift towards renewables is evident, with a projected increasing share of the market over the forecast period (2025-2033). This transition is facilitated by falling renewable energy technology costs and supportive regulatory frameworks. However, challenges such as grid infrastructure limitations in certain areas and potential supply chain disruptions could moderately restrain growth. The major players in the ASEAN Power EPC market are a mix of international conglomerates and regional companies, competing on factors including technological expertise, project execution capabilities, and cost-effectiveness. Competition is expected to intensify as more companies enter the market seeking to capitalize on the opportunities presented by the region's energy transition. The market segmentation reveals a dynamic interplay between established thermal power and rapidly growing renewable energy sectors, with nuclear power holding a smaller, but steadily growing share, particularly in countries with advanced nuclear technologies.
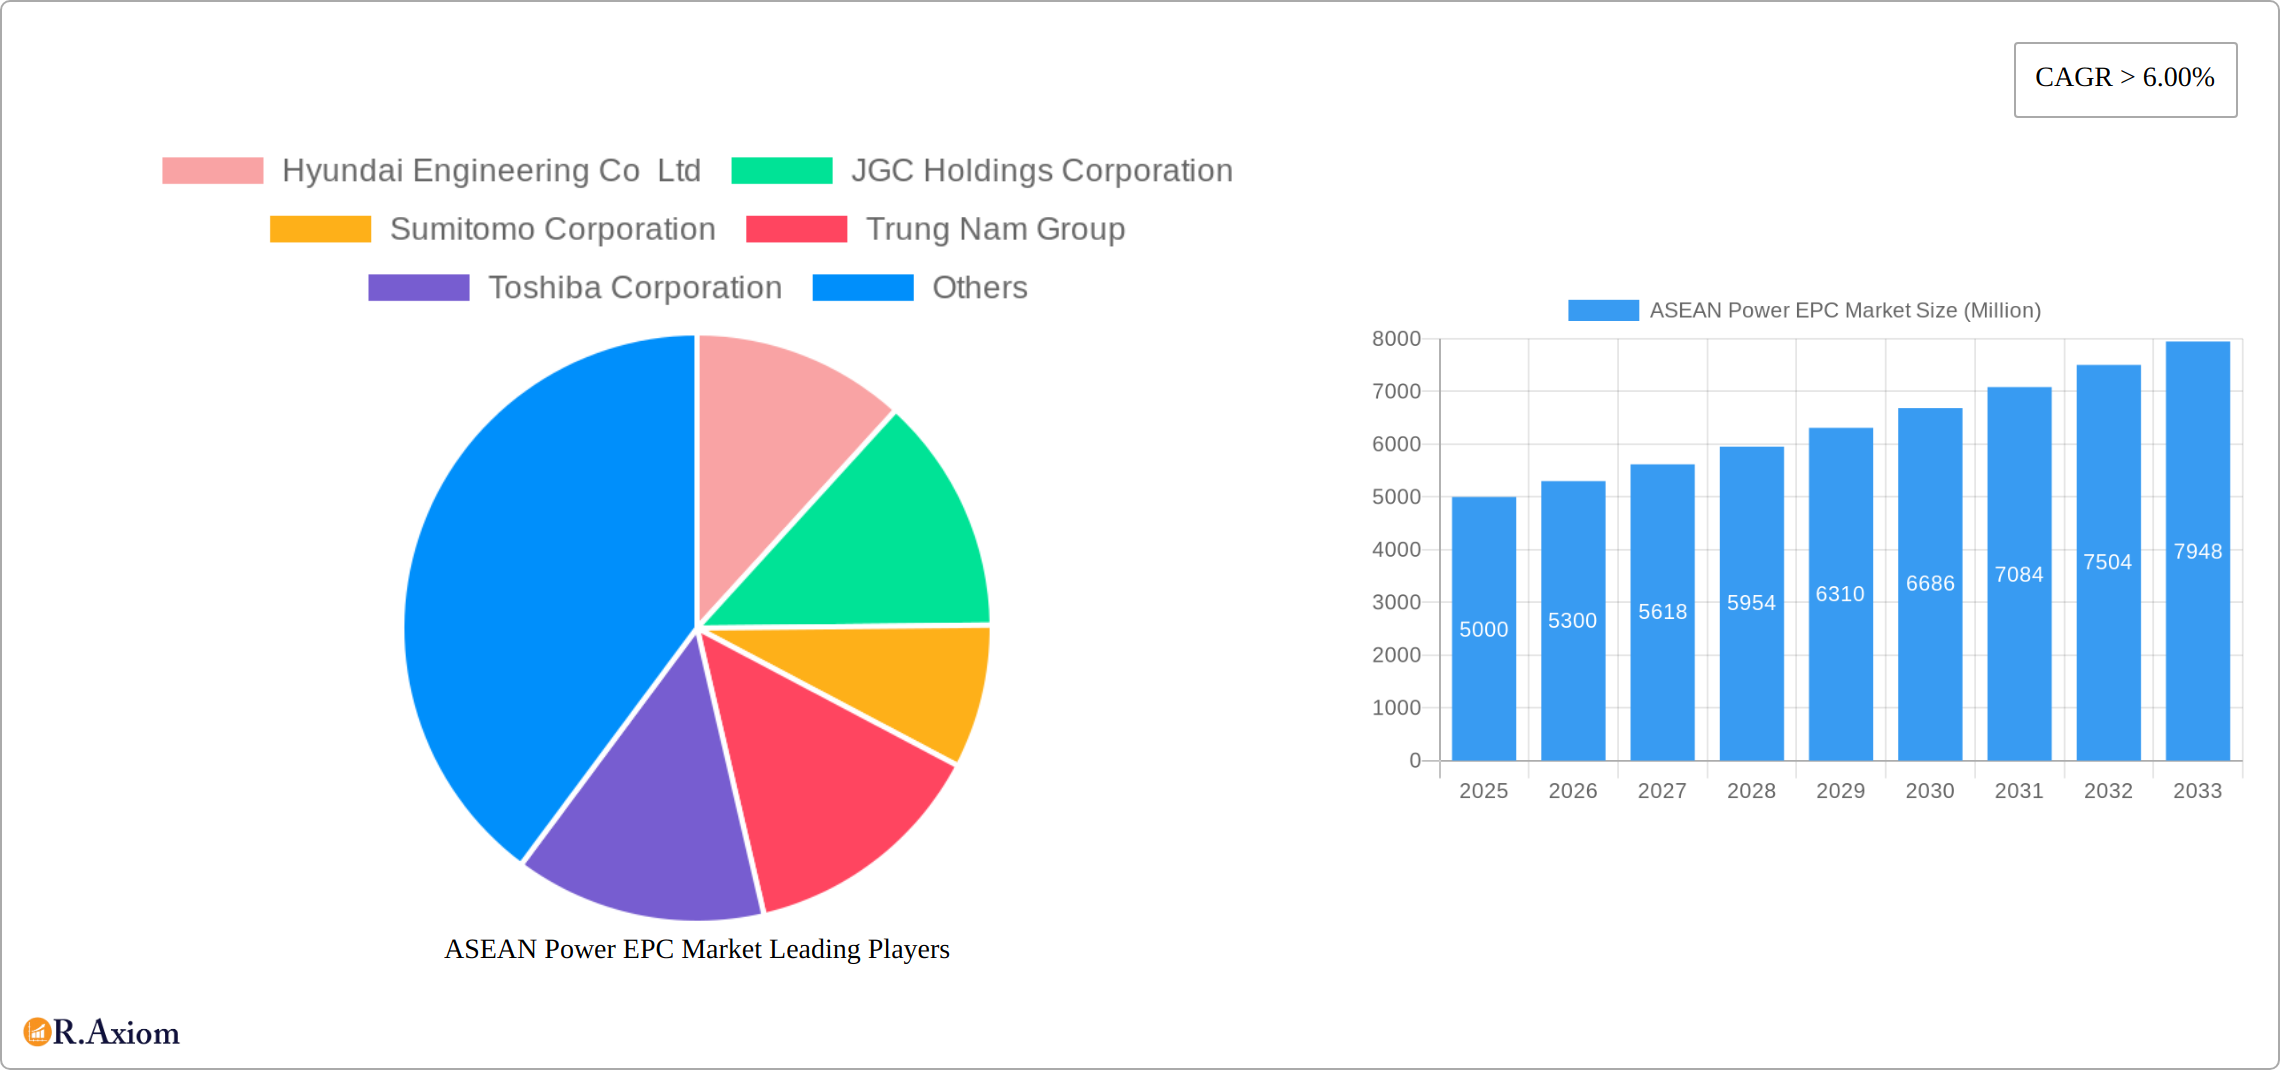
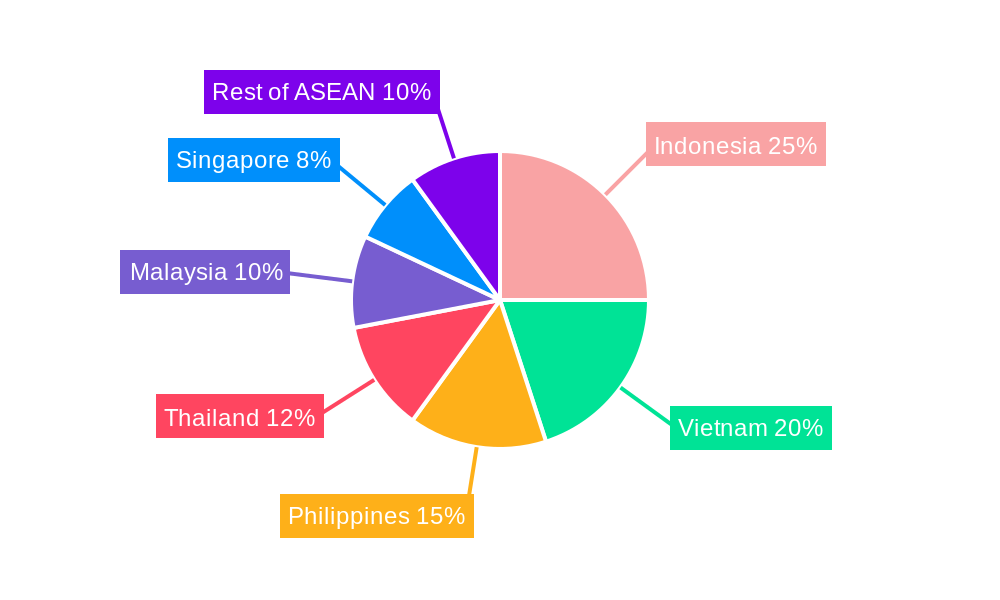
The competitive landscape is characterized by a blend of global EPC giants and regional players. Companies like Hyundai Engineering, JGC Holdings, and Sumitomo Corporation bring extensive experience and financial strength, while local firms possess valuable market knowledge and established relationships. This dynamic competition fosters innovation and drives efficiency improvements within the ASEAN Power EPC sector. The regional breakdown highlights significant growth potential in countries like Indonesia, Vietnam, and the Philippines, given their expanding economies and rising energy demands. However, differences in regulatory environments and infrastructure development across the ASEAN region create unique opportunities and challenges for EPC contractors, requiring tailored strategies for market penetration and project execution. The robust growth outlook and significant investment in power infrastructure position the ASEAN Power EPC market as an attractive destination for both established and emerging players in the global energy sector.
ASEAN Power EPC Market: A Comprehensive Report (2019-2033)
This in-depth report provides a comprehensive analysis of the ASEAN Power Engineering, Procurement, and Construction (EPC) market from 2019 to 2033. It offers invaluable insights into market dynamics, key players, growth drivers, and emerging opportunities, empowering stakeholders to make informed strategic decisions. The report leverages extensive data analysis and expert insights to present a clear picture of this dynamic market. With a focus on key segments – Conventional Thermal Power, Renewables Power, and Nuclear Power – this report is essential for businesses operating within or seeking entry into the ASEAN power sector.
ASEAN Power EPC Market Concentration & Innovation
The ASEAN Power EPC market exhibits a moderately concentrated landscape with several multinational corporations and regional players vying for market share. Key players such as Hyundai Engineering Co Ltd, JGC Holdings Corporation, Sumitomo Corporation, Trung Nam Group, Toshiba Corporation, Doosan Heavy Industries & Construction Co Ltd, Indika Energy, Kawasaki Heavy Industries Ltd, IHI Corporation, and Mitsubishi Heavy Industries Ltd hold significant positions, although market share varies considerably across segments and countries.
- Market Concentration: The Herfindahl-Hirschman Index (HHI) for the overall market is estimated at xx, indicating a moderately concentrated market. Individual segment concentration varies significantly; Renewables shows higher fragmentation compared to Conventional Thermal Power.
- Innovation Drivers: Government policies promoting renewable energy, coupled with technological advancements in solar, wind, and gas turbine technologies, are driving innovation. The push for energy efficiency and grid modernization also fuels innovation in EPC solutions.
- Regulatory Frameworks: Varying regulatory landscapes across ASEAN nations create both opportunities and challenges. Some countries offer attractive incentives for renewable energy projects, while others face bureaucratic hurdles. Harmonization of regulations could boost market growth.
- Product Substitutes: While direct substitutes for EPC services are limited, alternative financing models and project delivery methods are emerging.
- End-User Trends: A shift towards cleaner energy sources and increased demand for decentralized power generation are shaping end-user preferences.
- M&A Activities: The past five years have witnessed xx Million in M&A deals in the ASEAN Power EPC market, driven by consolidation among players and expansion into new markets. Larger companies are acquiring smaller firms to gain expertise in specific technologies or geographic regions.
ASEAN Power EPC Market Industry Trends & Insights
The ASEAN Power EPC market is experiencing robust growth, fueled by a confluence of factors: surging energy demand driven by rapid economic expansion and population growth; proactive government policies promoting renewable energy sources through incentives and supportive regulations; and the increasing cost-competitiveness of renewable energy technologies like solar PV and wind turbines. This dynamic market is projected to achieve a significant Compound Annual Growth Rate (CAGR) of [Insert Updated CAGR]% during the forecast period (2025-2033), reaching a market value of [Insert Updated Market Value] Million by 2033. This expansion is further facilitated by the ongoing modernization and replacement of aging power infrastructure across the region and increased cross-border collaboration fostered by initiatives such as the ASEAN Economic Community (AEC).
Several key factors are driving this growth trajectory:
- Exponential Energy Demand: The ASEAN region's burgeoning economies and expanding populations are creating an unprecedented surge in electricity demand, necessitating a substantial increase in generation capacity.
- Government-led Renewable Energy Transition: ASEAN nations are actively embracing renewable energy, implementing supportive policies, offering tax incentives, and establishing feed-in tariffs to accelerate the adoption of cleaner energy sources. This policy environment is attracting significant investment in renewable power projects, creating lucrative opportunities for EPC companies.
- Technological Advancements Driving Efficiency and Cost Reduction: Continuous innovation in renewable energy technologies has significantly improved their efficiency and reduced their costs, making them increasingly competitive with traditional energy sources. This technological progress is accelerating the adoption of renewables and shaping the demand for EPC services.
- Infrastructure Modernization and Upgrades: A substantial portion of the region's existing power infrastructure is aging and requires modernization or complete replacement. This presents a significant pipeline of EPC projects focused on refurbishment and upgrades.
- Regional Economic Integration Fostering Collaboration: The AEC is fostering increased cross-border investment and collaboration, creating a more integrated and efficient market for EPC services within the ASEAN region.
Dominant Markets & Segments in ASEAN Power EPC Market
The ASEAN Power EPC market is highly diverse. While specific market share data is proprietary, this section analyzes the relative prominence of individual markets and segments:
Dominant Region/Country: Indonesia and Vietnam currently hold significant shares of the market due to their large populations, rapidly expanding economies, and substantial investments in power infrastructure.
Dominant Segment: Conventional Thermal Power currently dominates the market in terms of value, driven by existing infrastructure and continued reliance on fossil fuels. However, the Renewables Power segment is experiencing the fastest growth due to increasing government support and declining renewable energy costs. Nuclear Power remains a relatively small segment in ASEAN, with limited ongoing projects.
Key Drivers for Indonesia and Vietnam:
- Strong Economic Growth: High economic growth rates in both countries fuel rising energy demand.
- Government Infrastructure Investments: Significant government investments in power generation and transmission infrastructure are crucial drivers.
- Favorable Regulatory Environment: Relatively supportive policies and regulatory frameworks make these markets attractive for EPC companies.
ASEAN Power EPC Market Product Developments
The ASEAN Power EPC landscape is undergoing a technological transformation. Innovations are focused on enhancing efficiency, minimizing emissions, and seamlessly integrating renewable energy sources into the grid. This includes the deployment of advanced gas turbines for improved efficiency, the development of smart grids to enhance reliability and renewable energy integration, and the adoption of modular designs for faster and more cost-effective construction. These advancements are providing EPC companies with a competitive edge, enabling them to deliver innovative and cost-effective solutions that meet the evolving needs of their clients.
Report Scope & Segmentation Analysis
This report segments the ASEAN Power EPC market across three key sources of power generation:
Conventional Thermal Power: This segment encompasses the engineering, procurement, and construction of conventional power plants, including coal-fired, gas-fired, and oil-fired plants. The market size in 2024 is estimated at xx Million and is projected to reach xx Million by 2033, with a CAGR of xx%. Competitive dynamics are characterized by a mix of international and regional players.
Renewables Power: This segment covers the EPC of renewable energy projects, such as solar PV, wind, hydro, and biomass power plants. It is experiencing the most rapid growth, expanding from xx Million in 2024 to xx Million by 2033 with a CAGR of xx%. Competition is more fragmented, with a rising number of specialized renewable energy EPC providers.
Nuclear Power: This segment focuses on the EPC of nuclear power plants. It is currently a smaller segment with limited projects. Future growth will depend on government policies and technological advancements.
Key Drivers of ASEAN Power EPC Market Growth
Several key factors are propelling the growth of the ASEAN Power EPC market:
- Rising energy demand fueled by rapid economic growth and increasing industrialization.
- Government initiatives promoting renewable energy adoption and energy security.
- Technological advancements reducing the cost and improving the efficiency of renewable energy technologies.
- Aging infrastructure requiring upgrades and replacements.
- Investments in grid modernization and expansion.
Challenges in the ASEAN Power EPC Market Sector
Despite its growth potential, the ASEAN Power EPC market faces several challenges that impact project timelines and profitability:
- Regulatory Hurdles and Bureaucratic Delays: Complex regulatory processes and bureaucratic delays can significantly impede project development and increase project timelines.
- Supply Chain Disruptions and Material Price Volatility: Global supply chain disruptions and fluctuating material prices pose significant risks, impacting project costs and schedules.
- Intense Competition and Varying Expertise: The market is characterized by intense competition among EPC companies, with varying levels of experience and expertise. This necessitates a strong focus on differentiation and value proposition.
- Financing Constraints and Securing Project Funding: Securing project financing, particularly for large-scale renewable energy projects, remains a significant challenge. Difficulties in accessing capital can lead to delays, cost overruns, and reduced profitability.
- Skills Gap and Workforce Development: The rapid growth of the sector requires a skilled workforce. A shortage of qualified engineers and technicians can hinder project execution and quality.
Emerging Opportunities in ASEAN Power EPC Market
Significant opportunities are emerging in the ASEAN Power EPC market:
- Growing demand for renewable energy projects creates a wealth of opportunities for specialized EPC providers.
- Smart grid development presents opportunities for companies offering advanced grid management and integration solutions.
- Government initiatives promoting energy efficiency present opportunities for companies specializing in energy optimization projects.
- Expansion into underserved markets presents growth potential for ambitious companies.
Leading Players in the ASEAN Power EPC Market Market
- Hyundai Engineering Co Ltd
- JGC Holdings Corporation
- Sumitomo Corporation
- Trung Nam Group
- Toshiba Corporation
- Doosan Heavy Industries & Construction Co Ltd
- Indika Energy
- Kawasaki Heavy Industries Ltd
- IHI Corporation
- Mitsubishi Heavy Industries Ltd
Key Developments in ASEAN Power EPC Market Industry
- December 2021: Solar Philippines Nueva Ecija Corporation (SPNEC) commenced construction of a 500 MW solar PV facility in the Philippines, highlighting the growing investment in renewable energy projects.
- October 2021: Mitsubishi Power commissioned a 500 MW natural gas turbine in Indonesia's Muara Karang Power Plant, demonstrating continued investment in conventional power sources alongside the renewable energy sector.
- March 2022: San Miguel Corp. announced plans to build two gas-fired power stations in the central Philippines (total capacity 1050 MW, USD 1.14 Billion investment), reflecting ongoing investment in gas-fired generation capacity.
- [Add more recent key developments with dates and brief descriptions]
Strategic Outlook for ASEAN Power EPC Market Market
The ASEAN Power EPC market is poised for sustained growth over the next decade, driven by robust energy demand, increasing investment in renewable energy, and the modernization of power infrastructure. Companies focused on innovation, efficiency, and sustainable solutions are well-positioned to capitalize on the numerous opportunities that this dynamic market presents. The market's future is characterized by a shift towards cleaner energy and greater integration of renewable sources within the power grid.
ASEAN Power EPC Market Segmentation
-
1. Source
- 1.1. Conventional Thermal Power
- 1.2. Renewables Power
- 1.3. Nuclear Power
-
2. Geography
- 2.1. Indonesia
- 2.2. Thailand
- 2.3. Malaysia
- 2.4. Vietnam
- 2.5. Philippines
- 2.6. Rest of the ASEAN Countries
ASEAN Power EPC Market Segmentation By Geography
- 1. Indonesia
- 2. Thailand
- 3. Malaysia
- 4. Vietnam
- 5. Philippines
- 6. Rest of the ASEAN Countries
ASEAN Power EPC Market REPORT HIGHLIGHTS
| Aspects | Details |
|---|---|
| Study Period | 2019-2033 |
| Base Year | 2024 |
| Estimated Year | 2025 |
| Forecast Period | 2025-2033 |
| Historical Period | 2019-2024 |
| Growth Rate | CAGR of > 6.00% from 2019-2033 |
| Segmentation |
|
Table of Contents
- 1. Introduction
- 1.1. Research Scope
- 1.2. Market Segmentation
- 1.3. Research Methodology
- 1.4. Definitions and Assumptions
- 2. Executive Summary
- 2.1. Introduction
- 3. Market Dynamics
- 3.1. Introduction
- 3.2. Market Drivers
- 3.2.1. 4.; Uninterrupted and Reliable Power Supply and Heavy Deployment of DG (diesel generator) Set4.; Improvement in Technology of Diesel Generator
- 3.3. Market Restrains
- 3.3.1. 4.; The Growing Trend of Renewable Power Generation
- 3.4. Market Trends
- 3.4.1. Renewables Power Source to Witness Significant Growth
- 4. Market Factor Analysis
- 4.1. Porters Five Forces
- 4.2. Supply/Value Chain
- 4.3. PESTEL analysis
- 4.4. Market Entropy
- 4.5. Patent/Trademark Analysis
- 5. Global ASEAN Power EPC Market Analysis, Insights and Forecast, 2019-2031
- 5.1. Market Analysis, Insights and Forecast - by Source
- 5.1.1. Conventional Thermal Power
- 5.1.2. Renewables Power
- 5.1.3. Nuclear Power
- 5.2. Market Analysis, Insights and Forecast - by Geography
- 5.2.1. Indonesia
- 5.2.2. Thailand
- 5.2.3. Malaysia
- 5.2.4. Vietnam
- 5.2.5. Philippines
- 5.2.6. Rest of the ASEAN Countries
- 5.3. Market Analysis, Insights and Forecast - by Region
- 5.3.1. Indonesia
- 5.3.2. Thailand
- 5.3.3. Malaysia
- 5.3.4. Vietnam
- 5.3.5. Philippines
- 5.3.6. Rest of the ASEAN Countries
- 5.1. Market Analysis, Insights and Forecast - by Source
- 6. Indonesia ASEAN Power EPC Market Analysis, Insights and Forecast, 2019-2031
- 6.1. Market Analysis, Insights and Forecast - by Source
- 6.1.1. Conventional Thermal Power
- 6.1.2. Renewables Power
- 6.1.3. Nuclear Power
- 6.2. Market Analysis, Insights and Forecast - by Geography
- 6.2.1. Indonesia
- 6.2.2. Thailand
- 6.2.3. Malaysia
- 6.2.4. Vietnam
- 6.2.5. Philippines
- 6.2.6. Rest of the ASEAN Countries
- 6.1. Market Analysis, Insights and Forecast - by Source
- 7. Thailand ASEAN Power EPC Market Analysis, Insights and Forecast, 2019-2031
- 7.1. Market Analysis, Insights and Forecast - by Source
- 7.1.1. Conventional Thermal Power
- 7.1.2. Renewables Power
- 7.1.3. Nuclear Power
- 7.2. Market Analysis, Insights and Forecast - by Geography
- 7.2.1. Indonesia
- 7.2.2. Thailand
- 7.2.3. Malaysia
- 7.2.4. Vietnam
- 7.2.5. Philippines
- 7.2.6. Rest of the ASEAN Countries
- 7.1. Market Analysis, Insights and Forecast - by Source
- 8. Malaysia ASEAN Power EPC Market Analysis, Insights and Forecast, 2019-2031
- 8.1. Market Analysis, Insights and Forecast - by Source
- 8.1.1. Conventional Thermal Power
- 8.1.2. Renewables Power
- 8.1.3. Nuclear Power
- 8.2. Market Analysis, Insights and Forecast - by Geography
- 8.2.1. Indonesia
- 8.2.2. Thailand
- 8.2.3. Malaysia
- 8.2.4. Vietnam
- 8.2.5. Philippines
- 8.2.6. Rest of the ASEAN Countries
- 8.1. Market Analysis, Insights and Forecast - by Source
- 9. Vietnam ASEAN Power EPC Market Analysis, Insights and Forecast, 2019-2031
- 9.1. Market Analysis, Insights and Forecast - by Source
- 9.1.1. Conventional Thermal Power
- 9.1.2. Renewables Power
- 9.1.3. Nuclear Power
- 9.2. Market Analysis, Insights and Forecast - by Geography
- 9.2.1. Indonesia
- 9.2.2. Thailand
- 9.2.3. Malaysia
- 9.2.4. Vietnam
- 9.2.5. Philippines
- 9.2.6. Rest of the ASEAN Countries
- 9.1. Market Analysis, Insights and Forecast - by Source
- 10. Philippines ASEAN Power EPC Market Analysis, Insights and Forecast, 2019-2031
- 10.1. Market Analysis, Insights and Forecast - by Source
- 10.1.1. Conventional Thermal Power
- 10.1.2. Renewables Power
- 10.1.3. Nuclear Power
- 10.2. Market Analysis, Insights and Forecast - by Geography
- 10.2.1. Indonesia
- 10.2.2. Thailand
- 10.2.3. Malaysia
- 10.2.4. Vietnam
- 10.2.5. Philippines
- 10.2.6. Rest of the ASEAN Countries
- 10.1. Market Analysis, Insights and Forecast - by Source
- 11. Rest of the ASEAN Countries ASEAN Power EPC Market Analysis, Insights and Forecast, 2019-2031
- 11.1. Market Analysis, Insights and Forecast - by Source
- 11.1.1. Conventional Thermal Power
- 11.1.2. Renewables Power
- 11.1.3. Nuclear Power
- 11.2. Market Analysis, Insights and Forecast - by Geography
- 11.2.1. Indonesia
- 11.2.2. Thailand
- 11.2.3. Malaysia
- 11.2.4. Vietnam
- 11.2.5. Philippines
- 11.2.6. Rest of the ASEAN Countries
- 11.1. Market Analysis, Insights and Forecast - by Source
- 12. North America ASEAN Power EPC Market Analysis, Insights and Forecast, 2019-2031
- 12.1. Market Analysis, Insights and Forecast - By Country/Sub-region
- 12.1.1 United States
- 12.1.2 Canada
- 12.1.3 Mexico
- 13. Europe ASEAN Power EPC Market Analysis, Insights and Forecast, 2019-2031
- 13.1. Market Analysis, Insights and Forecast - By Country/Sub-region
- 13.1.1 Germany
- 13.1.2 United Kingdom
- 13.1.3 France
- 13.1.4 Spain
- 13.1.5 Italy
- 13.1.6 Spain
- 13.1.7 Belgium
- 13.1.8 Netherland
- 13.1.9 Nordics
- 13.1.10 Rest of Europe
- 14. Asia Pacific ASEAN Power EPC Market Analysis, Insights and Forecast, 2019-2031
- 14.1. Market Analysis, Insights and Forecast - By Country/Sub-region
- 14.1.1 China
- 14.1.2 Japan
- 14.1.3 India
- 14.1.4 South Korea
- 14.1.5 Southeast Asia
- 14.1.6 Australia
- 14.1.7 Indonesia
- 14.1.8 Phillipes
- 14.1.9 Singapore
- 14.1.10 Thailandc
- 14.1.11 Rest of Asia Pacific
- 15. South America ASEAN Power EPC Market Analysis, Insights and Forecast, 2019-2031
- 15.1. Market Analysis, Insights and Forecast - By Country/Sub-region
- 15.1.1 Brazil
- 15.1.2 Argentina
- 15.1.3 Peru
- 15.1.4 Chile
- 15.1.5 Colombia
- 15.1.6 Ecuador
- 15.1.7 Venezuela
- 15.1.8 Rest of South America
- 16. MEA ASEAN Power EPC Market Analysis, Insights and Forecast, 2019-2031
- 16.1. Market Analysis, Insights and Forecast - By Country/Sub-region
- 16.1.1 United Arab Emirates
- 16.1.2 Saudi Arabia
- 16.1.3 South Africa
- 16.1.4 Rest of Middle East and Africa
- 17. Competitive Analysis
- 17.1. Global Market Share Analysis 2024
- 17.2. Company Profiles
- 17.2.1 Hyundai Engineering Co Ltd
- 17.2.1.1. Overview
- 17.2.1.2. Products
- 17.2.1.3. SWOT Analysis
- 17.2.1.4. Recent Developments
- 17.2.1.5. Financials (Based on Availability)
- 17.2.2 JGC Holdings Corporation
- 17.2.2.1. Overview
- 17.2.2.2. Products
- 17.2.2.3. SWOT Analysis
- 17.2.2.4. Recent Developments
- 17.2.2.5. Financials (Based on Availability)
- 17.2.3 Sumitomo Corporation
- 17.2.3.1. Overview
- 17.2.3.2. Products
- 17.2.3.3. SWOT Analysis
- 17.2.3.4. Recent Developments
- 17.2.3.5. Financials (Based on Availability)
- 17.2.4 Trung Nam Group
- 17.2.4.1. Overview
- 17.2.4.2. Products
- 17.2.4.3. SWOT Analysis
- 17.2.4.4. Recent Developments
- 17.2.4.5. Financials (Based on Availability)
- 17.2.5 Toshiba Corporation
- 17.2.5.1. Overview
- 17.2.5.2. Products
- 17.2.5.3. SWOT Analysis
- 17.2.5.4. Recent Developments
- 17.2.5.5. Financials (Based on Availability)
- 17.2.6 Doosan Heavy Industries & Construction Co Ltd
- 17.2.6.1. Overview
- 17.2.6.2. Products
- 17.2.6.3. SWOT Analysis
- 17.2.6.4. Recent Developments
- 17.2.6.5. Financials (Based on Availability)
- 17.2.7 Indika Energy
- 17.2.7.1. Overview
- 17.2.7.2. Products
- 17.2.7.3. SWOT Analysis
- 17.2.7.4. Recent Developments
- 17.2.7.5. Financials (Based on Availability)
- 17.2.8 Kawasaki Heavy Industries Ltd
- 17.2.8.1. Overview
- 17.2.8.2. Products
- 17.2.8.3. SWOT Analysis
- 17.2.8.4. Recent Developments
- 17.2.8.5. Financials (Based on Availability)
- 17.2.9 IHI Corporation
- 17.2.9.1. Overview
- 17.2.9.2. Products
- 17.2.9.3. SWOT Analysis
- 17.2.9.4. Recent Developments
- 17.2.9.5. Financials (Based on Availability)
- 17.2.10 Mitsubishi Heavy Industries Ltd
- 17.2.10.1. Overview
- 17.2.10.2. Products
- 17.2.10.3. SWOT Analysis
- 17.2.10.4. Recent Developments
- 17.2.10.5. Financials (Based on Availability)
- 17.2.1 Hyundai Engineering Co Ltd
List of Figures
- Figure 1: Global ASEAN Power EPC Market Revenue Breakdown (Million, %) by Region 2024 & 2032
- Figure 2: North America ASEAN Power EPC Market Revenue (Million), by Country 2024 & 2032
- Figure 3: North America ASEAN Power EPC Market Revenue Share (%), by Country 2024 & 2032
- Figure 4: Europe ASEAN Power EPC Market Revenue (Million), by Country 2024 & 2032
- Figure 5: Europe ASEAN Power EPC Market Revenue Share (%), by Country 2024 & 2032
- Figure 6: Asia Pacific ASEAN Power EPC Market Revenue (Million), by Country 2024 & 2032
- Figure 7: Asia Pacific ASEAN Power EPC Market Revenue Share (%), by Country 2024 & 2032
- Figure 8: South America ASEAN Power EPC Market Revenue (Million), by Country 2024 & 2032
- Figure 9: South America ASEAN Power EPC Market Revenue Share (%), by Country 2024 & 2032
- Figure 10: MEA ASEAN Power EPC Market Revenue (Million), by Country 2024 & 2032
- Figure 11: MEA ASEAN Power EPC Market Revenue Share (%), by Country 2024 & 2032
- Figure 12: Indonesia ASEAN Power EPC Market Revenue (Million), by Source 2024 & 2032
- Figure 13: Indonesia ASEAN Power EPC Market Revenue Share (%), by Source 2024 & 2032
- Figure 14: Indonesia ASEAN Power EPC Market Revenue (Million), by Geography 2024 & 2032
- Figure 15: Indonesia ASEAN Power EPC Market Revenue Share (%), by Geography 2024 & 2032
- Figure 16: Indonesia ASEAN Power EPC Market Revenue (Million), by Country 2024 & 2032
- Figure 17: Indonesia ASEAN Power EPC Market Revenue Share (%), by Country 2024 & 2032
- Figure 18: Thailand ASEAN Power EPC Market Revenue (Million), by Source 2024 & 2032
- Figure 19: Thailand ASEAN Power EPC Market Revenue Share (%), by Source 2024 & 2032
- Figure 20: Thailand ASEAN Power EPC Market Revenue (Million), by Geography 2024 & 2032
- Figure 21: Thailand ASEAN Power EPC Market Revenue Share (%), by Geography 2024 & 2032
- Figure 22: Thailand ASEAN Power EPC Market Revenue (Million), by Country 2024 & 2032
- Figure 23: Thailand ASEAN Power EPC Market Revenue Share (%), by Country 2024 & 2032
- Figure 24: Malaysia ASEAN Power EPC Market Revenue (Million), by Source 2024 & 2032
- Figure 25: Malaysia ASEAN Power EPC Market Revenue Share (%), by Source 2024 & 2032
- Figure 26: Malaysia ASEAN Power EPC Market Revenue (Million), by Geography 2024 & 2032
- Figure 27: Malaysia ASEAN Power EPC Market Revenue Share (%), by Geography 2024 & 2032
- Figure 28: Malaysia ASEAN Power EPC Market Revenue (Million), by Country 2024 & 2032
- Figure 29: Malaysia ASEAN Power EPC Market Revenue Share (%), by Country 2024 & 2032
- Figure 30: Vietnam ASEAN Power EPC Market Revenue (Million), by Source 2024 & 2032
- Figure 31: Vietnam ASEAN Power EPC Market Revenue Share (%), by Source 2024 & 2032
- Figure 32: Vietnam ASEAN Power EPC Market Revenue (Million), by Geography 2024 & 2032
- Figure 33: Vietnam ASEAN Power EPC Market Revenue Share (%), by Geography 2024 & 2032
- Figure 34: Vietnam ASEAN Power EPC Market Revenue (Million), by Country 2024 & 2032
- Figure 35: Vietnam ASEAN Power EPC Market Revenue Share (%), by Country 2024 & 2032
- Figure 36: Philippines ASEAN Power EPC Market Revenue (Million), by Source 2024 & 2032
- Figure 37: Philippines ASEAN Power EPC Market Revenue Share (%), by Source 2024 & 2032
- Figure 38: Philippines ASEAN Power EPC Market Revenue (Million), by Geography 2024 & 2032
- Figure 39: Philippines ASEAN Power EPC Market Revenue Share (%), by Geography 2024 & 2032
- Figure 40: Philippines ASEAN Power EPC Market Revenue (Million), by Country 2024 & 2032
- Figure 41: Philippines ASEAN Power EPC Market Revenue Share (%), by Country 2024 & 2032
- Figure 42: Rest of the ASEAN Countries ASEAN Power EPC Market Revenue (Million), by Source 2024 & 2032
- Figure 43: Rest of the ASEAN Countries ASEAN Power EPC Market Revenue Share (%), by Source 2024 & 2032
- Figure 44: Rest of the ASEAN Countries ASEAN Power EPC Market Revenue (Million), by Geography 2024 & 2032
- Figure 45: Rest of the ASEAN Countries ASEAN Power EPC Market Revenue Share (%), by Geography 2024 & 2032
- Figure 46: Rest of the ASEAN Countries ASEAN Power EPC Market Revenue (Million), by Country 2024 & 2032
- Figure 47: Rest of the ASEAN Countries ASEAN Power EPC Market Revenue Share (%), by Country 2024 & 2032
List of Tables
- Table 1: Global ASEAN Power EPC Market Revenue Million Forecast, by Region 2019 & 2032
- Table 2: Global ASEAN Power EPC Market Revenue Million Forecast, by Source 2019 & 2032
- Table 3: Global ASEAN Power EPC Market Revenue Million Forecast, by Geography 2019 & 2032
- Table 4: Global ASEAN Power EPC Market Revenue Million Forecast, by Region 2019 & 2032
- Table 5: Global ASEAN Power EPC Market Revenue Million Forecast, by Country 2019 & 2032
- Table 6: United States ASEAN Power EPC Market Revenue (Million) Forecast, by Application 2019 & 2032
- Table 7: Canada ASEAN Power EPC Market Revenue (Million) Forecast, by Application 2019 & 2032
- Table 8: Mexico ASEAN Power EPC Market Revenue (Million) Forecast, by Application 2019 & 2032
- Table 9: Global ASEAN Power EPC Market Revenue Million Forecast, by Country 2019 & 2032
- Table 10: Germany ASEAN Power EPC Market Revenue (Million) Forecast, by Application 2019 & 2032
- Table 11: United Kingdom ASEAN Power EPC Market Revenue (Million) Forecast, by Application 2019 & 2032
- Table 12: France ASEAN Power EPC Market Revenue (Million) Forecast, by Application 2019 & 2032
- Table 13: Spain ASEAN Power EPC Market Revenue (Million) Forecast, by Application 2019 & 2032
- Table 14: Italy ASEAN Power EPC Market Revenue (Million) Forecast, by Application 2019 & 2032
- Table 15: Spain ASEAN Power EPC Market Revenue (Million) Forecast, by Application 2019 & 2032
- Table 16: Belgium ASEAN Power EPC Market Revenue (Million) Forecast, by Application 2019 & 2032
- Table 17: Netherland ASEAN Power EPC Market Revenue (Million) Forecast, by Application 2019 & 2032
- Table 18: Nordics ASEAN Power EPC Market Revenue (Million) Forecast, by Application 2019 & 2032
- Table 19: Rest of Europe ASEAN Power EPC Market Revenue (Million) Forecast, by Application 2019 & 2032
- Table 20: Global ASEAN Power EPC Market Revenue Million Forecast, by Country 2019 & 2032
- Table 21: China ASEAN Power EPC Market Revenue (Million) Forecast, by Application 2019 & 2032
- Table 22: Japan ASEAN Power EPC Market Revenue (Million) Forecast, by Application 2019 & 2032
- Table 23: India ASEAN Power EPC Market Revenue (Million) Forecast, by Application 2019 & 2032
- Table 24: South Korea ASEAN Power EPC Market Revenue (Million) Forecast, by Application 2019 & 2032
- Table 25: Southeast Asia ASEAN Power EPC Market Revenue (Million) Forecast, by Application 2019 & 2032
- Table 26: Australia ASEAN Power EPC Market Revenue (Million) Forecast, by Application 2019 & 2032
- Table 27: Indonesia ASEAN Power EPC Market Revenue (Million) Forecast, by Application 2019 & 2032
- Table 28: Phillipes ASEAN Power EPC Market Revenue (Million) Forecast, by Application 2019 & 2032
- Table 29: Singapore ASEAN Power EPC Market Revenue (Million) Forecast, by Application 2019 & 2032
- Table 30: Thailandc ASEAN Power EPC Market Revenue (Million) Forecast, by Application 2019 & 2032
- Table 31: Rest of Asia Pacific ASEAN Power EPC Market Revenue (Million) Forecast, by Application 2019 & 2032
- Table 32: Global ASEAN Power EPC Market Revenue Million Forecast, by Country 2019 & 2032
- Table 33: Brazil ASEAN Power EPC Market Revenue (Million) Forecast, by Application 2019 & 2032
- Table 34: Argentina ASEAN Power EPC Market Revenue (Million) Forecast, by Application 2019 & 2032
- Table 35: Peru ASEAN Power EPC Market Revenue (Million) Forecast, by Application 2019 & 2032
- Table 36: Chile ASEAN Power EPC Market Revenue (Million) Forecast, by Application 2019 & 2032
- Table 37: Colombia ASEAN Power EPC Market Revenue (Million) Forecast, by Application 2019 & 2032
- Table 38: Ecuador ASEAN Power EPC Market Revenue (Million) Forecast, by Application 2019 & 2032
- Table 39: Venezuela ASEAN Power EPC Market Revenue (Million) Forecast, by Application 2019 & 2032
- Table 40: Rest of South America ASEAN Power EPC Market Revenue (Million) Forecast, by Application 2019 & 2032
- Table 41: Global ASEAN Power EPC Market Revenue Million Forecast, by Country 2019 & 2032
- Table 42: United Arab Emirates ASEAN Power EPC Market Revenue (Million) Forecast, by Application 2019 & 2032
- Table 43: Saudi Arabia ASEAN Power EPC Market Revenue (Million) Forecast, by Application 2019 & 2032
- Table 44: South Africa ASEAN Power EPC Market Revenue (Million) Forecast, by Application 2019 & 2032
- Table 45: Rest of Middle East and Africa ASEAN Power EPC Market Revenue (Million) Forecast, by Application 2019 & 2032
- Table 46: Global ASEAN Power EPC Market Revenue Million Forecast, by Source 2019 & 2032
- Table 47: Global ASEAN Power EPC Market Revenue Million Forecast, by Geography 2019 & 2032
- Table 48: Global ASEAN Power EPC Market Revenue Million Forecast, by Country 2019 & 2032
- Table 49: Global ASEAN Power EPC Market Revenue Million Forecast, by Source 2019 & 2032
- Table 50: Global ASEAN Power EPC Market Revenue Million Forecast, by Geography 2019 & 2032
- Table 51: Global ASEAN Power EPC Market Revenue Million Forecast, by Country 2019 & 2032
- Table 52: Global ASEAN Power EPC Market Revenue Million Forecast, by Source 2019 & 2032
- Table 53: Global ASEAN Power EPC Market Revenue Million Forecast, by Geography 2019 & 2032
- Table 54: Global ASEAN Power EPC Market Revenue Million Forecast, by Country 2019 & 2032
- Table 55: Global ASEAN Power EPC Market Revenue Million Forecast, by Source 2019 & 2032
- Table 56: Global ASEAN Power EPC Market Revenue Million Forecast, by Geography 2019 & 2032
- Table 57: Global ASEAN Power EPC Market Revenue Million Forecast, by Country 2019 & 2032
- Table 58: Global ASEAN Power EPC Market Revenue Million Forecast, by Source 2019 & 2032
- Table 59: Global ASEAN Power EPC Market Revenue Million Forecast, by Geography 2019 & 2032
- Table 60: Global ASEAN Power EPC Market Revenue Million Forecast, by Country 2019 & 2032
- Table 61: Global ASEAN Power EPC Market Revenue Million Forecast, by Source 2019 & 2032
- Table 62: Global ASEAN Power EPC Market Revenue Million Forecast, by Geography 2019 & 2032
- Table 63: Global ASEAN Power EPC Market Revenue Million Forecast, by Country 2019 & 2032
Frequently Asked Questions
1. What is the projected Compound Annual Growth Rate (CAGR) of the ASEAN Power EPC Market?
The projected CAGR is approximately > 6.00%.
2. Which companies are prominent players in the ASEAN Power EPC Market?
Key companies in the market include Hyundai Engineering Co Ltd, JGC Holdings Corporation, Sumitomo Corporation, Trung Nam Group, Toshiba Corporation, Doosan Heavy Industries & Construction Co Ltd, Indika Energy, Kawasaki Heavy Industries Ltd, IHI Corporation, Mitsubishi Heavy Industries Ltd.
3. What are the main segments of the ASEAN Power EPC Market?
The market segments include Source, Geography.
4. Can you provide details about the market size?
The market size is estimated to be USD XX Million as of 2022.
5. What are some drivers contributing to market growth?
4.; Uninterrupted and Reliable Power Supply and Heavy Deployment of DG (diesel generator) Set4.; Improvement in Technology of Diesel Generator.
6. What are the notable trends driving market growth?
Renewables Power Source to Witness Significant Growth.
7. Are there any restraints impacting market growth?
4.; The Growing Trend of Renewable Power Generation.
8. Can you provide examples of recent developments in the market?
In December 2021, Solar Philippines Nueva Ecija Corporation (SPNEC), a major project developer based in the Philippines, started constructing the first 50 MW unit of a 500 MW solar PV facility. The first 50 MW is planned to be commissioned by the end of 2022 and the rest of the project by 2023.
9. What pricing options are available for accessing the report?
Pricing options include single-user, multi-user, and enterprise licenses priced at USD 4750, USD 5250, and USD 8750 respectively.
10. Is the market size provided in terms of value or volume?
The market size is provided in terms of value, measured in Million.
11. Are there any specific market keywords associated with the report?
Yes, the market keyword associated with the report is "ASEAN Power EPC Market," which aids in identifying and referencing the specific market segment covered.
12. How do I determine which pricing option suits my needs best?
The pricing options vary based on user requirements and access needs. Individual users may opt for single-user licenses, while businesses requiring broader access may choose multi-user or enterprise licenses for cost-effective access to the report.
13. Are there any additional resources or data provided in the ASEAN Power EPC Market report?
While the report offers comprehensive insights, it's advisable to review the specific contents or supplementary materials provided to ascertain if additional resources or data are available.
14. How can I stay updated on further developments or reports in the ASEAN Power EPC Market?
To stay informed about further developments, trends, and reports in the ASEAN Power EPC Market, consider subscribing to industry newsletters, following relevant companies and organizations, or regularly checking reputable industry news sources and publications.
Methodology
Step 1 - Identification of Relevant Samples Size from Population Database


Step 2 - Approaches for Defining Global Market Size (Value, Volume* & Price*)

Note*: In applicable scenarios
Step 3 - Data Sources
Primary Research
- Web Analytics
- Survey Reports
- Research Institute
- Latest Research Reports
- Opinion Leaders
Secondary Research
- Annual Reports
- White Paper
- Latest Press Release
- Industry Association
- Paid Database
- Investor Presentations

Step 4 - Data Triangulation
Involves using different sources of information in order to increase the validity of a study
These sources are likely to be stakeholders in a program - participants, other researchers, program staff, other community members, and so on.
Then we put all data in single framework & apply various statistical tools to find out the dynamic on the market.
During the analysis stage, feedback from the stakeholder groups would be compared to determine areas of agreement as well as areas of divergence


