DERMS Industry in North America: Market Dynamics and Forecasts 2025-2033

DERMS Industry by Technology (Solar Photovoltaic (PV), Electric Vehicles, Microgrids, Other Technologies), by End User (Industrial, Residential, Commercial), by North America (United States, Canada, Rest of North America), by Europe (Germany, Italy, France, United Kingdom, Rest of Europe), by Asia Pacific (India, China, Japan, South Korea, Rest of Asia Pacific), by South America (Brazil, Argentina, Rest of South America), by Middle East and Africa (United Arab Emirates, Saudi Arabia, Saudi Arabia, Rest of Middle East and Africa) Forecast 2025-2033

Jul 2 2025
Base Year: 2024

234 Pages
Main Logo

DERMS Industry in North America: Market Dynamics and Forecasts 2025-2033


Home
Industries
Energy & Power
sponsor image
sponsor image
sponsor image
sponsor image
sponsor image

Tailored for you

  • In-depth Analysis Tailored to Specified Regions or Segments
  • Company Profiles Customized to User Preferences
  • Comprehensive Insights Focused on Specific Segments or Regions
  • Customized Evaluation of Competitive Landscape to Meet Your Needs
  • Tailored Customization to Address Other Specific Requirements
Ask for customization


Key Insights

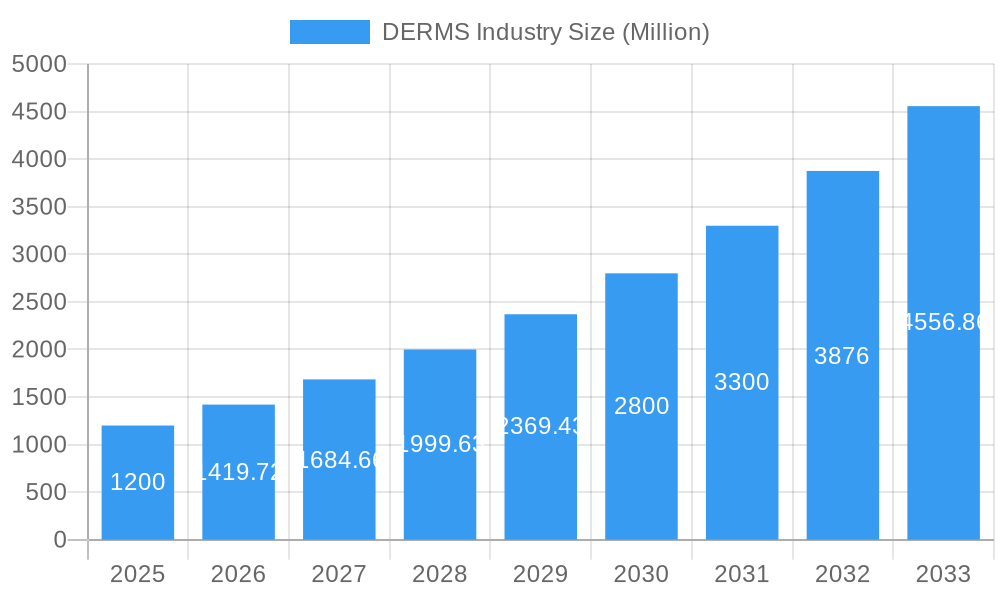
The Distributed Energy Resource Management System (DERMS) market is experiencing robust growth, projected to reach $1.20 billion in 2025 and maintain a Compound Annual Growth Rate (CAGR) of 18.31% from 2025 to 2033. This expansion is fueled by several key factors. The increasing integration of renewable energy sources like solar photovoltaic (PV) and wind power necessitates sophisticated management systems to optimize energy distribution and grid stability. Furthermore, the rise of electric vehicles (EVs) and the growing adoption of microgrids are driving demand for DERMS solutions capable of handling fluctuating loads and ensuring reliable power supply. Government initiatives promoting renewable energy integration and smart grid technologies are also providing significant tailwinds. Technological advancements, such as improved data analytics and artificial intelligence (AI) integration within DERMS platforms, are enhancing efficiency and enabling proactive grid management. The industrial sector, a major adopter of DERMS, is driving significant demand due to its need for optimized energy consumption and cost reduction. Residential and commercial sectors are also showing increased adoption as awareness of energy efficiency and sustainability grows.
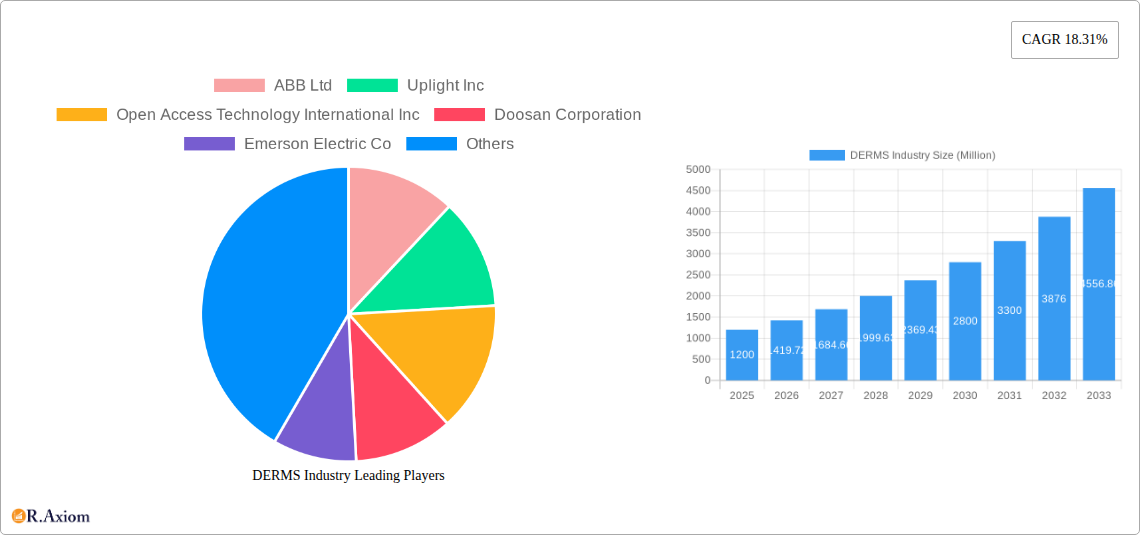
Competition in the DERMS market is intense, with established players like ABB, Siemens, and Schneider Electric competing alongside emerging technology companies. Geographic expansion is a key strategy, with North America, Europe, and Asia Pacific leading the market currently, while developing economies in South America and the Middle East & Africa are expected to show significant growth in the coming years. While the market faces challenges such as high initial investment costs for DERMS implementation and the need for robust cybersecurity measures, the long-term benefits of improved grid stability, enhanced energy efficiency, and reduced carbon emissions outweigh these obstacles, ensuring a positive outlook for the DERMS market. The continued development and refinement of DERMS technology, coupled with favorable regulatory landscapes, will propel the market toward continued expansion and wider adoption across diverse sectors and regions.

DERMS Industry Research Report - Market Size, Growth & Forecast

DERMS Industry Market Report: 2019-2033

This comprehensive report provides a detailed analysis of the Distributed Energy Resource Management System (DERMS) industry, offering actionable insights for stakeholders across the value chain. With a study period spanning 2019-2033, a base year of 2025, and a forecast period of 2025-2033, this report leverages historical data (2019-2024) to project future market trends and opportunities. The global DERMS market is estimated at $XX Million in 2025 and is projected to reach $XX Million by 2033, exhibiting a CAGR of XX%.

DERMS Industry Market Concentration & Innovation

The DERMS industry exhibits a moderately concentrated market structure, with key players such as ABB Ltd, ABB Ltd, Uplight Inc, Open Access Technology International Inc, Doosan Corporation, Emerson Electric Co, Emerson Electric Co, Mitsubishi Electric Corporation, Mitsubishi Electric Corporation, Siemens AG, Siemens AG, Schneider Electric SE, Schneider Electric SE, Oracle Corporation, Oracle Corporation, Engie SA, and General Electric Company holding significant market share. While exact figures are proprietary, market share estimates suggest a top five concentration of approximately XX%.

Innovation is driven by several factors, including the increasing penetration of renewable energy sources (solar PV, wind), the rise of electric vehicles, the development of advanced microgrids, and the need for smarter grid management. Regulatory frameworks, particularly those promoting renewable energy integration and grid modernization, are significant catalysts. Product substitutes are limited, with traditional centralized energy management systems facing increasing obsolescence. The trend towards smart homes and smart cities, alongside increasing demand for grid resilience and efficiency, fuels end-user adoption. M&A activity in the DERMS space has seen several deals valued at $XX Million in recent years, primarily focusing on acquiring specialized technology companies and expanding geographic reach.

  • Market Share: Top 5 players hold approximately XX% of the market.
  • M&A Deal Values: Recent years have seen deals valued at approximately $XX Million.
  • Innovation Drivers: Renewable energy integration, electric vehicles, microgrids, smart grid technologies.
  • Regulatory Influence: Policies promoting renewable energy and grid modernization.

DERMS Industry Trends & Insights

The DERMS market is experiencing robust growth, driven by several key factors. The global shift towards renewable energy sources, particularly solar PV, is a major catalyst. The IEA's January 2024 report highlighting a 50% increase in renewable energy capacity addition in 2023, reaching almost 510 GW, underscores this trend. This growth presents significant opportunities for DERMS solutions to effectively manage and integrate distributed generation resources. Furthermore, the increasing adoption of electric vehicles and the development of sophisticated microgrids are creating substantial demand for advanced DERMS capabilities. Consumer preferences are shifting towards sustainability and energy efficiency, which further bolster the market. However, the industry faces competitive dynamics with established players and emerging startups vying for market share. The competitive landscape is characterized by ongoing innovation, strategic partnerships, and mergers and acquisitions. The CAGR for the forecast period is projected at XX%, demonstrating the significant growth potential within the sector. Market penetration is increasing steadily, with estimates indicating approximately XX% penetration in key regions by 2033.

DERMS Industry Growth

Dominant Markets & Segments in DERMS Industry

The North American market, specifically the United States, is currently the dominant region, driven by strong government support for renewable energy integration and grid modernization initiatives, like those highlighted by the NCCETC's February 2024 report detailing 774 grid modernization actions in 2023. Key drivers for this dominance include robust regulatory frameworks, substantial investments in renewable energy infrastructure, and a significant uptake of smart grid technologies.

  • Leading Region: North America (United States)

  • Dominant Technology Segment: Solar Photovoltaic (PV), fueled by the rapid growth in solar energy adoption globally (January 2024 IEA report).

  • Dominant End-User Segment: Commercial, driven by the need for improved energy efficiency and cost management.

Key Drivers for Dominant Segments:

  • Solar PV: Government incentives, decreasing solar panel costs, and increasing energy security concerns.
  • Commercial: Demand for enhanced energy management, cost savings, and operational efficiency.

Europe and Asia are also showing substantial growth, albeit at a slightly slower pace than North America. The European market is influenced by stringent environmental regulations and targets, while the Asian market is characterized by rapidly expanding renewable energy capacity and increasing urbanization.

DERMS Industry Product Developments

Recent product innovations focus on enhancing functionalities such as predictive analytics, advanced forecasting, real-time optimization, and seamless integration with various DERs. These features provide competitive advantages by improving grid stability, enhancing operational efficiency, and maximizing the utilization of renewable energy sources. The development of AI-driven solutions and cloud-based platforms are significant technological trends enhancing scalability and flexibility. The market fit of these new products is strong, driven by growing demand for efficient and reliable energy management solutions. The emergence of integrated platforms providing demand and inventory control, like Alloy.ai's offering from April 2023, signifies a growing trend in optimizing DER management across the entire value chain.

Report Scope & Segmentation Analysis

This report segments the DERMS market by technology (Solar Photovoltaic (PV), Electric Vehicles, Microgrids, Other Technologies) and end-user (Industrial, Residential, Commercial). Each segment's growth projection, market size, and competitive dynamics are analyzed separately.

Technology Segments: The solar PV segment is projected to witness the fastest growth, driven by the rising adoption of solar power. The electric vehicle segment is anticipated to experience significant growth due to increasing EV adoption. Microgrids are showing promising growth, especially in remote areas and areas prone to power outages. The "Other Technologies" segment, encompassing technologies like energy storage systems, is also experiencing moderate growth.

End-User Segments: The commercial segment holds the largest market share currently, while the industrial and residential segments are expected to show robust growth in the coming years.

Key Drivers of DERMS Industry Growth

Several factors are driving the growth of the DERMS industry. These include the increasing penetration of renewable energy sources like solar and wind, necessitating advanced management systems. The surge in electric vehicle adoption adds another layer of complexity to the grid, creating demand for intelligent management solutions. Furthermore, government regulations promoting renewable energy integration and grid modernization, such as those seen in the US (NCCETC report, February 2024), are key catalysts. The growing need for improved grid resilience and reliability also fuels market growth.

Challenges in the DERMS Industry Sector

The DERMS industry faces several challenges. Interoperability issues among different DER technologies remain a significant hurdle. The complexity of integrating various DERs into existing grid infrastructure poses technical challenges. Furthermore, the high initial investment costs for implementing DERMS solutions can be a barrier to adoption for some stakeholders. The need for skilled workforce and cybersecurity concerns pose additional challenges. Supply chain disruptions impacting component availability can also impede growth.

Emerging Opportunities in DERMS Industry

Several emerging opportunities exist in the DERMS market. The integration of AI and machine learning into DERMS platforms promises to enhance efficiency and optimize grid operation. The growing adoption of blockchain technology offers potential for improved security and transparency in energy transactions. Expansion into emerging markets with growing electricity demand presents significant growth prospects. Furthermore, advancements in energy storage technologies, like long-duration energy storage discussed in the February 2024 NCCETC report, are expected to open new opportunities for DERMS applications.

Leading Players in the DERMS Industry Market

  • ABB Ltd
  • Uplight Inc
  • Open Access Technology International Inc
  • Doosan Corporation
  • Emerson Electric Co
  • Mitsubishi Electric Corporation
  • Siemens AG
  • Schneider Electric SE
  • Oracle Corporation
  • Engie SA
  • General Electric Company

Key Developments in DERMS Industry

  • February 2024: 774 grid modernization actions taken across more than fifty US states, highlighting trends in virtual power plants, cost recovery for interconnection upgrades, long-duration energy storage, and demand response programs (NCCETC).
  • January 2024: Global renewable electricity capacity expanded by 50% in 2023, reaching almost 510 GW, with solar PV accounting for three-quarters of the additions (IEA).
  • April 2023: Alloy.ai launched a new demand and inventory control tower for consumer brands, reflecting integration trends in the DERMS ecosystem.

Strategic Outlook for DERMS Industry Market

The DERMS market is poised for substantial growth, driven by the global energy transition and the increasing adoption of distributed energy resources. The continued expansion of renewable energy, the growth of electric vehicles, and advancements in grid modernization technologies will create significant demand for sophisticated DERMS solutions. The focus on enhancing grid resilience, improving energy efficiency, and integrating various DERs into a cohesive system represents strong growth catalysts for the coming years. The ongoing development of innovative technologies like AI, machine learning, and blockchain will further drive the market forward.

DERMS Industry Segmentation

  • 1. Technology
    • 1.1. Solar Photovoltaic (PV)
    • 1.2. Electric Vehicles
    • 1.3. Microgrids
    • 1.4. Other Technologies
  • 2. End User
    • 2.1. Industrial
    • 2.2. Residential
    • 2.3. Commercial

DERMS Industry Segmentation By Geography

  • 1. North America
    • 1.1. United States
    • 1.2. Canada
    • 1.3. Rest of North America
  • 2. Europe
    • 2.1. Germany
    • 2.2. Italy
    • 2.3. France
    • 2.4. United Kingdom
    • 2.5. Rest of Europe
  • 3. Asia Pacific
    • 3.1. India
    • 3.2. China
    • 3.3. Japan
    • 3.4. South Korea
    • 3.5. Rest of Asia Pacific
  • 4. South America
    • 4.1. Brazil
    • 4.2. Argentina
    • 4.3. Rest of South America
  • 5. Middle East and Africa
    • 5.1. United Arab Emirates
    • 5.2. Saudi Arabia
    • 5.3. Saudi Arabia
    • 5.4. Rest of Middle East and Africa
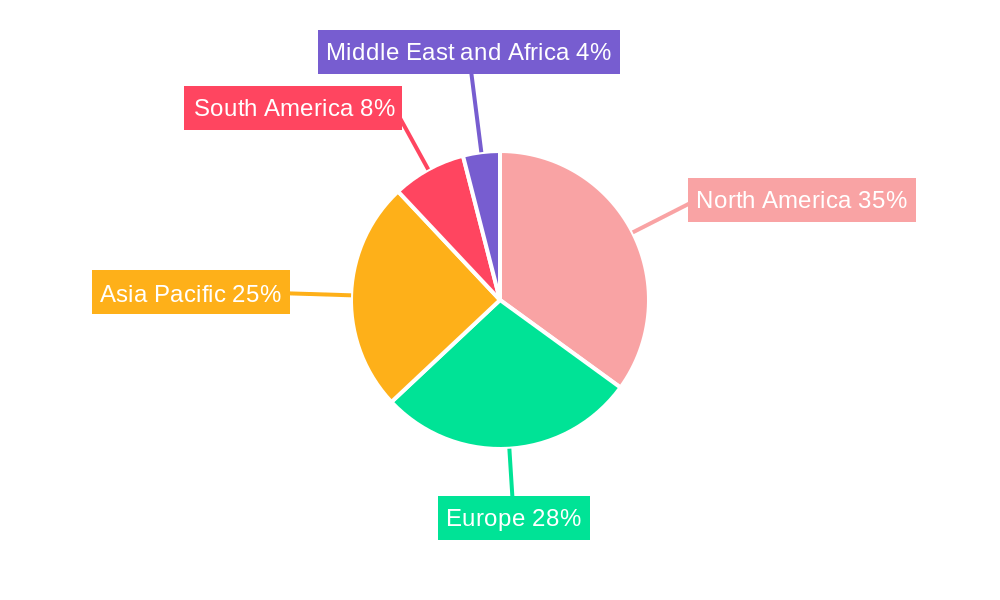
DERMS Industry Regional Share


DERMS Industry REPORT HIGHLIGHTS

AspectsDetails
Study Period 2019-2033
Base Year 2024
Estimated Year 2025
Forecast Period2025-2033
Historical Period2019-2024
Growth RateCAGR of 18.31% from 2019-2033
Segmentation
    • By Technology
      • Solar Photovoltaic (PV)
      • Electric Vehicles
      • Microgrids
      • Other Technologies
    • By End User
      • Industrial
      • Residential
      • Commercial
  • By Geography
    • North America
      • United States
      • Canada
      • Rest of North America
    • Europe
      • Germany
      • Italy
      • France
      • United Kingdom
      • Rest of Europe
    • Asia Pacific
      • India
      • China
      • Japan
      • South Korea
      • Rest of Asia Pacific
    • South America
      • Brazil
      • Argentina
      • Rest of South America
    • Middle East and Africa
      • United Arab Emirates
      • Saudi Arabia
      • Saudi Arabia
      • Rest of Middle East and Africa


Table of Contents

  1. 1. Introduction
    • 1.1. Research Scope
    • 1.2. Market Segmentation
    • 1.3. Research Methodology
    • 1.4. Definitions and Assumptions
  2. 2. Executive Summary
    • 2.1. Introduction
  3. 3. Market Dynamics
    • 3.1. Introduction
      • 3.2. Market Drivers
        • 3.2.1. 4.; Increasing Shift Toward Renewables-based Distributed Power Generation4.; Rising Investments in Smart Grid
      • 3.3. Market Restrains
        • 3.3.1. 4.; Expansion and Upgradation of Centralized Grid
      • 3.4. Market Trends
        • 3.4.1. Solar Photovoltaic (PV) Segment to Dominate the Market
  4. 4. Market Factor Analysis
    • 4.1. Porters Five Forces
    • 4.2. Supply/Value Chain
    • 4.3. PESTEL analysis
    • 4.4. Market Entropy
    • 4.5. Patent/Trademark Analysis
  5. 5. Global DERMS Industry Analysis, Insights and Forecast, 2019-2031
    • 5.1. Market Analysis, Insights and Forecast - by Technology
      • 5.1.1. Solar Photovoltaic (PV)
      • 5.1.2. Electric Vehicles
      • 5.1.3. Microgrids
      • 5.1.4. Other Technologies
    • 5.2. Market Analysis, Insights and Forecast - by End User
      • 5.2.1. Industrial
      • 5.2.2. Residential
      • 5.2.3. Commercial
    • 5.3. Market Analysis, Insights and Forecast - by Region
      • 5.3.1. North America
      • 5.3.2. Europe
      • 5.3.3. Asia Pacific
      • 5.3.4. South America
      • 5.3.5. Middle East and Africa
  6. 6. North America DERMS Industry Analysis, Insights and Forecast, 2019-2031
    • 6.1. Market Analysis, Insights and Forecast - by Technology
      • 6.1.1. Solar Photovoltaic (PV)
      • 6.1.2. Electric Vehicles
      • 6.1.3. Microgrids
      • 6.1.4. Other Technologies
    • 6.2. Market Analysis, Insights and Forecast - by End User
      • 6.2.1. Industrial
      • 6.2.2. Residential
      • 6.2.3. Commercial
  7. 7. Europe DERMS Industry Analysis, Insights and Forecast, 2019-2031
    • 7.1. Market Analysis, Insights and Forecast - by Technology
      • 7.1.1. Solar Photovoltaic (PV)
      • 7.1.2. Electric Vehicles
      • 7.1.3. Microgrids
      • 7.1.4. Other Technologies
    • 7.2. Market Analysis, Insights and Forecast - by End User
      • 7.2.1. Industrial
      • 7.2.2. Residential
      • 7.2.3. Commercial
  8. 8. Asia Pacific DERMS Industry Analysis, Insights and Forecast, 2019-2031
    • 8.1. Market Analysis, Insights and Forecast - by Technology
      • 8.1.1. Solar Photovoltaic (PV)
      • 8.1.2. Electric Vehicles
      • 8.1.3. Microgrids
      • 8.1.4. Other Technologies
    • 8.2. Market Analysis, Insights and Forecast - by End User
      • 8.2.1. Industrial
      • 8.2.2. Residential
      • 8.2.3. Commercial
  9. 9. South America DERMS Industry Analysis, Insights and Forecast, 2019-2031
    • 9.1. Market Analysis, Insights and Forecast - by Technology
      • 9.1.1. Solar Photovoltaic (PV)
      • 9.1.2. Electric Vehicles
      • 9.1.3. Microgrids
      • 9.1.4. Other Technologies
    • 9.2. Market Analysis, Insights and Forecast - by End User
      • 9.2.1. Industrial
      • 9.2.2. Residential
      • 9.2.3. Commercial
  10. 10. Middle East and Africa DERMS Industry Analysis, Insights and Forecast, 2019-2031
    • 10.1. Market Analysis, Insights and Forecast - by Technology
      • 10.1.1. Solar Photovoltaic (PV)
      • 10.1.2. Electric Vehicles
      • 10.1.3. Microgrids
      • 10.1.4. Other Technologies
    • 10.2. Market Analysis, Insights and Forecast - by End User
      • 10.2.1. Industrial
      • 10.2.2. Residential
      • 10.2.3. Commercial
  11. 11. North America DERMS Industry Analysis, Insights and Forecast, 2019-2031
      • 11.1. Market Analysis, Insights and Forecast - By Country/Sub-region
        • 11.1.1 United States
        • 11.1.2 Canada
        • 11.1.3 Rest of North America
  12. 12. Europe DERMS Industry Analysis, Insights and Forecast, 2019-2031
      • 12.1. Market Analysis, Insights and Forecast - By Country/Sub-region
        • 12.1.1 Germany
        • 12.1.2 Italy
        • 12.1.3 France
        • 12.1.4 United Kingdom
        • 12.1.5 Rest of Europe
  13. 13. Asia Pacific DERMS Industry Analysis, Insights and Forecast, 2019-2031
      • 13.1. Market Analysis, Insights and Forecast - By Country/Sub-region
        • 13.1.1 India
        • 13.1.2 China
        • 13.1.3 Japan
        • 13.1.4 South Korea
        • 13.1.5 Rest of Asia Pacific
  14. 14. South America DERMS Industry Analysis, Insights and Forecast, 2019-2031
      • 14.1. Market Analysis, Insights and Forecast - By Country/Sub-region
        • 14.1.1 Brazil
        • 14.1.2 Argentina
        • 14.1.3 Rest of South America
  15. 15. Middle East and Africa DERMS Industry Analysis, Insights and Forecast, 2019-2031
      • 15.1. Market Analysis, Insights and Forecast - By Country/Sub-region
        • 15.1.1 United Arab Emirates
        • 15.1.2 Saudi Arabia
        • 15.1.3 Saudi Arabia
        • 15.1.4 Rest of Middle East and Africa
  16. 16. Competitive Analysis
    • 16.1. Global Market Share Analysis 2024
      • 16.2. Company Profiles
        • 16.2.1 ABB Ltd
          • 16.2.1.1. Overview
          • 16.2.1.2. Products
          • 16.2.1.3. SWOT Analysis
          • 16.2.1.4. Recent Developments
          • 16.2.1.5. Financials (Based on Availability)
        • 16.2.2 Uplight Inc
          • 16.2.2.1. Overview
          • 16.2.2.2. Products
          • 16.2.2.3. SWOT Analysis
          • 16.2.2.4. Recent Developments
          • 16.2.2.5. Financials (Based on Availability)
        • 16.2.3 Open Access Technology International Inc
          • 16.2.3.1. Overview
          • 16.2.3.2. Products
          • 16.2.3.3. SWOT Analysis
          • 16.2.3.4. Recent Developments
          • 16.2.3.5. Financials (Based on Availability)
        • 16.2.4 Doosan Corporation
          • 16.2.4.1. Overview
          • 16.2.4.2. Products
          • 16.2.4.3. SWOT Analysis
          • 16.2.4.4. Recent Developments
          • 16.2.4.5. Financials (Based on Availability)
        • 16.2.5 Emerson Electric Co
          • 16.2.5.1. Overview
          • 16.2.5.2. Products
          • 16.2.5.3. SWOT Analysis
          • 16.2.5.4. Recent Developments
          • 16.2.5.5. Financials (Based on Availability)
        • 16.2.6 Mitsubishi Electric Corporation
          • 16.2.6.1. Overview
          • 16.2.6.2. Products
          • 16.2.6.3. SWOT Analysis
          • 16.2.6.4. Recent Developments
          • 16.2.6.5. Financials (Based on Availability)
        • 16.2.7 Siemens AG
          • 16.2.7.1. Overview
          • 16.2.7.2. Products
          • 16.2.7.3. SWOT Analysis
          • 16.2.7.4. Recent Developments
          • 16.2.7.5. Financials (Based on Availability)
        • 16.2.8 Schneider Electric SE
          • 16.2.8.1. Overview
          • 16.2.8.2. Products
          • 16.2.8.3. SWOT Analysis
          • 16.2.8.4. Recent Developments
          • 16.2.8.5. Financials (Based on Availability)
        • 16.2.9 Oracle Corporation
          • 16.2.9.1. Overview
          • 16.2.9.2. Products
          • 16.2.9.3. SWOT Analysis
          • 16.2.9.4. Recent Developments
          • 16.2.9.5. Financials (Based on Availability)
        • 16.2.10 Engie SA
          • 16.2.10.1. Overview
          • 16.2.10.2. Products
          • 16.2.10.3. SWOT Analysis
          • 16.2.10.4. Recent Developments
          • 16.2.10.5. Financials (Based on Availability)
        • 16.2.11 General Electric Company
          • 16.2.11.1. Overview
          • 16.2.11.2. Products
          • 16.2.11.3. SWOT Analysis
          • 16.2.11.4. Recent Developments
          • 16.2.11.5. Financials (Based on Availability)

List of Figures

  1. Figure 1: Global DERMS Industry Revenue Breakdown (Million, %) by Region 2024 & 2032
  2. Figure 2: North America DERMS Industry Revenue (Million), by Country 2024 & 2032
  3. Figure 3: North America DERMS Industry Revenue Share (%), by Country 2024 & 2032
  4. Figure 4: Europe DERMS Industry Revenue (Million), by Country 2024 & 2032
  5. Figure 5: Europe DERMS Industry Revenue Share (%), by Country 2024 & 2032
  6. Figure 6: Asia Pacific DERMS Industry Revenue (Million), by Country 2024 & 2032
  7. Figure 7: Asia Pacific DERMS Industry Revenue Share (%), by Country 2024 & 2032
  8. Figure 8: South America DERMS Industry Revenue (Million), by Country 2024 & 2032
  9. Figure 9: South America DERMS Industry Revenue Share (%), by Country 2024 & 2032
  10. Figure 10: Middle East and Africa DERMS Industry Revenue (Million), by Country 2024 & 2032
  11. Figure 11: Middle East and Africa DERMS Industry Revenue Share (%), by Country 2024 & 2032
  12. Figure 12: North America DERMS Industry Revenue (Million), by Technology 2024 & 2032
  13. Figure 13: North America DERMS Industry Revenue Share (%), by Technology 2024 & 2032
  14. Figure 14: North America DERMS Industry Revenue (Million), by End User 2024 & 2032
  15. Figure 15: North America DERMS Industry Revenue Share (%), by End User 2024 & 2032
  16. Figure 16: North America DERMS Industry Revenue (Million), by Country 2024 & 2032
  17. Figure 17: North America DERMS Industry Revenue Share (%), by Country 2024 & 2032
  18. Figure 18: Europe DERMS Industry Revenue (Million), by Technology 2024 & 2032
  19. Figure 19: Europe DERMS Industry Revenue Share (%), by Technology 2024 & 2032
  20. Figure 20: Europe DERMS Industry Revenue (Million), by End User 2024 & 2032
  21. Figure 21: Europe DERMS Industry Revenue Share (%), by End User 2024 & 2032
  22. Figure 22: Europe DERMS Industry Revenue (Million), by Country 2024 & 2032
  23. Figure 23: Europe DERMS Industry Revenue Share (%), by Country 2024 & 2032
  24. Figure 24: Asia Pacific DERMS Industry Revenue (Million), by Technology 2024 & 2032
  25. Figure 25: Asia Pacific DERMS Industry Revenue Share (%), by Technology 2024 & 2032
  26. Figure 26: Asia Pacific DERMS Industry Revenue (Million), by End User 2024 & 2032
  27. Figure 27: Asia Pacific DERMS Industry Revenue Share (%), by End User 2024 & 2032
  28. Figure 28: Asia Pacific DERMS Industry Revenue (Million), by Country 2024 & 2032
  29. Figure 29: Asia Pacific DERMS Industry Revenue Share (%), by Country 2024 & 2032
  30. Figure 30: South America DERMS Industry Revenue (Million), by Technology 2024 & 2032
  31. Figure 31: South America DERMS Industry Revenue Share (%), by Technology 2024 & 2032
  32. Figure 32: South America DERMS Industry Revenue (Million), by End User 2024 & 2032
  33. Figure 33: South America DERMS Industry Revenue Share (%), by End User 2024 & 2032
  34. Figure 34: South America DERMS Industry Revenue (Million), by Country 2024 & 2032
  35. Figure 35: South America DERMS Industry Revenue Share (%), by Country 2024 & 2032
  36. Figure 36: Middle East and Africa DERMS Industry Revenue (Million), by Technology 2024 & 2032
  37. Figure 37: Middle East and Africa DERMS Industry Revenue Share (%), by Technology 2024 & 2032
  38. Figure 38: Middle East and Africa DERMS Industry Revenue (Million), by End User 2024 & 2032
  39. Figure 39: Middle East and Africa DERMS Industry Revenue Share (%), by End User 2024 & 2032
  40. Figure 40: Middle East and Africa DERMS Industry Revenue (Million), by Country 2024 & 2032
  41. Figure 41: Middle East and Africa DERMS Industry Revenue Share (%), by Country 2024 & 2032

List of Tables

  1. Table 1: Global DERMS Industry Revenue Million Forecast, by Region 2019 & 2032
  2. Table 2: Global DERMS Industry Revenue Million Forecast, by Technology 2019 & 2032
  3. Table 3: Global DERMS Industry Revenue Million Forecast, by End User 2019 & 2032
  4. Table 4: Global DERMS Industry Revenue Million Forecast, by Region 2019 & 2032
  5. Table 5: Global DERMS Industry Revenue Million Forecast, by Country 2019 & 2032
  6. Table 6: United States DERMS Industry Revenue (Million) Forecast, by Application 2019 & 2032
  7. Table 7: Canada DERMS Industry Revenue (Million) Forecast, by Application 2019 & 2032
  8. Table 8: Rest of North America DERMS Industry Revenue (Million) Forecast, by Application 2019 & 2032
  9. Table 9: Global DERMS Industry Revenue Million Forecast, by Country 2019 & 2032
  10. Table 10: Germany DERMS Industry Revenue (Million) Forecast, by Application 2019 & 2032
  11. Table 11: Italy DERMS Industry Revenue (Million) Forecast, by Application 2019 & 2032
  12. Table 12: France DERMS Industry Revenue (Million) Forecast, by Application 2019 & 2032
  13. Table 13: United Kingdom DERMS Industry Revenue (Million) Forecast, by Application 2019 & 2032
  14. Table 14: Rest of Europe DERMS Industry Revenue (Million) Forecast, by Application 2019 & 2032
  15. Table 15: Global DERMS Industry Revenue Million Forecast, by Country 2019 & 2032
  16. Table 16: India DERMS Industry Revenue (Million) Forecast, by Application 2019 & 2032
  17. Table 17: China DERMS Industry Revenue (Million) Forecast, by Application 2019 & 2032
  18. Table 18: Japan DERMS Industry Revenue (Million) Forecast, by Application 2019 & 2032
  19. Table 19: South Korea DERMS Industry Revenue (Million) Forecast, by Application 2019 & 2032
  20. Table 20: Rest of Asia Pacific DERMS Industry Revenue (Million) Forecast, by Application 2019 & 2032
  21. Table 21: Global DERMS Industry Revenue Million Forecast, by Country 2019 & 2032
  22. Table 22: Brazil DERMS Industry Revenue (Million) Forecast, by Application 2019 & 2032
  23. Table 23: Argentina DERMS Industry Revenue (Million) Forecast, by Application 2019 & 2032
  24. Table 24: Rest of South America DERMS Industry Revenue (Million) Forecast, by Application 2019 & 2032
  25. Table 25: Global DERMS Industry Revenue Million Forecast, by Country 2019 & 2032
  26. Table 26: United Arab Emirates DERMS Industry Revenue (Million) Forecast, by Application 2019 & 2032
  27. Table 27: Saudi Arabia DERMS Industry Revenue (Million) Forecast, by Application 2019 & 2032
  28. Table 28: Saudi Arabia DERMS Industry Revenue (Million) Forecast, by Application 2019 & 2032
  29. Table 29: Rest of Middle East and Africa DERMS Industry Revenue (Million) Forecast, by Application 2019 & 2032
  30. Table 30: Global DERMS Industry Revenue Million Forecast, by Technology 2019 & 2032
  31. Table 31: Global DERMS Industry Revenue Million Forecast, by End User 2019 & 2032
  32. Table 32: Global DERMS Industry Revenue Million Forecast, by Country 2019 & 2032
  33. Table 33: United States DERMS Industry Revenue (Million) Forecast, by Application 2019 & 2032
  34. Table 34: Canada DERMS Industry Revenue (Million) Forecast, by Application 2019 & 2032
  35. Table 35: Rest of North America DERMS Industry Revenue (Million) Forecast, by Application 2019 & 2032
  36. Table 36: Global DERMS Industry Revenue Million Forecast, by Technology 2019 & 2032
  37. Table 37: Global DERMS Industry Revenue Million Forecast, by End User 2019 & 2032
  38. Table 38: Global DERMS Industry Revenue Million Forecast, by Country 2019 & 2032
  39. Table 39: Germany DERMS Industry Revenue (Million) Forecast, by Application 2019 & 2032
  40. Table 40: Italy DERMS Industry Revenue (Million) Forecast, by Application 2019 & 2032
  41. Table 41: France DERMS Industry Revenue (Million) Forecast, by Application 2019 & 2032
  42. Table 42: United Kingdom DERMS Industry Revenue (Million) Forecast, by Application 2019 & 2032
  43. Table 43: Rest of Europe DERMS Industry Revenue (Million) Forecast, by Application 2019 & 2032
  44. Table 44: Global DERMS Industry Revenue Million Forecast, by Technology 2019 & 2032
  45. Table 45: Global DERMS Industry Revenue Million Forecast, by End User 2019 & 2032
  46. Table 46: Global DERMS Industry Revenue Million Forecast, by Country 2019 & 2032
  47. Table 47: India DERMS Industry Revenue (Million) Forecast, by Application 2019 & 2032
  48. Table 48: China DERMS Industry Revenue (Million) Forecast, by Application 2019 & 2032
  49. Table 49: Japan DERMS Industry Revenue (Million) Forecast, by Application 2019 & 2032
  50. Table 50: South Korea DERMS Industry Revenue (Million) Forecast, by Application 2019 & 2032
  51. Table 51: Rest of Asia Pacific DERMS Industry Revenue (Million) Forecast, by Application 2019 & 2032
  52. Table 52: Global DERMS Industry Revenue Million Forecast, by Technology 2019 & 2032
  53. Table 53: Global DERMS Industry Revenue Million Forecast, by End User 2019 & 2032
  54. Table 54: Global DERMS Industry Revenue Million Forecast, by Country 2019 & 2032
  55. Table 55: Brazil DERMS Industry Revenue (Million) Forecast, by Application 2019 & 2032
  56. Table 56: Argentina DERMS Industry Revenue (Million) Forecast, by Application 2019 & 2032
  57. Table 57: Rest of South America DERMS Industry Revenue (Million) Forecast, by Application 2019 & 2032
  58. Table 58: Global DERMS Industry Revenue Million Forecast, by Technology 2019 & 2032
  59. Table 59: Global DERMS Industry Revenue Million Forecast, by End User 2019 & 2032
  60. Table 60: Global DERMS Industry Revenue Million Forecast, by Country 2019 & 2032
  61. Table 61: United Arab Emirates DERMS Industry Revenue (Million) Forecast, by Application 2019 & 2032
  62. Table 62: Saudi Arabia DERMS Industry Revenue (Million) Forecast, by Application 2019 & 2032
  63. Table 63: Saudi Arabia DERMS Industry Revenue (Million) Forecast, by Application 2019 & 2032
  64. Table 64: Rest of Middle East and Africa DERMS Industry Revenue (Million) Forecast, by Application 2019 & 2032


Frequently Asked Questions

1. What is the projected Compound Annual Growth Rate (CAGR) of the DERMS Industry?

The projected CAGR is approximately 18.31%.

2. Which companies are prominent players in the DERMS Industry?

Key companies in the market include ABB Ltd, Uplight Inc, Open Access Technology International Inc, Doosan Corporation, Emerson Electric Co, Mitsubishi Electric Corporation, Siemens AG, Schneider Electric SE, Oracle Corporation, Engie SA, General Electric Company.

3. What are the main segments of the DERMS Industry?

The market segments include Technology, End User.

4. Can you provide details about the market size?

The market size is estimated to be USD 1.20 Million as of 2022.

5. What are some drivers contributing to market growth?

4.; Increasing Shift Toward Renewables-based Distributed Power Generation4.; Rising Investments in Smart Grid.

6. What are the notable trends driving market growth?

Solar Photovoltaic (PV) Segment to Dominate the Market.

7. Are there any restraints impacting market growth?

4.; Expansion and Upgradation of Centralized Grid.

8. Can you provide examples of recent developments in the market?

February 2024: According to the N.C. Clean Energy Technology Center (NCCETC), a total of 774 grid modernization actions were taken in more than fifty states in 2023. The top trend in grid modernization includes the growing interest in virtual power plants, cost recovery for interconnection upgrades, examining the impacts of wholesale market participation, studying long-duration energy storage, utilities proposing new performance incentive mechanisms, undertaking grid resilience planning, utilities pursuing pilot programs and projects, utilizing green button standards for access to customer energy usage data, providing customers with demand response incentive opportunities, and utilities exploring opt-out time-varying rates.

9. What pricing options are available for accessing the report?

Pricing options include single-user, multi-user, and enterprise licenses priced at USD 4750, USD 5250, and USD 8750 respectively.

10. Is the market size provided in terms of value or volume?

The market size is provided in terms of value, measured in Million.

11. Are there any specific market keywords associated with the report?

Yes, the market keyword associated with the report is "DERMS Industry," which aids in identifying and referencing the specific market segment covered.

12. How do I determine which pricing option suits my needs best?

The pricing options vary based on user requirements and access needs. Individual users may opt for single-user licenses, while businesses requiring broader access may choose multi-user or enterprise licenses for cost-effective access to the report.

13. Are there any additional resources or data provided in the DERMS Industry report?

While the report offers comprehensive insights, it's advisable to review the specific contents or supplementary materials provided to ascertain if additional resources or data are available.

14. How can I stay updated on further developments or reports in the DERMS Industry?

To stay informed about further developments, trends, and reports in the DERMS Industry, consider subscribing to industry newsletters, following relevant companies and organizations, or regularly checking reputable industry news sources and publications.


Methodology

Step 1 - Identification of Relevant Samples Size from Population Database

Step Chart
Bar Chart
Method Chart

Step 2 - Approaches for Defining Global Market Size (Value, Volume* & Price*)

Approach Chart
Top-down and bottom-up approaches are used to validate the global market size and estimate the market size for manufactures, regional segments, product, and application.

Note*: In applicable scenarios

Step 3 - Data Sources

Primary Research

  • Web Analytics
  • Survey Reports
  • Research Institute
  • Latest Research Reports
  • Opinion Leaders

Secondary Research

  • Annual Reports
  • White Paper
  • Latest Press Release
  • Industry Association
  • Paid Database
  • Investor Presentations
Analyst Chart

Step 4 - Data Triangulation

Involves using different sources of information in order to increase the validity of a study

These sources are likely to be stakeholders in a program - participants, other researchers, program staff, other community members, and so on.

Then we put all data in single framework & apply various statistical tools to find out the dynamic on the market.

During the analysis stage, feedback from the stakeholder groups would be compared to determine areas of agreement as well as areas of divergence

Additionally, after gathering mixed and scattered data from a wide range of sources, data is triangulated and correlated to come up with estimated figures which are further validated through primary mediums or industry experts, opinion leaders.

About Research Axiom

Research Axiom delivers in-depth market research, industry analysis, and consulting for pharmaceuticals, automotive, IT, and consumer goods. Our reports provide the clarity you need to make informed decisions and drive innovation.

Our team combines primary research, advanced analytics, and sector expertise to deliver actionable intelligence. We offer syndicated reports, custom research, and consulting services tailored to your business needs.

At Research Axiom, we are committed to quality, transparency, and client satisfaction. Every report is rigorously validated to ensure accuracy and relevance. Our global perspective and local expertise help you understand both the big picture and the finer details of your market.

Stay informed with Research Axiom. Subscribe to our newsletter for the latest updates and research highlights, and follow us on social media for real-time insights. Research Axiom – Turning Data into Business Advantage.

artwork spiralartwork spiralRelated Reports
artwork underline

Consumer Behavior and Canada Distributed Solar Power Generation Market Trends

Explore the booming Canadian Distributed Solar Power Generation Market, projected to exceed USD 15,000 million by 2025 with a CAGR over 12.00%. Discover key drivers, trends, restraints, and leading companies shaping the future of renewable energy in Canada.

October 2025
Base Year: 2024
No Of Pages: 197
Price: $3800

Deep Water Drilling Market 2025-2033 Overview: Trends, Competitor Dynamics, and Opportunities

Explore the booming Deep Water Drilling Market, forecast to reach USD 38.5 billion by 2026, driven by energy demand and technological advancements. Discover key drivers, restraints, segments, and regional insights for offshore oil and gas exploration.

October 2025
Base Year: 2024
No Of Pages: 234
Price: $4750

Exploring Consumer Shifts in China LNG Bunkering Market Market 2025-2033

Explore the booming China LNG Bunkering Market, projected for robust growth driven by environmental regulations and clean fuel adoption. Discover key trends, market size, and leading companies in this essential sector for maritime decarbonization.

October 2025
Base Year: 2024
No Of Pages: 180
Price: $3800

Blowers Market: Harnessing Emerging Innovations for Growth 2025-2033

Explore the robust growth trajectory of the global Blowers Market, driven by industrial expansion and technological innovation. Understand key drivers, trends, and regional dynamics shaping this essential industry from 2019 to 2033.

October 2025
Base Year: 2024
No Of Pages: 234
Price: $4750

Technological Advances in Asia-Pacific Combined Heat and Power Market Market: Trends and Opportunities 2025-2033

Explore the dynamic Asia-Pacific Combined Heat and Power (CHP) market, driven by energy efficiency, emission reduction, and strong CAGR (>5.90%). Discover key drivers, trends, restraints, and segments including Commercial & Industrial applications and Natural Gas fuel types in China, India, and Japan.

October 2025
Base Year: 2024
No Of Pages: 234
Price: $4750

Understanding Growth Trends in MEA Battery Industry Market

Explore the booming MEA battery market, projected to exceed $7.06 million by 2025 with a CAGR over 7%. Discover key drivers, trends like lithium-ion adoption, and market segments in Saudi Arabia, UAE, South Africa & more.

October 2025
Base Year: 2024
No Of Pages: 234
Price: $4750

South Asia Renewable Energy Industry 2025-2033 Overview: Trends, Competitor Dynamics, and Opportunities

The size of the South Asia Renewable Energy Industry market was valued at USD XX Million in 2024 and is projected to reach USD XXX Million by 2033, with an expected CAGR of 12.00">> 12.00% during the forecast period.

October 2025
Base Year: 2024
No Of Pages: 234
Price: $4750

Regional Insights into North America Smart Transformer Industry Market Growth

Explore the booming North American smart transformer market, driven by grid modernization, renewable energy, and increasing demand for intelligent power solutions. Discover market size, growth drivers, and key players shaping the future of electrical grids.

October 2025
Base Year: 2024
No Of Pages: 234
Price: $4750

Algeria Oil and Gas Downstream Industry Market Disruption Trends and Insights

Explore the dynamic Algeria Oil and Gas Downstream Industry market, projected for significant growth driven by refining upgrades and petrochemical expansion. Understand key trends and market size forecasts.

October 2025
Base Year: 2024
No Of Pages: 197
Price: $3800

Unlocking Growth in South Korea Oil & Gas Industry Market 2025-2033

The size of the South Korea Oil & Gas Industry market was valued at USD XX Million in 2024 and is projected to reach USD XXX Million by 2033, with an expected CAGR of 1.50">> 1.50% during the forecast period.

October 2025
Base Year: 2024
No Of Pages: 197
Price: $3800

Asia Pacific Air Quality Monitoring Market Strategic Dynamics: Competitor Analysis 2025-2033

The size of the Asia Pacific Air Quality Monitoring Market market was valued at USD 77.40 Million in 2024 and is projected to reach USD 105.68 Million by 2033, with an expected CAGR of 4.55% during the forecast period.

October 2025
Base Year: 2024
No Of Pages: 234
Price: $4750

Uzbekistan Power EPC Market CAGR Trends: Growth Outlook 2025-2033

The size of the Uzbekistan Power EPC Market market was valued at USD XX Million in 2024 and is projected to reach USD XXX Million by 2033, with an expected CAGR of 2.41% during the forecast period.

October 2025
Base Year: 2024
No Of Pages: 197
Price: $3800

Regional Insights into Industrial Demand Response Management Systems Market Market Growth

Explore the booming Industrial Demand Response Management Systems market, driven by smart grid adoption and energy efficiency trends. Discover market size, CAGR, key drivers, and regional growth.

October 2025
Base Year: 2024
No Of Pages: 234
Price: $4750

China Switchgear Market CAGR Growth Drivers and Trends: Forecasts 2025-2033

Explore the dynamic China Switchgear Market forecast, analyzing its USD 9.64 billion size and 4.39% CAGR. Discover key drivers like smart grids and renewables, market trends in GIS/AIS, and industry segments for 2025-2033.

October 2025
Base Year: 2024
No Of Pages: 197
Price: $3800

North America Completion Equipment And Services Market Competitive Advantage: Trends and Opportunities to 2033

Explore the North America Completion Equipment and Services Market analysis, identifying key drivers like energy demand and technological advancements. Discover market size, CAGR, restraints, and key companies shaping the future of oil and gas completions.

October 2025
Base Year: 2024
No Of Pages: 234
Price: $4750

Iran Oil and Gas Exploration and Production Industry Market Overview: Trends and Strategic Forecasts 2025-2033

Explore the robust Iran Oil and Gas Exploration and Production market outlook. Discover key drivers, emerging trends, and significant growth opportunities in this vital energy sector through 2033.

October 2025
Base Year: 2024
No Of Pages: 197
Price: $3800

Angola Oil and Gas Upstream Industry Planning for the Future: Key Trends 2025-2033

Explore the Angola Oil and Gas Upstream Industry market analysis, drivers, trends, and forecast. Discover growth opportunities in offshore and onshore exploration, with key insights into market size, CAGR, and major players like ExxonMobil and Chevron.

October 2025
Base Year: 2024
No Of Pages: 197
Price: $3800

Emerging Markets Driving Hydro Generators Industry Growth

Explore the booming Hydro Generators Industry market analysis, drivers, trends, and growth projections up to 2033. Discover key players and regional insights for this vital renewable energy sector.

October 2025
Base Year: 2024
No Of Pages: 234
Price: $4750

Water-Based Drilling and Completion Fluids Industry Decade Long Trends, Analysis and Forecast 2025-2033

The size of the Water-Based Drilling and Completion Fluids Industry market was valued at USD XX Million in 2024 and is projected to reach USD XXX Million by 2033, with an expected CAGR of 5.00">> 5.00% during the forecast period.

October 2025
Base Year: 2024
No Of Pages: 234
Price: $4750

Insights into LPG Industry in India Industry Dynamics

The size of the LPG Industry in India market was valued at USD XX Million in 2024 and is projected to reach USD XXX Million by 2033, with an expected CAGR of 3.50% during the forecast period.

October 2025
Base Year: 2024
No Of Pages: 197
Price: $3800

UK Geothermal Power Industry Drivers of Growth: Opportunities to 2033

Explore the burgeoning UK geothermal power market, driven by net-zero goals and technological innovation. Discover market size, growth drivers, key applications (power generation, direct heat), and leading companies.

October 2025
Base Year: 2024
No Of Pages: 197
Price: $3800

Growth Roadmap for Canada Waste to Energy Market Market 2025-2033

Explore the expanding Canadian Waste to Energy market. Discover key drivers, trends in thermal and biological technologies, and growth forecasts driven by sustainability and policy in Canada's waste management sector.

October 2025
Base Year: 2024
No Of Pages: 197
Price: $3800

Vietnam Oil and Gas Industry 2025 Market Trends and 2033 Forecasts: Exploring Growth Potential

Explore the dynamic Vietnam Oil and Gas Industry market analysis, drivers, trends, restraints, and key segments. Discover growth opportunities and major players shaping Vietnam's energy future.

September 2025
Base Year: 2024
No Of Pages: 197
Price: $3800

Direct Methanol Fuel Cells Market in North America: Market Dynamics and Forecasts 2025-2033

Explore the booming Direct Methanol Fuel Cell (DMFC) market, driven by innovation and demand for portable power. Discover market size, CAGR > 13%, key drivers, restraints, and regional insights for 2019-2033.

September 2025
Base Year: 2024
No Of Pages: 234
Price: $4750

Offshore Helicopter Services Market 2025-2033 Overview: Trends, Dynamics, and Growth Opportunities

The size of the Offshore Helicopter Services Market market was valued at USD 3.54 Million in 2024 and is projected to reach USD 4.63 Million by 2033, with an expected CAGR of 3.90% during the forecast period.

September 2025
Base Year: 2024
No Of Pages: 234
Price: $4750

Asia-Pacific Electrical Bushing Market Strategic Roadmap: Analysis and Forecasts 2025-2033

Explore the dynamic Asia-Pacific Electrical Bushing Market forecast from 2025-2033. Discover key drivers, trends, restraints, and market share for transformers and switchgears, featuring Oil Impregnated Paper and Resin Impregnated Paper bushings.

September 2025
Base Year: 2024
No Of Pages: 234
Price: $4750

Offshore Drilling Industry Future-proof Strategies: Trends, Competitor Dynamics, and Opportunities 2025-2033

Explore the global offshore drilling industry market size of USD 73.20 million, driven by increasing energy demand and technological advancements, with a CAGR of 6.78% from 2025-2033. Analyze key drivers, trends, restraints, and regional opportunities.

September 2025
Base Year: 2024
No Of Pages: 234
Price: $4750

Navigating Gas Market Market Growth 2025-2033

Explore the booming Gas Market, driven by over 50% CAGR and Power-to-X innovations. Discover key drivers, emerging trends, and market segments for sustainable energy solutions.

September 2025
Base Year: 2024
No Of Pages: 234
Price: $4750

Southeast Asia Hydropower Market XX CAGR Growth Outlook 2025-2033

Explore the dynamic Southeast Asia Hydropower Market, driven by rising energy demands and sustainable development. Discover key insights, market size projections, growth drivers, and leading companies shaping the future of renewable energy in the region.

September 2025
Base Year: 2024
No Of Pages: 234
Price: $4750

South-East Asia DC Distribution Network Market in North America: Market Dynamics and Forecasts 2025-2033

The size of the South-East Asia DC Distribution Network Market market was valued at USD XX Million in 2024 and is projected to reach USD XXX Million by 2033, with an expected CAGR of 5.50">> 5.50% during the forecast period.

September 2025
Base Year: 2024
No Of Pages: 234
Price: $4750

South Europe Renewable Energy Market Competitive Advantage: Trends and Opportunities to 2033

Explore the booming South Europe Renewable Energy Market (2025-2033) with insights on market size, drivers, trends, and leading companies in solar, wind, and hydropower.

September 2025
Base Year: 2024
No Of Pages: 234
Price: $4750

Asia-Pacific Offshore Energy Market Market Expansion: Growth Outlook 2025-2033

Explore the booming Asia-Pacific offshore energy market, driven by offshore wind, wave, and tidal power. Uncover market size, CAGR > 9%, key drivers, trends, and restraints shaping this crucial energy transition.

September 2025
Base Year: 2024
No Of Pages: 234
Price: $4750

Understanding Consumer Behavior in Netherlands Solar Energy Market Market: 2025-2033

Explore the booming Netherlands solar energy market, forecast for significant growth with key insights on drivers, trends, restraints, and market segments. Discover opportunities in PV and CSP technologies for residential, industrial, and utility applications.

September 2025
Base Year: 2024
No Of Pages: 197
Price: $3800

Strategic Analysis of Electric Two-wheeler Battery Market Industry Opportunities

The size of the Electric Two-wheeler Battery Market market was valued at USD 10.25 Million in 2024 and is projected to reach USD 32.90 Million by 2033, with an expected CAGR of 18.13% during the forecast period.

September 2025
Base Year: 2024
No Of Pages: 234
Price: $4750

Romania Power Industry Navigating Dynamics Comprehensive Analysis and Forecasts 2025-2033

Explore the dynamic Romanian power industry market forecast 2025-2033. Discover key insights on market size, CAGR 5.66%, drivers, restraints, and segments including renewables, hydropower, and T&D.

September 2025
Base Year: 2024
No Of Pages: 197
Price: $3800

Africa Refined Petroleum Products Market 2025-2033 Trends: Unveiling Growth Opportunities and Competitor Dynamics

Explore the dynamic Africa Refined Petroleum Products Market. Discover key growth drivers, market size projections exceeding $XX billion by 2033, and CAGR over 5.00%. Analyze segments, regional trends in Nigeria, Algeria, Egypt, South Africa, and the vast Rest of Africa. Essential for energy industry stakeholders.

September 2025
Base Year: 2024
No Of Pages: 234
Price: $4750

Analyzing Consumer Behavior in United Kingdom Nuclear Power Industry Market

The size of the United Kingdom Nuclear Power Industry market was valued at USD XX Million in 2024 and is projected to reach USD XXX Million by 2033, with an expected CAGR of 5.00">> 5.00% during the forecast period.

September 2025
Base Year: 2024
No Of Pages: 197
Price: $3800

United States Nuclear Power Plant Equipment Market Market Analysis and Growth Roadmap

Explore the robust growth of the United States Nuclear Power Plant Equipment Market. Discover key insights, market drivers, trends, and vital company information for this essential energy sector.

September 2025
Base Year: 2024
No Of Pages: 197
Price: $3800

GCC Solar Photovoltaic Industry Decoded: Comprehensive Analysis and Forecasts 2025-2033

Explore the booming GCC Solar Photovoltaic (PV) market, projected to exceed $15.5 billion with a CAGR over 12.5%. Discover key drivers, trends, and regional opportunities in UAE, Saudi Arabia, and the wider GCC for solar energy investment.

September 2025
Base Year: 2024
No Of Pages: 234
Price: $4750

Coiled Tubing Services Market Market Demand and Consumption Trends: Outlook 2025-2033

The size of the Coiled Tubing Services Market market was valued at USD XX Million in 2024 and is projected to reach USD XXX Million by 2033, with an expected CAGR of 6.00">> 6.00% during the forecast period.

September 2025
Base Year: 2024
No Of Pages: 234
Price: $4750

Construction Portable Generators Market Charting Growth Trajectories: Analysis and Forecasts 2025-2033

Explore the booming Construction Portable Generators Market, driven by urbanization and infrastructure growth. Discover key segments, power ratings, fuel types, and leading companies shaping this dynamic industry.

September 2025
Base Year: 2024
No Of Pages: 234
Price: $4750

Global Lithium-ion Battery Separator Market For Electric Vehicle Application Market’s Growth Catalysts

Explore the dynamic Global Lithium-ion Battery Separator Market for EV Applications. Discover market size, CAGR of 10.79%, key drivers, trends, and regional insights.

September 2025
Base Year: 2024
No Of Pages: 234
Price: $4750

Power Management Industry Innovations Shaping Market Growth 2025-2033

The size of the Power Management Industry market was valued at USD XX Million in 2024 and is projected to reach USD XXX Million by 2033, with an expected CAGR of 7.02% during the forecast period.

September 2025
Base Year: 2024
No Of Pages: 234
Price: $4750

Strategic Vision for United Arab Emirates Fuel Station Market Industry Trends

Explore the dynamic UAE fuel station market analysis from 2019-2033. Discover market size, CAGR of 2.21%, key drivers, trends, restraints, and leading companies in the United Arab Emirates.

September 2025
Base Year: 2024
No Of Pages: 197
Price: $3800

Comprehensive Overview of Europe Battery Market Trends: 2025-2033

The size of the Europe Battery Market market was valued at USD XX Million in 2024 and is projected to reach USD XXX Million by 2033, with an expected CAGR of 13.44% during the forecast period.

September 2025
Base Year: 2024
No Of Pages: 234
Price: $4750

Spent Fuel And Nuclear Waste Management Industry Consumer Behavior Dynamics: Key Trends 2025-2033

The size of the Spent Fuel And Nuclear Waste Management Industry market was valued at USD XX Million in 2024 and is projected to reach USD XXX Million by 2033, with an expected CAGR of % during the forecast period.

September 2025
Base Year: 2024
No Of Pages: 234
Price: $4750

Solid Control Equipment Market Navigating Dynamics Comprehensive Analysis and Forecasts 2025-2033

Explore the growing Solid Control Equipment market, driven by oil & gas demand and technological innovation. Get insights into market size, CAGR, key players, and regional trends through 2033.

September 2025
Base Year: 2024
No Of Pages: 234
Price: $4750

Unveiling Thailand Power Generation Industry Growth Patterns: CAGR Analysis and Forecasts 2025-2033

The size of the Thailand Power Generation Industry market was valued at USD XX Million in 2024 and is projected to reach USD XXX Million by 2033, with an expected CAGR of 5.80% during the forecast period.

September 2025
Base Year: 2024
No Of Pages: 197
Price: $3800

Austria Waste to Energy Industry Strategic Insights: Analysis 2025 and Forecasts 2033

Explore the booming Austrian Waste to Energy market analysis, including key drivers, trends, and growth projections for 2025-2033. Discover market size, CAGR, and technological advancements.

September 2025
Base Year: 2024
No Of Pages: 197
Price: $3800

United Kingdom Power Market Competitive Strategies: Trends and Forecasts 2025-2033

Explore the booming United Kingdom power market, driven by renewables and net-zero goals. Get insights into market size, CAGR, key drivers, restraints, and leading companies shaping the future of energy.

September 2025
Base Year: 2024
No Of Pages: 197
Price: $3800
  • Home
  • About Us
  • Industries
    • Aerospace & Defense
    • Agriculture
    • Animal Nutrition & Wellness
    • Automotive
    • Chemicals & Materials
    • Consumer Goods and Services
    • Energy & Power
    • Financial Services and Investment Intelligence
    • Food & Beverage
    • Home and Property Improvement
    • Hospitality and Tourism
    • Logistics
    • Manufacturing Products and Services
    • Packaging
    • Professional and Commercial Services
    • Real Estate and Construction
    • Retail
    • Technology, Media and Telecom
    • Healthcare
  • Services
  • Contact
Main Logo
  • Home
  • About Us
  • Industries
    • Aerospace & Defense
    • Agriculture
    • Animal Nutrition & Wellness
    • Automotive
    • Chemicals & Materials
    • Consumer Goods and Services
    • Energy & Power
    • Financial Services and Investment Intelligence
    • Food & Beverage
    • Home and Property Improvement
    • Hospitality and Tourism
    • Logistics
    • Manufacturing Products and Services
    • Packaging
    • Professional and Commercial Services
    • Real Estate and Construction
    • Retail
    • Technology, Media and Telecom
    • Healthcare
  • Services
  • Contact
+17162654855
[email protected]

+17162654855

[email protected]

Business Address

Head Office

Ansec House 3 rd floor Tank Road, Yerwada, Pune, Maharashtra 411014

Contact Information

Craig Francis

Business Development Head

+17162654855

[email protected]

Secure Payment Partners

payment image
RetailLogisticsPackagingAutomotiveHealthcareAgricultureEnergy & PowerFood & BeverageAerospace & DefenseChemicals & MaterialsHospitality and TourismAnimal Nutrition & WellnessConsumer Goods and ServicesReal Estate and ConstructionHome and Property ImprovementTechnology, Media and TelecomManufacturing Products and ServicesFinancial Services and Investment Intelligence

© 2025 PRDUA Research & Media Private Limited, All rights reserved

Privacy Policy
Terms and Conditions
FAQ