
Key Insights
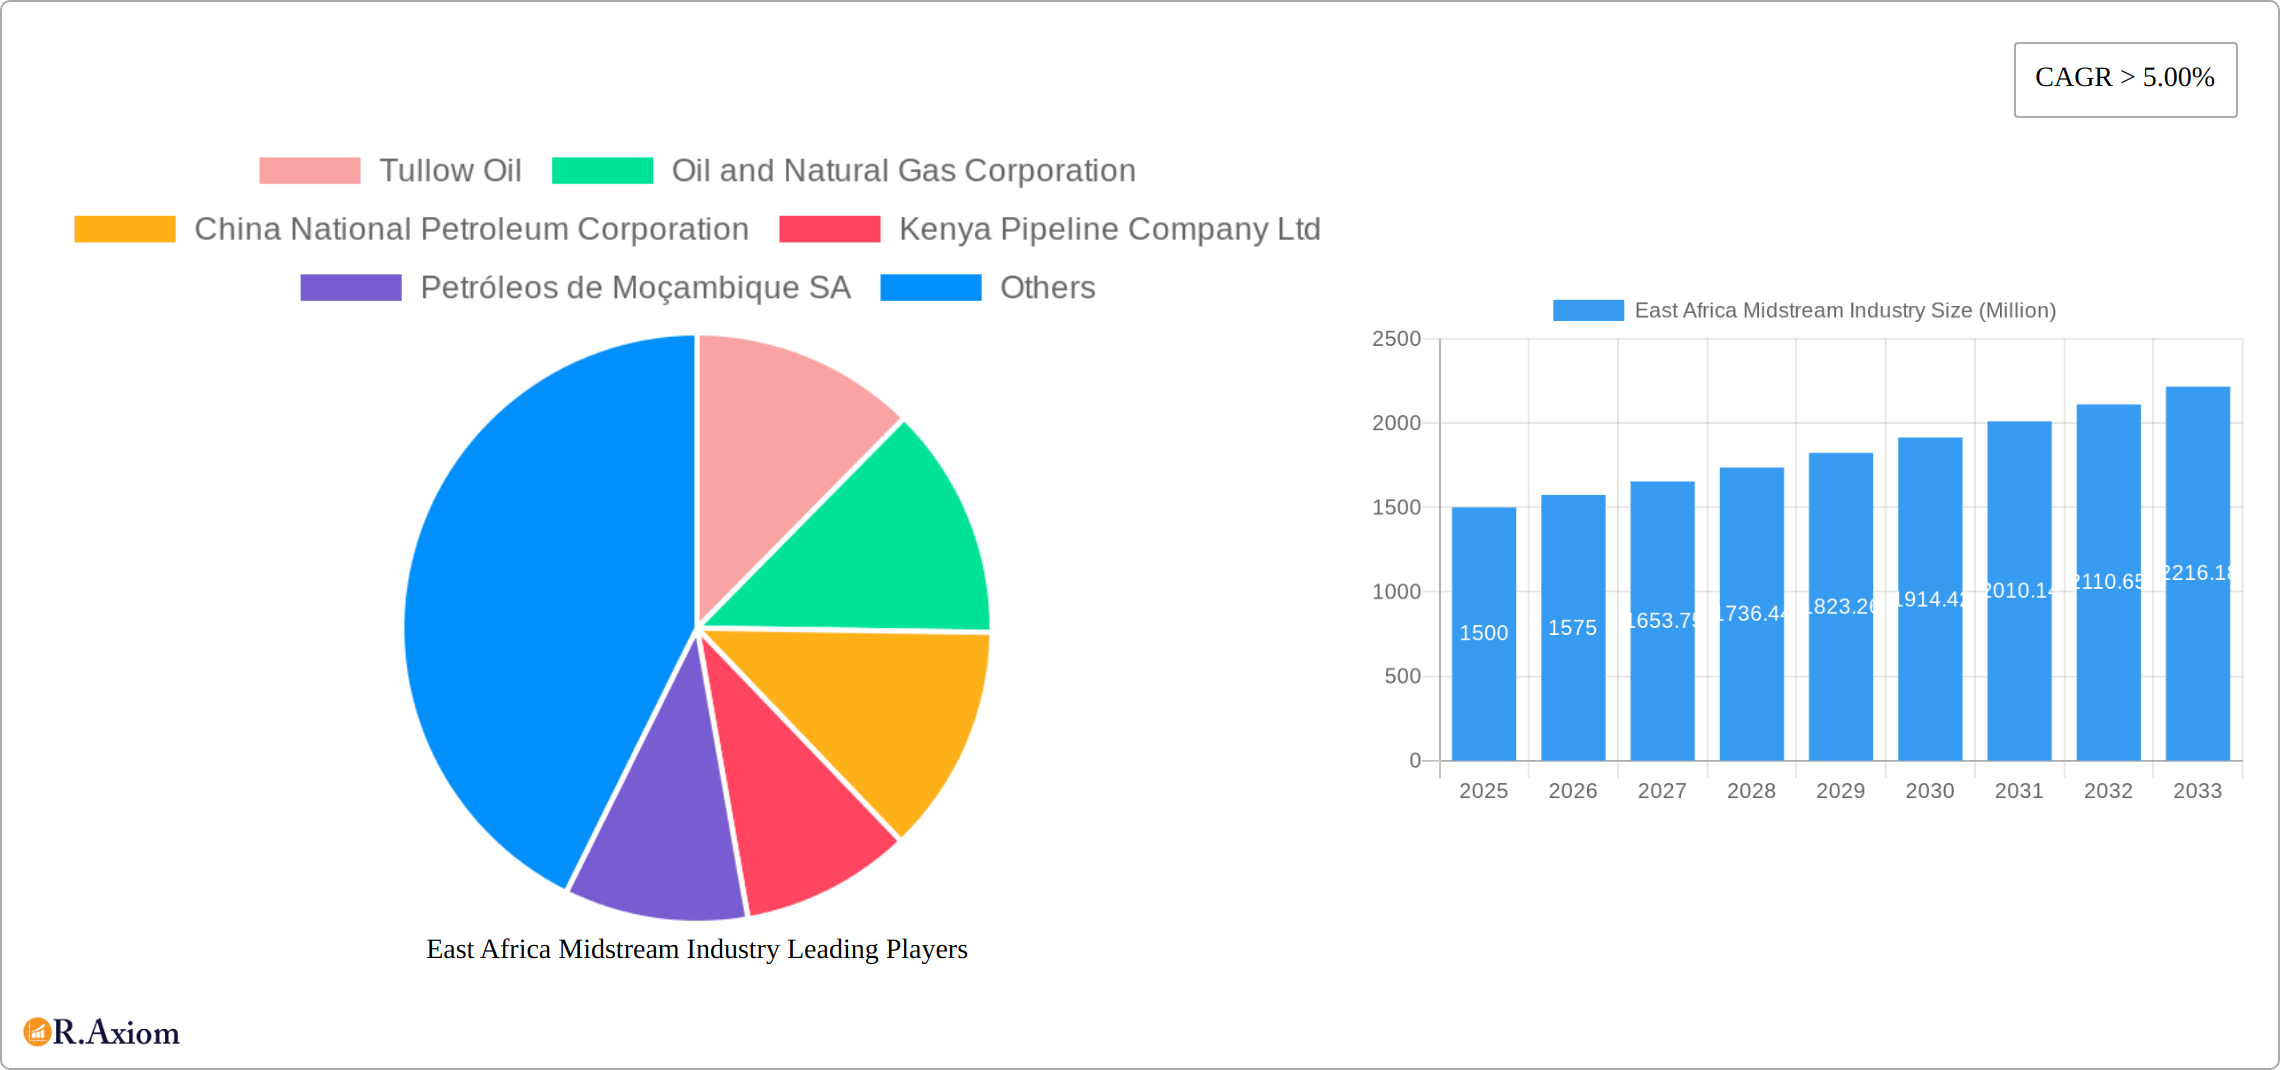
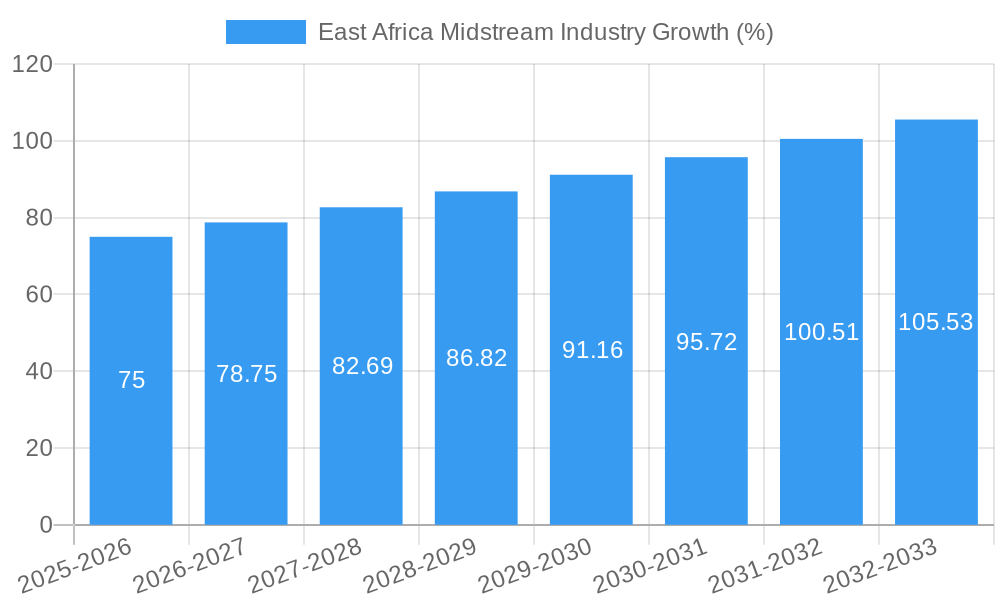
The East African midstream oil and gas industry is experiencing robust growth, driven by increasing energy demand fueled by rapid economic development and population growth across the region. Significant investments in infrastructure projects, such as pipelines and storage facilities, are crucial to support the burgeoning upstream sector's output and facilitate efficient transportation of oil and natural gas to domestic and international markets. Key applications include power generation, industrial processes, and transportation. While the sector benefits from substantial reserves of oil and gas, particularly in countries like Uganda and Tanzania, challenges remain, including infrastructural gaps, regulatory complexities, and geopolitical uncertainties that can impact investment decisions and project timelines. The growth trajectory is projected to remain positive with a Compound Annual Growth Rate (CAGR) exceeding 5% from 2025 to 2033. This expansion will be particularly notable in refined products as regional economies grow and demand for refined fuels increases.
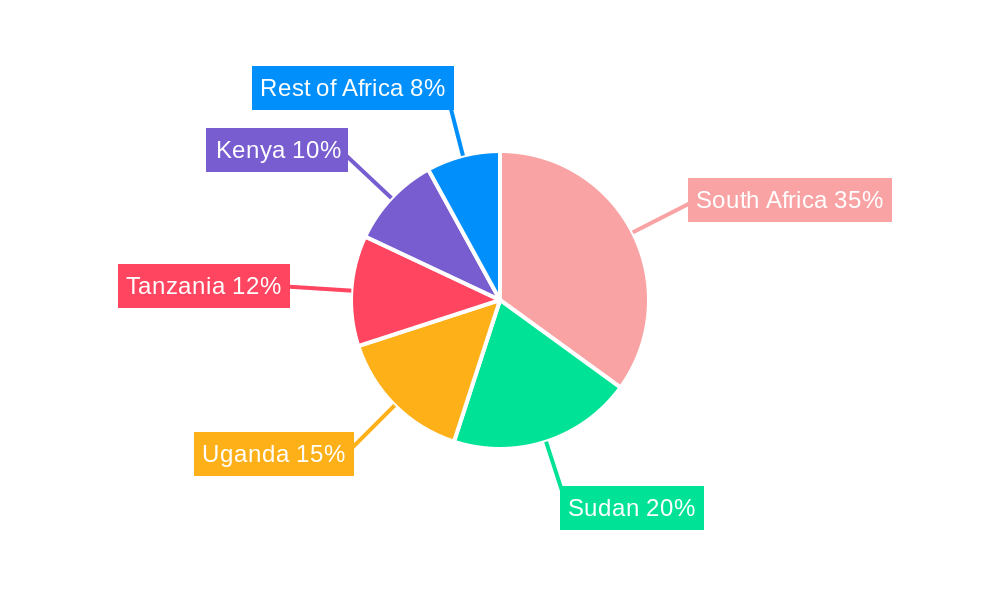
The market is segmented by product (crude oil, natural gas, refined products) and application (power generation, industrial use, transportation). Major players include international energy companies like TotalEnergies and Eni, alongside national oil companies such as the Uganda National Oil Company (UNOC) and Tanzania Petroleum Development Corporation (TPDC). Competition is expected to intensify with further exploration and development, attracting more players and investment. Strategic partnerships between international and national companies will play a vital role in overcoming infrastructural and regulatory hurdles, ultimately driving market expansion and enhancing energy security in the region. The expansion of the midstream sector will depend on the effective implementation of infrastructure projects and the continued positive economic outlook across East Africa. South Africa and Sudan currently represent the largest markets, while countries like Uganda and Tanzania are experiencing rapid growth due to new discoveries and investment. The "Rest of Africa" segment encompasses smaller, emerging markets within East Africa that present considerable long-term potential.
East Africa Midstream Industry: 2019-2033 Market Analysis & Forecast Report
This comprehensive report provides a detailed analysis of the East Africa midstream industry, covering the period 2019-2033, with a focus on market dynamics, key players, and future growth prospects. The report utilizes data from the historical period (2019-2024), base year (2025), and estimated year (2025) to forecast market trends until 2033. This in-depth study is essential for industry stakeholders, investors, and strategic decision-makers seeking to understand the complexities and opportunities within this rapidly evolving market.
East Africa Midstream Industry Market Concentration & Innovation
This section delves into the competitive dynamics of the East African midstream industry, providing a comprehensive analysis of market concentration, innovation drivers, regulatory frameworks, and mergers and acquisitions (M&A) activity. The report details the market share held by key players, including Tullow Oil, Oil and Natural Gas Corporation (ONGC), China National Petroleum Corporation (CNPC), Kenya Pipeline Company Ltd, Petróleos de Moçambique SA, TotalEnergies, Eni S.p.A., Tanzania Petroleum Development Corporation (TPDC), and Uganda National Oil Company (UNOC). A thorough evaluation of M&A activity is included, examining estimated deal values totaling [Insert Updated Value] Million during the study period. The analysis explores innovation drivers, focusing on technological advancements such as pipeline optimization and automation, regulatory pressures promoting efficiency and sustainability, and evolving consumer preferences towards cleaner energy solutions. Furthermore, the report critically examines the regulatory framework's influence on market competition and innovation, considering its impact on investment decisions and operational efficiency. The transition from traditional energy sources to renewables is examined, detailing its impact on the midstream sector and influencing factors such as government incentives and technological feasibility. The analysis also considers end-user trends and their influence on demand for midstream services, considering factors like industrial growth, population growth and urbanization.
East Africa Midstream Industry Industry Trends & Insights
This section delves into the key trends shaping the East Africa midstream industry. It provides a detailed analysis of market growth drivers, including increasing energy demand fueled by population growth and industrialization. Technological disruptions, such as the adoption of advanced pipeline technologies and automation, are examined, along with their impact on operational efficiency and cost reduction. The report also explores shifts in consumer preferences towards cleaner energy sources and their implications for the midstream sector. Competitive dynamics, including pricing strategies, market share battles, and strategic alliances, are analyzed. Key performance indicators (KPIs) such as compound annual growth rate (CAGR) and market penetration are included to provide quantitative insights into the industry's trajectory. The section also forecasts the market size for 2033, estimating it to be xx Million.
Dominant Markets & Segments in East Africa Midstream Industry
This section identifies the dominant markets and segments within the East Africa midstream industry based on product type (Oil, Natural Gas, Refined Products) and application (Power Generation, Industrial, Transportation). A detailed analysis of the leading regions and countries is provided, highlighting the factors contributing to their dominance.
- Key Drivers for Dominant Segments:
- Oil: Growing demand from transportation and industrial sectors. xx Million market size in 2025.
- Natural Gas: Expanding power generation sector and industrial applications. xx Million market size in 2025.
- Refined Products: Increasing consumption from the transportation sector, particularly in rapidly urbanizing areas. xx Million market size in 2025.
- Power Generation: Significant investments in power infrastructure and increasing electricity demand drive growth. xx Million market size in 2025.
- Industrial: Robust industrial growth fueled by manufacturing and processing activities. xx Million market size in 2025.
- Transportation: Expansion of road and rail networks and increasing vehicle ownership boost demand. xx Million market size in 2025.
The report analyzes the influence of economic policies, infrastructure development, and regulatory frameworks on the dominance of specific markets and segments.
East Africa Midstream Industry Product Developments
This section summarizes recent product innovations, applications, and competitive advantages in the East Africa midstream industry. It highlights technological trends, such as the development of more efficient pipeline technologies and the use of data analytics to optimize operations. The section emphasizes the market fit of new products and services and their impact on enhancing efficiency and reducing environmental impact.
Report Scope & Segmentation Analysis
This report segments the East Africa midstream industry by product (crude oil, natural gas, refined petroleum products) and application (power generation, industrial, transportation). Each segment's growth projections, market size (in Millions USD), and competitive dynamics are meticulously analyzed. The forecast period spans from 2025 to 2033, offering a comprehensive outlook on future market trends. Specific growth drivers and challenges are identified for each segment.
- Crude Oil: Growth is driven by increasing demand from both domestic and international markets, with a projected market size of [Insert Updated Value] Million USD by 2033. Factors influencing growth include economic expansion and industrialization.
- Natural Gas: Significant growth potential is fueled by increasing power generation needs and burgeoning industrial applications, with a projected market size of [Insert Updated Value] Million USD by 2033. The development of new gas infrastructure and regional collaborations will be key drivers.
- Refined Products: Demand is expected to rise in line with economic growth and increasing vehicle ownership, projecting a market size of [Insert Updated Value] Million USD by 2033. Demand patterns will be analyzed considering the transition to cleaner fuels.
- Power Generation: This segment is experiencing robust growth due to rising electricity demand across the region, projecting a market size of [Insert Updated Value] Million USD by 2033. This growth will be impacted by investments in renewable energy infrastructure.
- Industrial: The expansion of the industrial sector fuels growth in this segment, projecting a market size of [Insert Updated Value] Million USD by 2033. Industrial diversification and manufacturing growth are key drivers.
- Transportation: The growth of this sector is intrinsically linked to increasing vehicle ownership and improved road networks, projecting a market size of [Insert Updated Value] Million USD by 2033. The adoption of alternative fuels will shape this sector's future.
Key Drivers of East Africa Midstream Industry Growth
Several key factors are propelling the growth of the East Africa midstream industry. These include:
- Increased Energy Demand: Fueled by rapid population growth, urbanization, and industrialization, driving increased consumption across all sectors.
- Infrastructure Development: Significant investments in pipelines, storage terminals, and other critical infrastructure are essential for efficient energy transportation and distribution.
- Government Policies & Regulations: Supportive government policies and regulatory frameworks are crucial for attracting foreign direct investment and stimulating private sector participation.
- Technological Advancements: Innovations in pipeline technologies, automation, and data analytics improve efficiency, reduce operational costs, and enhance safety.
- Regional Integration Initiatives: Collaborative efforts to develop cross-border energy infrastructure are fostering regional energy security and trade.
Challenges in the East Africa Midstream Industry Sector
The East Africa midstream industry faces various challenges:
- Regulatory Hurdles: Complex and ever-changing regulations can hinder investments and operations.
- Infrastructure Deficiencies: Lack of adequate infrastructure in certain regions limits transportation capacity.
- Geopolitical Risks: Political instability in some areas poses risks to operations and investments.
- Supply Chain Disruptions: Global events can affect the availability and cost of energy resources.
Emerging Opportunities in East Africa Midstream Industry
The East Africa midstream industry presents a wealth of lucrative opportunities for investors and stakeholders:
- Growing Energy Demand: The region's burgeoning population and expanding economy present substantial opportunities for midstream infrastructure development.
- Renewable Energy Integration: Opportunities abound for integrating renewable energy sources (solar, wind, geothermal) into the existing midstream infrastructure, supporting a transition to cleaner energy.
- Technological Innovation: Adoption of advanced technologies such as digitalization, automation, and predictive maintenance can improve efficiency, reduce environmental impact, and enhance operational safety.
- Regional Integration: Collaborative regional projects to develop shared energy infrastructure can enhance efficiency, reduce costs, and promote energy security across the region. This includes cross-border pipeline projects and regional energy trading agreements.
- Gas Monetization: The discovery and development of significant natural gas reserves present opportunities for the construction of new gas processing plants, pipelines and liquefaction facilities.
Leading Players in the East Africa Midstream Industry Market
- Tullow Oil
- Oil and Natural Gas Corporation
- China National Petroleum Corporation
- Kenya Pipeline Company Ltd
- Petróleos de Moçambique SA
- TotalEnergies
- Eni S.p.A
- Tanzania Petroleum Development Corporation (TPDC)
- Uganda National Oil Company (UNOC)
Key Developments in East Africa Midstream Industry Industry
- The development of the East Africa Crude Oil Pipeline: Completed in [Month, Year] - significantly increased oil transportation capacity.
- The construction of the Tanzania-Zambia Natural Gas Pipeline: Expected completion in [Month, Year] – will enhance natural gas transportation across borders.
- The launch of the Uganda-Kenya Oil Pipeline: Operational since [Month, Year] – facilitates oil transportation between Uganda and Kenya.
Strategic Outlook for East Africa Midstream Industry Market
The East African midstream industry is poised for substantial growth, driven by a confluence of factors including burgeoning energy demand, ongoing infrastructure development, and technological advancements. Strategic investments in pipeline infrastructure, advanced storage facilities, and cutting-edge technologies will be essential for realizing the industry's considerable market potential. A sustained focus on regional cooperation and integration, coupled with a commitment to sustainable practices, will be instrumental in ensuring the long-term growth and sustainability of the East African midstream industry.
East Africa Midstream Industry Segmentation
- 1. Transportation
- 2. Storage
- 3. LNG Terminals
-
4. Geography
- 4.1. Kenya
- 4.2. Mozambique
- 4.3. Tanzania
- 4.4. Rest of East Africa
East Africa Midstream Industry Segmentation By Geography
- 1. Kenya
- 2. Mozambique
- 3. Tanzania
- 4. Rest of East Africa
East Africa Midstream Industry REPORT HIGHLIGHTS
| Aspects | Details |
|---|---|
| Study Period | 2019-2033 |
| Base Year | 2024 |
| Estimated Year | 2025 |
| Forecast Period | 2025-2033 |
| Historical Period | 2019-2024 |
| Growth Rate | CAGR of > 5.00% from 2019-2033 |
| Segmentation |
|
Table of Contents
- 1. Introduction
- 1.1. Research Scope
- 1.2. Market Segmentation
- 1.3. Research Methodology
- 1.4. Definitions and Assumptions
- 2. Executive Summary
- 2.1. Introduction
- 3. Market Dynamics
- 3.1. Introduction
- 3.2. Market Drivers
- 3.2.1. 4.; Increasing Electricity Demand4.; Rsing Investments in the Coal Industry
- 3.3. Market Restrains
- 3.3.1. 4.; Increasing Installation of Renewable Energy Sources
- 3.4. Market Trends
- 3.4.1. Transportation Sector to Witness Growth
- 4. Market Factor Analysis
- 4.1. Porters Five Forces
- 4.2. Supply/Value Chain
- 4.3. PESTEL analysis
- 4.4. Market Entropy
- 4.5. Patent/Trademark Analysis
- 5. East Africa Midstream Industry Analysis, Insights and Forecast, 2019-2031
- 5.1. Market Analysis, Insights and Forecast - by Transportation
- 5.2. Market Analysis, Insights and Forecast - by Storage
- 5.3. Market Analysis, Insights and Forecast - by LNG Terminals
- 5.4. Market Analysis, Insights and Forecast - by Geography
- 5.4.1. Kenya
- 5.4.2. Mozambique
- 5.4.3. Tanzania
- 5.4.4. Rest of East Africa
- 5.5. Market Analysis, Insights and Forecast - by Region
- 5.5.1. Kenya
- 5.5.2. Mozambique
- 5.5.3. Tanzania
- 5.5.4. Rest of East Africa
- 5.1. Market Analysis, Insights and Forecast - by Transportation
- 6. Kenya East Africa Midstream Industry Analysis, Insights and Forecast, 2019-2031
- 6.1. Market Analysis, Insights and Forecast - by Transportation
- 6.2. Market Analysis, Insights and Forecast - by Storage
- 6.3. Market Analysis, Insights and Forecast - by LNG Terminals
- 6.4. Market Analysis, Insights and Forecast - by Geography
- 6.4.1. Kenya
- 6.4.2. Mozambique
- 6.4.3. Tanzania
- 6.4.4. Rest of East Africa
- 6.1. Market Analysis, Insights and Forecast - by Transportation
- 7. Mozambique East Africa Midstream Industry Analysis, Insights and Forecast, 2019-2031
- 7.1. Market Analysis, Insights and Forecast - by Transportation
- 7.2. Market Analysis, Insights and Forecast - by Storage
- 7.3. Market Analysis, Insights and Forecast - by LNG Terminals
- 7.4. Market Analysis, Insights and Forecast - by Geography
- 7.4.1. Kenya
- 7.4.2. Mozambique
- 7.4.3. Tanzania
- 7.4.4. Rest of East Africa
- 7.1. Market Analysis, Insights and Forecast - by Transportation
- 8. Tanzania East Africa Midstream Industry Analysis, Insights and Forecast, 2019-2031
- 8.1. Market Analysis, Insights and Forecast - by Transportation
- 8.2. Market Analysis, Insights and Forecast - by Storage
- 8.3. Market Analysis, Insights and Forecast - by LNG Terminals
- 8.4. Market Analysis, Insights and Forecast - by Geography
- 8.4.1. Kenya
- 8.4.2. Mozambique
- 8.4.3. Tanzania
- 8.4.4. Rest of East Africa
- 8.1. Market Analysis, Insights and Forecast - by Transportation
- 9. Rest of East Africa East Africa Midstream Industry Analysis, Insights and Forecast, 2019-2031
- 9.1. Market Analysis, Insights and Forecast - by Transportation
- 9.2. Market Analysis, Insights and Forecast - by Storage
- 9.3. Market Analysis, Insights and Forecast - by LNG Terminals
- 9.4. Market Analysis, Insights and Forecast - by Geography
- 9.4.1. Kenya
- 9.4.2. Mozambique
- 9.4.3. Tanzania
- 9.4.4. Rest of East Africa
- 9.1. Market Analysis, Insights and Forecast - by Transportation
- 10. South Africa East Africa Midstream Industry Analysis, Insights and Forecast, 2019-2031
- 11. Sudan East Africa Midstream Industry Analysis, Insights and Forecast, 2019-2031
- 12. Uganda East Africa Midstream Industry Analysis, Insights and Forecast, 2019-2031
- 13. Tanzania East Africa Midstream Industry Analysis, Insights and Forecast, 2019-2031
- 14. Kenya East Africa Midstream Industry Analysis, Insights and Forecast, 2019-2031
- 15. Rest of Africa East Africa Midstream Industry Analysis, Insights and Forecast, 2019-2031
- 16. Competitive Analysis
- 16.1. Market Share Analysis 2024
- 16.2. Company Profiles
- 16.2.1 Tullow Oil
- 16.2.1.1. Overview
- 16.2.1.2. Products
- 16.2.1.3. SWOT Analysis
- 16.2.1.4. Recent Developments
- 16.2.1.5. Financials (Based on Availability)
- 16.2.2 Oil and Natural Gas Corporation
- 16.2.2.1. Overview
- 16.2.2.2. Products
- 16.2.2.3. SWOT Analysis
- 16.2.2.4. Recent Developments
- 16.2.2.5. Financials (Based on Availability)
- 16.2.3 China National Petroleum Corporation
- 16.2.3.1. Overview
- 16.2.3.2. Products
- 16.2.3.3. SWOT Analysis
- 16.2.3.4. Recent Developments
- 16.2.3.5. Financials (Based on Availability)
- 16.2.4 Kenya Pipeline Company Ltd
- 16.2.4.1. Overview
- 16.2.4.2. Products
- 16.2.4.3. SWOT Analysis
- 16.2.4.4. Recent Developments
- 16.2.4.5. Financials (Based on Availability)
- 16.2.5 Petróleos de Moçambique SA
- 16.2.5.1. Overview
- 16.2.5.2. Products
- 16.2.5.3. SWOT Analysis
- 16.2.5.4. Recent Developments
- 16.2.5.5. Financials (Based on Availability)
- 16.2.6 Total S A
- 16.2.6.1. Overview
- 16.2.6.2. Products
- 16.2.6.3. SWOT Analysis
- 16.2.6.4. Recent Developments
- 16.2.6.5. Financials (Based on Availability)
- 16.2.7 Eni S p A *List Not Exhaustive
- 16.2.7.1. Overview
- 16.2.7.2. Products
- 16.2.7.3. SWOT Analysis
- 16.2.7.4. Recent Developments
- 16.2.7.5. Financials (Based on Availability)
- 16.2.8 TotalEnergies
- 16.2.8.1. Overview
- 16.2.8.2. Products
- 16.2.8.3. SWOT Analysis
- 16.2.8.4. Recent Developments
- 16.2.8.5. Financials (Based on Availability)
- 16.2.9 Tanzania Petroleum Development Corporation (TPDC)
- 16.2.9.1. Overview
- 16.2.9.2. Products
- 16.2.9.3. SWOT Analysis
- 16.2.9.4. Recent Developments
- 16.2.9.5. Financials (Based on Availability)
- 16.2.10 Uganda National Oil Company (UNOC)
- 16.2.10.1. Overview
- 16.2.10.2. Products
- 16.2.10.3. SWOT Analysis
- 16.2.10.4. Recent Developments
- 16.2.10.5. Financials (Based on Availability)
- 16.2.1 Tullow Oil
List of Figures
- Figure 1: East Africa Midstream Industry Revenue Breakdown (Million, %) by Product 2024 & 2032
- Figure 2: East Africa Midstream Industry Share (%) by Company 2024
List of Tables
- Table 1: East Africa Midstream Industry Revenue Million Forecast, by Region 2019 & 2032
- Table 2: East Africa Midstream Industry Volume K Tons Forecast, by Region 2019 & 2032
- Table 3: East Africa Midstream Industry Revenue Million Forecast, by Transportation 2019 & 2032
- Table 4: East Africa Midstream Industry Volume K Tons Forecast, by Transportation 2019 & 2032
- Table 5: East Africa Midstream Industry Revenue Million Forecast, by Storage 2019 & 2032
- Table 6: East Africa Midstream Industry Volume K Tons Forecast, by Storage 2019 & 2032
- Table 7: East Africa Midstream Industry Revenue Million Forecast, by LNG Terminals 2019 & 2032
- Table 8: East Africa Midstream Industry Volume K Tons Forecast, by LNG Terminals 2019 & 2032
- Table 9: East Africa Midstream Industry Revenue Million Forecast, by Geography 2019 & 2032
- Table 10: East Africa Midstream Industry Volume K Tons Forecast, by Geography 2019 & 2032
- Table 11: East Africa Midstream Industry Revenue Million Forecast, by Region 2019 & 2032
- Table 12: East Africa Midstream Industry Volume K Tons Forecast, by Region 2019 & 2032
- Table 13: East Africa Midstream Industry Revenue Million Forecast, by Country 2019 & 2032
- Table 14: East Africa Midstream Industry Volume K Tons Forecast, by Country 2019 & 2032
- Table 15: South Africa East Africa Midstream Industry Revenue (Million) Forecast, by Application 2019 & 2032
- Table 16: South Africa East Africa Midstream Industry Volume (K Tons) Forecast, by Application 2019 & 2032
- Table 17: Sudan East Africa Midstream Industry Revenue (Million) Forecast, by Application 2019 & 2032
- Table 18: Sudan East Africa Midstream Industry Volume (K Tons) Forecast, by Application 2019 & 2032
- Table 19: Uganda East Africa Midstream Industry Revenue (Million) Forecast, by Application 2019 & 2032
- Table 20: Uganda East Africa Midstream Industry Volume (K Tons) Forecast, by Application 2019 & 2032
- Table 21: Tanzania East Africa Midstream Industry Revenue (Million) Forecast, by Application 2019 & 2032
- Table 22: Tanzania East Africa Midstream Industry Volume (K Tons) Forecast, by Application 2019 & 2032
- Table 23: Kenya East Africa Midstream Industry Revenue (Million) Forecast, by Application 2019 & 2032
- Table 24: Kenya East Africa Midstream Industry Volume (K Tons) Forecast, by Application 2019 & 2032
- Table 25: Rest of Africa East Africa Midstream Industry Revenue (Million) Forecast, by Application 2019 & 2032
- Table 26: Rest of Africa East Africa Midstream Industry Volume (K Tons) Forecast, by Application 2019 & 2032
- Table 27: East Africa Midstream Industry Revenue Million Forecast, by Transportation 2019 & 2032
- Table 28: East Africa Midstream Industry Volume K Tons Forecast, by Transportation 2019 & 2032
- Table 29: East Africa Midstream Industry Revenue Million Forecast, by Storage 2019 & 2032
- Table 30: East Africa Midstream Industry Volume K Tons Forecast, by Storage 2019 & 2032
- Table 31: East Africa Midstream Industry Revenue Million Forecast, by LNG Terminals 2019 & 2032
- Table 32: East Africa Midstream Industry Volume K Tons Forecast, by LNG Terminals 2019 & 2032
- Table 33: East Africa Midstream Industry Revenue Million Forecast, by Geography 2019 & 2032
- Table 34: East Africa Midstream Industry Volume K Tons Forecast, by Geography 2019 & 2032
- Table 35: East Africa Midstream Industry Revenue Million Forecast, by Country 2019 & 2032
- Table 36: East Africa Midstream Industry Volume K Tons Forecast, by Country 2019 & 2032
- Table 37: East Africa Midstream Industry Revenue Million Forecast, by Transportation 2019 & 2032
- Table 38: East Africa Midstream Industry Volume K Tons Forecast, by Transportation 2019 & 2032
- Table 39: East Africa Midstream Industry Revenue Million Forecast, by Storage 2019 & 2032
- Table 40: East Africa Midstream Industry Volume K Tons Forecast, by Storage 2019 & 2032
- Table 41: East Africa Midstream Industry Revenue Million Forecast, by LNG Terminals 2019 & 2032
- Table 42: East Africa Midstream Industry Volume K Tons Forecast, by LNG Terminals 2019 & 2032
- Table 43: East Africa Midstream Industry Revenue Million Forecast, by Geography 2019 & 2032
- Table 44: East Africa Midstream Industry Volume K Tons Forecast, by Geography 2019 & 2032
- Table 45: East Africa Midstream Industry Revenue Million Forecast, by Country 2019 & 2032
- Table 46: East Africa Midstream Industry Volume K Tons Forecast, by Country 2019 & 2032
- Table 47: East Africa Midstream Industry Revenue Million Forecast, by Transportation 2019 & 2032
- Table 48: East Africa Midstream Industry Volume K Tons Forecast, by Transportation 2019 & 2032
- Table 49: East Africa Midstream Industry Revenue Million Forecast, by Storage 2019 & 2032
- Table 50: East Africa Midstream Industry Volume K Tons Forecast, by Storage 2019 & 2032
- Table 51: East Africa Midstream Industry Revenue Million Forecast, by LNG Terminals 2019 & 2032
- Table 52: East Africa Midstream Industry Volume K Tons Forecast, by LNG Terminals 2019 & 2032
- Table 53: East Africa Midstream Industry Revenue Million Forecast, by Geography 2019 & 2032
- Table 54: East Africa Midstream Industry Volume K Tons Forecast, by Geography 2019 & 2032
- Table 55: East Africa Midstream Industry Revenue Million Forecast, by Country 2019 & 2032
- Table 56: East Africa Midstream Industry Volume K Tons Forecast, by Country 2019 & 2032
- Table 57: East Africa Midstream Industry Revenue Million Forecast, by Transportation 2019 & 2032
- Table 58: East Africa Midstream Industry Volume K Tons Forecast, by Transportation 2019 & 2032
- Table 59: East Africa Midstream Industry Revenue Million Forecast, by Storage 2019 & 2032
- Table 60: East Africa Midstream Industry Volume K Tons Forecast, by Storage 2019 & 2032
- Table 61: East Africa Midstream Industry Revenue Million Forecast, by LNG Terminals 2019 & 2032
- Table 62: East Africa Midstream Industry Volume K Tons Forecast, by LNG Terminals 2019 & 2032
- Table 63: East Africa Midstream Industry Revenue Million Forecast, by Geography 2019 & 2032
- Table 64: East Africa Midstream Industry Volume K Tons Forecast, by Geography 2019 & 2032
- Table 65: East Africa Midstream Industry Revenue Million Forecast, by Country 2019 & 2032
- Table 66: East Africa Midstream Industry Volume K Tons Forecast, by Country 2019 & 2032
Frequently Asked Questions
1. What is the projected Compound Annual Growth Rate (CAGR) of the East Africa Midstream Industry?
The projected CAGR is approximately > 5.00%.
2. Which companies are prominent players in the East Africa Midstream Industry?
Key companies in the market include Tullow Oil, Oil and Natural Gas Corporation, China National Petroleum Corporation, Kenya Pipeline Company Ltd, Petróleos de Moçambique SA, Total S A, Eni S p A *List Not Exhaustive, TotalEnergies , Tanzania Petroleum Development Corporation (TPDC) , Uganda National Oil Company (UNOC).
3. What are the main segments of the East Africa Midstream Industry?
The market segments include Transportation, Storage, LNG Terminals, Geography.
4. Can you provide details about the market size?
The market size is estimated to be USD XX Million as of 2022.
5. What are some drivers contributing to market growth?
4.; Increasing Electricity Demand4.; Rsing Investments in the Coal Industry.
6. What are the notable trends driving market growth?
Transportation Sector to Witness Growth.
7. Are there any restraints impacting market growth?
4.; Increasing Installation of Renewable Energy Sources.
8. Can you provide examples of recent developments in the market?
The development of the East Africa Crude Oil Pipeline
9. What pricing options are available for accessing the report?
Pricing options include single-user, multi-user, and enterprise licenses priced at USD 4750, USD 5250, and USD 8750 respectively.
10. Is the market size provided in terms of value or volume?
The market size is provided in terms of value, measured in Million and volume, measured in K Tons.
11. Are there any specific market keywords associated with the report?
Yes, the market keyword associated with the report is "East Africa Midstream Industry," which aids in identifying and referencing the specific market segment covered.
12. How do I determine which pricing option suits my needs best?
The pricing options vary based on user requirements and access needs. Individual users may opt for single-user licenses, while businesses requiring broader access may choose multi-user or enterprise licenses for cost-effective access to the report.
13. Are there any additional resources or data provided in the East Africa Midstream Industry report?
While the report offers comprehensive insights, it's advisable to review the specific contents or supplementary materials provided to ascertain if additional resources or data are available.
14. How can I stay updated on further developments or reports in the East Africa Midstream Industry?
To stay informed about further developments, trends, and reports in the East Africa Midstream Industry, consider subscribing to industry newsletters, following relevant companies and organizations, or regularly checking reputable industry news sources and publications.
Methodology
Step 1 - Identification of Relevant Samples Size from Population Database


Step 2 - Approaches for Defining Global Market Size (Value, Volume* & Price*)

Note*: In applicable scenarios
Step 3 - Data Sources
Primary Research
- Web Analytics
- Survey Reports
- Research Institute
- Latest Research Reports
- Opinion Leaders
Secondary Research
- Annual Reports
- White Paper
- Latest Press Release
- Industry Association
- Paid Database
- Investor Presentations

Step 4 - Data Triangulation
Involves using different sources of information in order to increase the validity of a study
These sources are likely to be stakeholders in a program - participants, other researchers, program staff, other community members, and so on.
Then we put all data in single framework & apply various statistical tools to find out the dynamic on the market.
During the analysis stage, feedback from the stakeholder groups would be compared to determine areas of agreement as well as areas of divergence


