
Key Insights
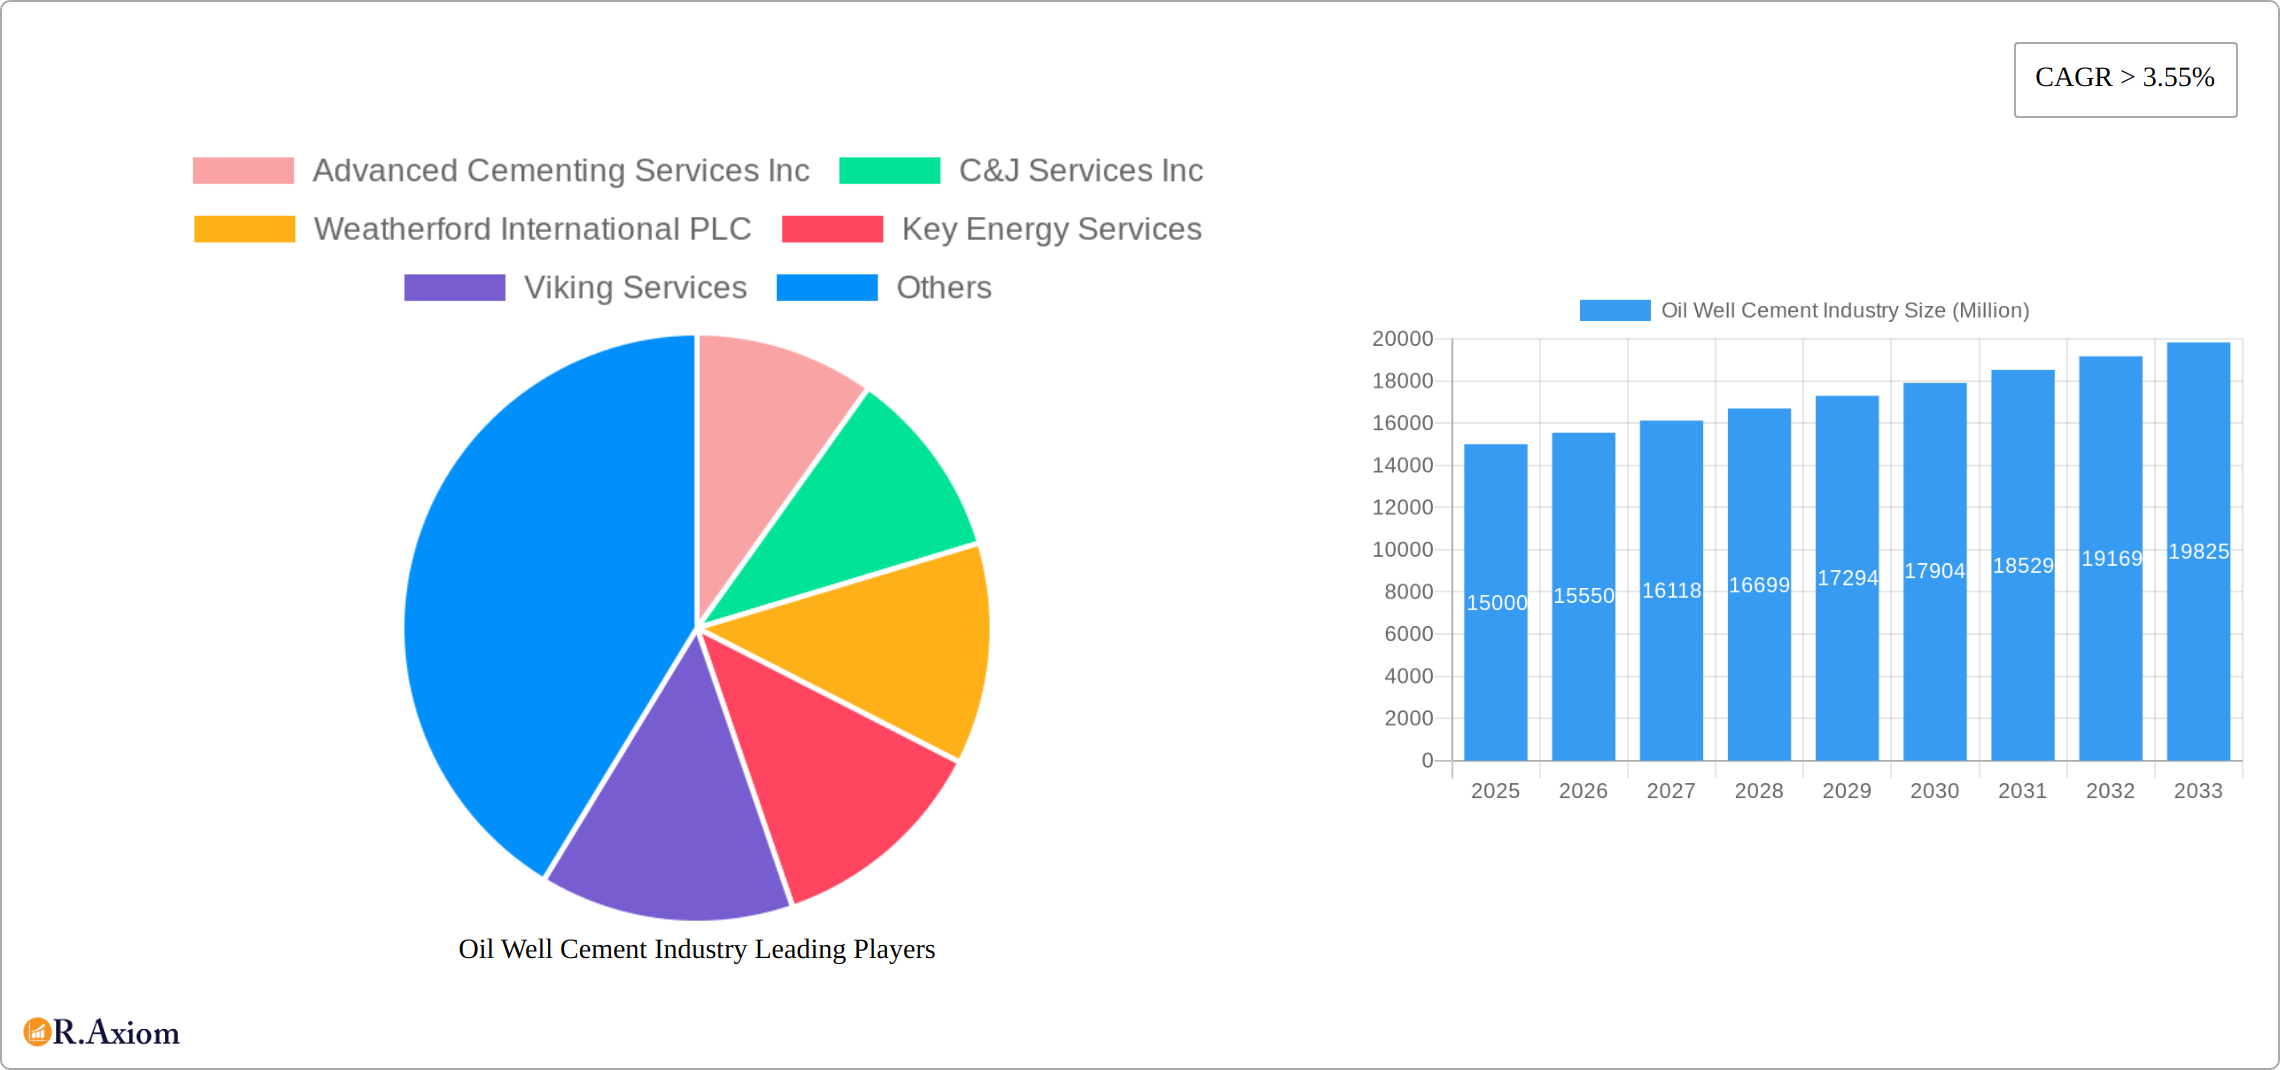
The global oil well cement market, currently valued at approximately $XX million (estimated based on available CAGR and market trends), is projected to experience robust growth, exceeding a compound annual growth rate (CAGR) of 3.55% from 2025 to 2033. This expansion is driven by several key factors. Firstly, the increasing global demand for energy fuels continued exploration and production activities in the oil and gas industry, necessitating substantial cement usage for well construction and completion. Secondly, advancements in cement technology, focusing on high-performance and environmentally friendly solutions, are enhancing efficiency and reducing operational costs, thereby stimulating market growth. Finally, the ongoing exploration and development of unconventional resources, such as shale gas and tight oil, further augment the demand for specialized cementing solutions.
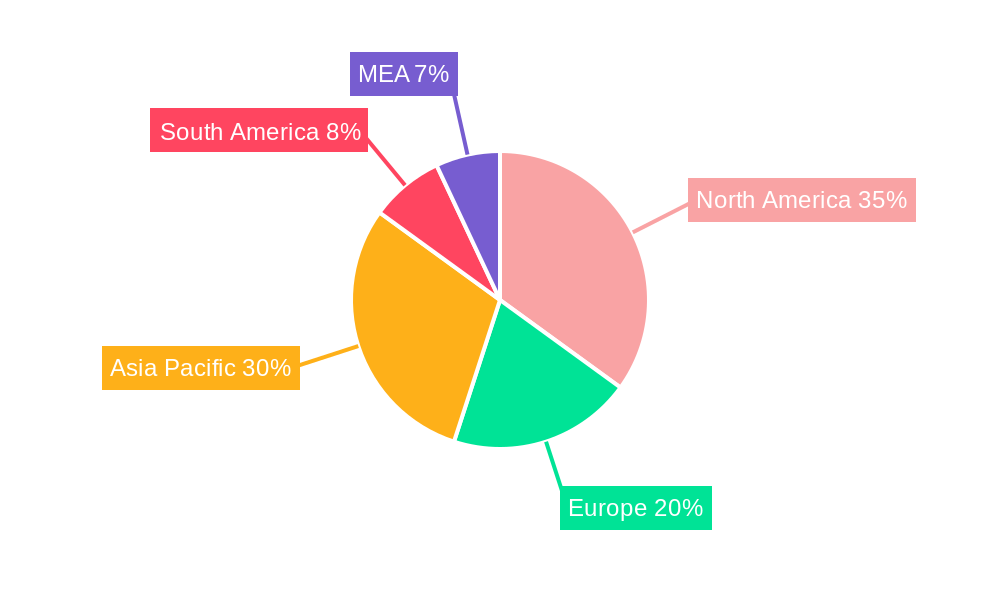
However, market growth is not without its challenges. Fluctuations in oil prices significantly impact investment decisions in exploration and production, creating uncertainty in the market. Moreover, stringent environmental regulations regarding cement production and disposal pose constraints on industry expansion. The market segmentation reveals significant opportunities in both onshore and offshore deployments, with primary cementing holding a larger market share than remedial applications. Key players like Halliburton, Schlumberger, and Baker Hughes dominate the market through their comprehensive service offerings and global presence. Regional analysis suggests North America and the Asia-Pacific region will continue to be major contributors to market growth, driven by robust exploration activities and infrastructure development in these regions. The forecast period (2025-2033) presents significant potential for growth, provided that oil prices remain relatively stable and technological advancements continue to enhance efficiency and sustainability within the oil well cement industry.
Oil Well Cement Industry: A Comprehensive Market Report (2019-2033)
This comprehensive report provides an in-depth analysis of the global oil well cement industry, offering valuable insights for stakeholders, investors, and industry professionals. Covering the period from 2019 to 2033, with a focus on 2025, this report meticulously examines market dynamics, competitive landscapes, and future growth prospects. The report uses millions (M) for all values.
Oil Well Cement Industry Market Concentration & Innovation
This section analyzes the competitive landscape of the oil well cement industry, focusing on market concentration, innovation drivers, regulatory frameworks, product substitutes, end-user trends, and M&A activities. The market is characterized by the presence of several major players, including but not limited to: Advanced Cementing Services Inc, C&J Services Inc, Weatherford International PLC, Key Energy Services, Viking Services, Baker Hughes Company, China Oilfield Services Limited, Halliburton Company, BJ Services Company, Schlumberger Limited, Superior Oilfield Services Inc, Sanjel Energy Services, Calfrac Well Services Ltd, and Trican Well Services Corporation. The industry exhibits moderate concentration, with the top five players holding an estimated xx% market share in 2025.
- Market Share: The top 5 players hold approximately xx% of the global market share (2025 estimate).
- Innovation Drivers: Demand for high-performance, environmentally friendly cement systems, advancements in material science, and the need for improved well integrity are key innovation drivers.
- Regulatory Framework: Stringent environmental regulations and safety standards significantly influence industry practices and product development.
- Product Substitutes: Limited viable substitutes exist for oil well cement, but ongoing research into alternative materials presents a potential long-term threat.
- End-User Trends: Increased focus on efficiency and cost reduction by oil and gas companies shapes the demand for innovative cementing solutions.
- M&A Activities: Consolidation in the sector has been moderate in recent years with a total estimated value of xx M USD in M&A deals between 2019 and 2024. Further consolidation is anticipated, driven by the desire to achieve economies of scale and expand service offerings.
Oil Well Cement Industry Industry Trends & Insights
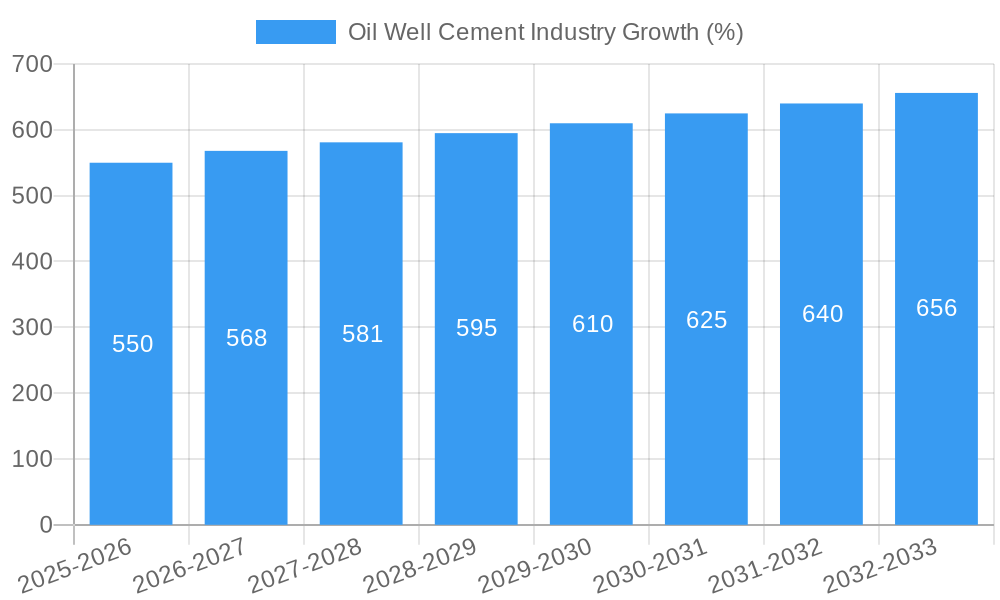
The oil well cement market is experiencing substantial growth, driven by factors such as increasing global energy demand, rising oil and gas exploration and production activities, and the ongoing development of new technologies. The Compound Annual Growth Rate (CAGR) is projected to be xx% during the forecast period (2025-2033), with market penetration projected to reach xx% by 2033. Technological advancements, particularly in the area of reduced Portland cement systems and enhanced barrier reliability, are reshaping the industry landscape. Consumer preferences are shifting towards environmentally sustainable products and optimized well construction solutions. Competitive dynamics remain intense, with companies focusing on technological innovation, service quality improvement, and strategic partnerships to gain a market edge. The industry faces significant challenges including fluctuating oil prices, environmental regulations, and the need for continuous technological advancement to meet evolving market requirements.
Dominant Markets & Segments in Oil Well Cement Industry
The onshore segment dominates the oil well cement market, driven by the higher concentration of oil and gas wells compared to offshore locations. The primary cementing segment also holds a significant share of the market due to its crucial role in well construction.
Leading Regions/Countries:
- North America: High oil and gas production activities drive strong demand in this region.
- Middle East: Significant investments in oil and gas exploration and production projects fuel market expansion.
Dominant Segments:
- Location of Deployment: Onshore (xx M USD in 2025), Offshore (xx M USD in 2025)
- Type: Primary (xx M USD in 2025), Remedial (xx M USD in 2025), Other Types (xx M USD in 2025)
Key Drivers:
- Onshore: Established infrastructure, ease of access, and cost-effectiveness contribute to this segment's dominance.
- Offshore: Technological advancements are driving growth despite higher operational complexities and costs.
- Primary Cementing: Essential for well construction, this segment is closely linked to overall oil and gas production.
- Remedial Cementing: Increasing demand for well integrity solutions boosts growth in this segment.
Oil Well Cement Industry Product Developments
The oil well cement industry is experiencing a surge in innovation, driven by the dual imperative of enhancing performance and minimizing environmental impact. The focus is shifting towards high-performance, low-Portland cement systems that deliver superior strength, improved ductility, enhanced barrier reliability, and reduced density. This trend is fueled by escalating environmental concerns and the pressing need for more cost-effective and efficient cementing solutions. For example, Halliburton's launch of NeoCem E+ and EnviraCem systems in November 2022 exemplifies this shift, showcasing high-performance alternatives with a significantly reduced environmental footprint. These advancements are directly addressing crucial market demands for superior well integrity and sustainable practices. Further innovations include the development of novel cement additives that optimize rheological properties, leading to improved placement and reduced cement consumption. Research into alternative cementitious materials, such as geopolymers and metakaolin-based cements, is also gaining momentum, offering potential for even greater sustainability gains.
Report Scope & Segmentation Analysis
This report segments the oil well cement market based on Location of Deployment (Onshore and Offshore) and Type (Primary, Remedial, and Other Types). Each segment's market size, growth projections, and competitive dynamics are analyzed. The onshore segment is currently dominant due to higher activity levels, but offshore is projected to show faster growth rates due to ongoing investments and technological improvements. Similarly, primary cementing holds the largest market share, but the remedial segment is experiencing significant growth driven by increasing demand for well integrity solutions.
Key Drivers of Oil Well Cement Industry Growth
Several key factors are propelling the growth of the oil well cement market:
- Unwavering Global Energy Demand: The persistent global need for energy continues to drive exploration and production activities in the oil and gas sector, fueling demand for robust well cementing solutions.
- Technological Advancements: Continuous innovation in cement formulations, application techniques (such as advanced placement methods and monitoring technologies), and the development of specialized cements for specific well conditions are key contributors to market growth.
- Government Support and Policies: Government incentives and policies aimed at supporting oil and gas exploration, infrastructure development, and energy security contribute significantly to market expansion.
- Growth in Enhanced Oil Recovery (EOR) Techniques: The increased adoption of EOR methods necessitates high-performance cementing solutions capable of withstanding harsh downhole conditions and ensuring long-term well integrity.
- Focus on Wellbore Integrity: Stringent regulations and a heightened emphasis on preventing wellbore failures are driving the demand for premium cementing solutions that ensure secure and long-lasting well integrity.
Challenges in the Oil Well Cement Industry Sector
The industry faces several challenges:
- Fluctuating oil prices: Directly impact exploration and production investments.
- Environmental regulations: Stricter standards influence product development and operational practices.
- Supply chain disruptions: Impact the availability of raw materials and equipment.
- Intense competition: Requires continuous innovation and cost optimization.
Emerging Opportunities in Oil Well Cement Industry
Significant opportunities are emerging within the oil well cement industry, including:
- Sustainable Cement Formulations: The growing focus on environmental sustainability is driving the development and adoption of eco-friendly cement formulations with reduced carbon footprints.
- Advanced Cementing Technologies: Innovations in cementing technologies, such as real-time monitoring systems and automated placement techniques, are enhancing efficiency and well integrity.
- Growth in Unconventional Oil and Gas Resources: The exploration and production of unconventional resources, such as shale gas and tight oil, are creating significant demand for specialized cementing solutions.
- Expansion into Emerging Markets: Developing economies present significant growth potential for oil well cement manufacturers and service providers.
- Data Analytics and Digitalization: The integration of data analytics and digital technologies is optimizing cementing operations, improving efficiency, and reducing costs.
Leading Players in the Oil Well Cement Industry Market
- Advanced Cementing Services Inc
- C&J Services Inc
- Weatherford International PLC
- Key Energy Services
- Viking Services
- Baker Hughes Company
- China Oilfield Services Limited
- Halliburton Company
- BJ Services Company
- Schlumberger Limited
- Superior Oilfield Services Inc
- Sanjel Energy Services
- Calfrac Well Services Ltd
- Trican Well Services Corporation
Key Developments in Oil Well Cement Industry Industry
- November 2022: Halliburton introduced NeoCem E+ and EnviraCem cement barrier systems, showcasing innovation in high-performance, reduced Portland cement systems. This development enhances market competitiveness and addresses environmental concerns.
- March 2022: ADNOC signed USD 658 M worth of framework agreements for cementing, highlighting significant investment and growth in the Middle East market. This significantly boosts market demand and creates new opportunities for service providers.
Strategic Outlook for Oil Well Cement Industry Market
The oil well cement market is projected to experience continued growth, fueled by sustained global energy demand, ongoing advancements in cementing technologies, and rising investments in oil and gas exploration and production. Companies that prioritize innovation, operational efficiency, and sustainable practices will be best positioned to capitalize on future growth opportunities. A key focus will be on developing and deploying environmentally friendly solutions while simultaneously enhancing well integrity and operational performance. The strategic adoption of digital technologies and data-driven decision-making will also play a vital role in shaping the future of the industry.
Oil Well Cement Industry Segmentation
-
1. Location of Deployment
- 1.1. Onshore
- 1.2. Offshore
-
2. Type
- 2.1. Primary
- 2.2. Remedial
- 2.3. Other Types
Oil Well Cement Industry Segmentation By Geography
- 1. North America
- 2. Asia Pacific
- 3. Europe
- 4. South America
- 5. Middle East
Oil Well Cement Industry REPORT HIGHLIGHTS
| Aspects | Details |
|---|---|
| Study Period | 2019-2033 |
| Base Year | 2024 |
| Estimated Year | 2025 |
| Forecast Period | 2025-2033 |
| Historical Period | 2019-2024 |
| Growth Rate | CAGR of > 3.55% from 2019-2033 |
| Segmentation |
|
Table of Contents
- 1. Introduction
- 1.1. Research Scope
- 1.2. Market Segmentation
- 1.3. Research Methodology
- 1.4. Definitions and Assumptions
- 2. Executive Summary
- 2.1. Introduction
- 3. Market Dynamics
- 3.1. Introduction
- 3.2. Market Drivers
- 3.2.1. 4.; Increasing Energy Demand4.; Government Support for Power Sector
- 3.3. Market Restrains
- 3.3.1. 4.; Financial Viability
- 3.4. Market Trends
- 3.4.1. Onshore Segment to Dominate the Market
- 4. Market Factor Analysis
- 4.1. Porters Five Forces
- 4.2. Supply/Value Chain
- 4.3. PESTEL analysis
- 4.4. Market Entropy
- 4.5. Patent/Trademark Analysis
- 5. Global Oil Well Cement Industry Analysis, Insights and Forecast, 2019-2031
- 5.1. Market Analysis, Insights and Forecast - by Location of Deployment
- 5.1.1. Onshore
- 5.1.2. Offshore
- 5.2. Market Analysis, Insights and Forecast - by Type
- 5.2.1. Primary
- 5.2.2. Remedial
- 5.2.3. Other Types
- 5.3. Market Analysis, Insights and Forecast - by Region
- 5.3.1. North America
- 5.3.2. Asia Pacific
- 5.3.3. Europe
- 5.3.4. South America
- 5.3.5. Middle East
- 5.1. Market Analysis, Insights and Forecast - by Location of Deployment
- 6. North America Oil Well Cement Industry Analysis, Insights and Forecast, 2019-2031
- 6.1. Market Analysis, Insights and Forecast - by Location of Deployment
- 6.1.1. Onshore
- 6.1.2. Offshore
- 6.2. Market Analysis, Insights and Forecast - by Type
- 6.2.1. Primary
- 6.2.2. Remedial
- 6.2.3. Other Types
- 6.1. Market Analysis, Insights and Forecast - by Location of Deployment
- 7. Asia Pacific Oil Well Cement Industry Analysis, Insights and Forecast, 2019-2031
- 7.1. Market Analysis, Insights and Forecast - by Location of Deployment
- 7.1.1. Onshore
- 7.1.2. Offshore
- 7.2. Market Analysis, Insights and Forecast - by Type
- 7.2.1. Primary
- 7.2.2. Remedial
- 7.2.3. Other Types
- 7.1. Market Analysis, Insights and Forecast - by Location of Deployment
- 8. Europe Oil Well Cement Industry Analysis, Insights and Forecast, 2019-2031
- 8.1. Market Analysis, Insights and Forecast - by Location of Deployment
- 8.1.1. Onshore
- 8.1.2. Offshore
- 8.2. Market Analysis, Insights and Forecast - by Type
- 8.2.1. Primary
- 8.2.2. Remedial
- 8.2.3. Other Types
- 8.1. Market Analysis, Insights and Forecast - by Location of Deployment
- 9. South America Oil Well Cement Industry Analysis, Insights and Forecast, 2019-2031
- 9.1. Market Analysis, Insights and Forecast - by Location of Deployment
- 9.1.1. Onshore
- 9.1.2. Offshore
- 9.2. Market Analysis, Insights and Forecast - by Type
- 9.2.1. Primary
- 9.2.2. Remedial
- 9.2.3. Other Types
- 9.1. Market Analysis, Insights and Forecast - by Location of Deployment
- 10. Middle East Oil Well Cement Industry Analysis, Insights and Forecast, 2019-2031
- 10.1. Market Analysis, Insights and Forecast - by Location of Deployment
- 10.1.1. Onshore
- 10.1.2. Offshore
- 10.2. Market Analysis, Insights and Forecast - by Type
- 10.2.1. Primary
- 10.2.2. Remedial
- 10.2.3. Other Types
- 10.1. Market Analysis, Insights and Forecast - by Location of Deployment
- 11. North America Oil Well Cement Industry Analysis, Insights and Forecast, 2019-2031
- 11.1. Market Analysis, Insights and Forecast - By Country/Sub-region
- 11.1.1 United States
- 11.1.2 Canada
- 11.1.3 Mexico
- 12. Europe Oil Well Cement Industry Analysis, Insights and Forecast, 2019-2031
- 12.1. Market Analysis, Insights and Forecast - By Country/Sub-region
- 12.1.1 Germany
- 12.1.2 United Kingdom
- 12.1.3 France
- 12.1.4 Spain
- 12.1.5 Italy
- 12.1.6 Spain
- 12.1.7 Belgium
- 12.1.8 Netherland
- 12.1.9 Nordics
- 12.1.10 Rest of Europe
- 13. Asia Pacific Oil Well Cement Industry Analysis, Insights and Forecast, 2019-2031
- 13.1. Market Analysis, Insights and Forecast - By Country/Sub-region
- 13.1.1 China
- 13.1.2 Japan
- 13.1.3 India
- 13.1.4 South Korea
- 13.1.5 Southeast Asia
- 13.1.6 Australia
- 13.1.7 Indonesia
- 13.1.8 Phillipes
- 13.1.9 Singapore
- 13.1.10 Thailandc
- 13.1.11 Rest of Asia Pacific
- 14. South America Oil Well Cement Industry Analysis, Insights and Forecast, 2019-2031
- 14.1. Market Analysis, Insights and Forecast - By Country/Sub-region
- 14.1.1 Brazil
- 14.1.2 Argentina
- 14.1.3 Peru
- 14.1.4 Chile
- 14.1.5 Colombia
- 14.1.6 Ecuador
- 14.1.7 Venezuela
- 14.1.8 Rest of South America
- 15. North America Oil Well Cement Industry Analysis, Insights and Forecast, 2019-2031
- 15.1. Market Analysis, Insights and Forecast - By Country/Sub-region
- 15.1.1 United States
- 15.1.2 Canada
- 15.1.3 Mexico
- 16. MEA Oil Well Cement Industry Analysis, Insights and Forecast, 2019-2031
- 16.1. Market Analysis, Insights and Forecast - By Country/Sub-region
- 16.1.1 United Arab Emirates
- 16.1.2 Saudi Arabia
- 16.1.3 South Africa
- 16.1.4 Rest of Middle East and Africa
- 17. Competitive Analysis
- 17.1. Global Market Share Analysis 2024
- 17.2. Company Profiles
- 17.2.1 Advanced Cementing Services Inc
- 17.2.1.1. Overview
- 17.2.1.2. Products
- 17.2.1.3. SWOT Analysis
- 17.2.1.4. Recent Developments
- 17.2.1.5. Financials (Based on Availability)
- 17.2.2 C&J Services Inc
- 17.2.2.1. Overview
- 17.2.2.2. Products
- 17.2.2.3. SWOT Analysis
- 17.2.2.4. Recent Developments
- 17.2.2.5. Financials (Based on Availability)
- 17.2.3 Weatherford International PLC
- 17.2.3.1. Overview
- 17.2.3.2. Products
- 17.2.3.3. SWOT Analysis
- 17.2.3.4. Recent Developments
- 17.2.3.5. Financials (Based on Availability)
- 17.2.4 Key Energy Services
- 17.2.4.1. Overview
- 17.2.4.2. Products
- 17.2.4.3. SWOT Analysis
- 17.2.4.4. Recent Developments
- 17.2.4.5. Financials (Based on Availability)
- 17.2.5 Viking Services
- 17.2.5.1. Overview
- 17.2.5.2. Products
- 17.2.5.3. SWOT Analysis
- 17.2.5.4. Recent Developments
- 17.2.5.5. Financials (Based on Availability)
- 17.2.6 Baker Hughes Company
- 17.2.6.1. Overview
- 17.2.6.2. Products
- 17.2.6.3. SWOT Analysis
- 17.2.6.4. Recent Developments
- 17.2.6.5. Financials (Based on Availability)
- 17.2.7 China Oilfield Services Limited
- 17.2.7.1. Overview
- 17.2.7.2. Products
- 17.2.7.3. SWOT Analysis
- 17.2.7.4. Recent Developments
- 17.2.7.5. Financials (Based on Availability)
- 17.2.8 Halliburton Company
- 17.2.8.1. Overview
- 17.2.8.2. Products
- 17.2.8.3. SWOT Analysis
- 17.2.8.4. Recent Developments
- 17.2.8.5. Financials (Based on Availability)
- 17.2.9 BJ Services Company
- 17.2.9.1. Overview
- 17.2.9.2. Products
- 17.2.9.3. SWOT Analysis
- 17.2.9.4. Recent Developments
- 17.2.9.5. Financials (Based on Availability)
- 17.2.10 Schlumberger Limited
- 17.2.10.1. Overview
- 17.2.10.2. Products
- 17.2.10.3. SWOT Analysis
- 17.2.10.4. Recent Developments
- 17.2.10.5. Financials (Based on Availability)
- 17.2.11 Superior Oilfield Services Inc
- 17.2.11.1. Overview
- 17.2.11.2. Products
- 17.2.11.3. SWOT Analysis
- 17.2.11.4. Recent Developments
- 17.2.11.5. Financials (Based on Availability)
- 17.2.12 Sanjel Energy Services*List Not Exhaustive
- 17.2.12.1. Overview
- 17.2.12.2. Products
- 17.2.12.3. SWOT Analysis
- 17.2.12.4. Recent Developments
- 17.2.12.5. Financials (Based on Availability)
- 17.2.13 Calfrac Well Services Ltd
- 17.2.13.1. Overview
- 17.2.13.2. Products
- 17.2.13.3. SWOT Analysis
- 17.2.13.4. Recent Developments
- 17.2.13.5. Financials (Based on Availability)
- 17.2.14 Trican Well Services Corporation
- 17.2.14.1. Overview
- 17.2.14.2. Products
- 17.2.14.3. SWOT Analysis
- 17.2.14.4. Recent Developments
- 17.2.14.5. Financials (Based on Availability)
- 17.2.1 Advanced Cementing Services Inc
List of Figures
- Figure 1: Global Oil Well Cement Industry Revenue Breakdown (Million, %) by Region 2024 & 2032
- Figure 2: North America Oil Well Cement Industry Revenue (Million), by Country 2024 & 2032
- Figure 3: North America Oil Well Cement Industry Revenue Share (%), by Country 2024 & 2032
- Figure 4: Europe Oil Well Cement Industry Revenue (Million), by Country 2024 & 2032
- Figure 5: Europe Oil Well Cement Industry Revenue Share (%), by Country 2024 & 2032
- Figure 6: Asia Pacific Oil Well Cement Industry Revenue (Million), by Country 2024 & 2032
- Figure 7: Asia Pacific Oil Well Cement Industry Revenue Share (%), by Country 2024 & 2032
- Figure 8: South America Oil Well Cement Industry Revenue (Million), by Country 2024 & 2032
- Figure 9: South America Oil Well Cement Industry Revenue Share (%), by Country 2024 & 2032
- Figure 10: North America Oil Well Cement Industry Revenue (Million), by Country 2024 & 2032
- Figure 11: North America Oil Well Cement Industry Revenue Share (%), by Country 2024 & 2032
- Figure 12: MEA Oil Well Cement Industry Revenue (Million), by Country 2024 & 2032
- Figure 13: MEA Oil Well Cement Industry Revenue Share (%), by Country 2024 & 2032
- Figure 14: North America Oil Well Cement Industry Revenue (Million), by Location of Deployment 2024 & 2032
- Figure 15: North America Oil Well Cement Industry Revenue Share (%), by Location of Deployment 2024 & 2032
- Figure 16: North America Oil Well Cement Industry Revenue (Million), by Type 2024 & 2032
- Figure 17: North America Oil Well Cement Industry Revenue Share (%), by Type 2024 & 2032
- Figure 18: North America Oil Well Cement Industry Revenue (Million), by Country 2024 & 2032
- Figure 19: North America Oil Well Cement Industry Revenue Share (%), by Country 2024 & 2032
- Figure 20: Asia Pacific Oil Well Cement Industry Revenue (Million), by Location of Deployment 2024 & 2032
- Figure 21: Asia Pacific Oil Well Cement Industry Revenue Share (%), by Location of Deployment 2024 & 2032
- Figure 22: Asia Pacific Oil Well Cement Industry Revenue (Million), by Type 2024 & 2032
- Figure 23: Asia Pacific Oil Well Cement Industry Revenue Share (%), by Type 2024 & 2032
- Figure 24: Asia Pacific Oil Well Cement Industry Revenue (Million), by Country 2024 & 2032
- Figure 25: Asia Pacific Oil Well Cement Industry Revenue Share (%), by Country 2024 & 2032
- Figure 26: Europe Oil Well Cement Industry Revenue (Million), by Location of Deployment 2024 & 2032
- Figure 27: Europe Oil Well Cement Industry Revenue Share (%), by Location of Deployment 2024 & 2032
- Figure 28: Europe Oil Well Cement Industry Revenue (Million), by Type 2024 & 2032
- Figure 29: Europe Oil Well Cement Industry Revenue Share (%), by Type 2024 & 2032
- Figure 30: Europe Oil Well Cement Industry Revenue (Million), by Country 2024 & 2032
- Figure 31: Europe Oil Well Cement Industry Revenue Share (%), by Country 2024 & 2032
- Figure 32: South America Oil Well Cement Industry Revenue (Million), by Location of Deployment 2024 & 2032
- Figure 33: South America Oil Well Cement Industry Revenue Share (%), by Location of Deployment 2024 & 2032
- Figure 34: South America Oil Well Cement Industry Revenue (Million), by Type 2024 & 2032
- Figure 35: South America Oil Well Cement Industry Revenue Share (%), by Type 2024 & 2032
- Figure 36: South America Oil Well Cement Industry Revenue (Million), by Country 2024 & 2032
- Figure 37: South America Oil Well Cement Industry Revenue Share (%), by Country 2024 & 2032
- Figure 38: Middle East Oil Well Cement Industry Revenue (Million), by Location of Deployment 2024 & 2032
- Figure 39: Middle East Oil Well Cement Industry Revenue Share (%), by Location of Deployment 2024 & 2032
- Figure 40: Middle East Oil Well Cement Industry Revenue (Million), by Type 2024 & 2032
- Figure 41: Middle East Oil Well Cement Industry Revenue Share (%), by Type 2024 & 2032
- Figure 42: Middle East Oil Well Cement Industry Revenue (Million), by Country 2024 & 2032
- Figure 43: Middle East Oil Well Cement Industry Revenue Share (%), by Country 2024 & 2032
List of Tables
- Table 1: Global Oil Well Cement Industry Revenue Million Forecast, by Region 2019 & 2032
- Table 2: Global Oil Well Cement Industry Revenue Million Forecast, by Location of Deployment 2019 & 2032
- Table 3: Global Oil Well Cement Industry Revenue Million Forecast, by Type 2019 & 2032
- Table 4: Global Oil Well Cement Industry Revenue Million Forecast, by Region 2019 & 2032
- Table 5: Global Oil Well Cement Industry Revenue Million Forecast, by Country 2019 & 2032
- Table 6: United States Oil Well Cement Industry Revenue (Million) Forecast, by Application 2019 & 2032
- Table 7: Canada Oil Well Cement Industry Revenue (Million) Forecast, by Application 2019 & 2032
- Table 8: Mexico Oil Well Cement Industry Revenue (Million) Forecast, by Application 2019 & 2032
- Table 9: Global Oil Well Cement Industry Revenue Million Forecast, by Country 2019 & 2032
- Table 10: Germany Oil Well Cement Industry Revenue (Million) Forecast, by Application 2019 & 2032
- Table 11: United Kingdom Oil Well Cement Industry Revenue (Million) Forecast, by Application 2019 & 2032
- Table 12: France Oil Well Cement Industry Revenue (Million) Forecast, by Application 2019 & 2032
- Table 13: Spain Oil Well Cement Industry Revenue (Million) Forecast, by Application 2019 & 2032
- Table 14: Italy Oil Well Cement Industry Revenue (Million) Forecast, by Application 2019 & 2032
- Table 15: Spain Oil Well Cement Industry Revenue (Million) Forecast, by Application 2019 & 2032
- Table 16: Belgium Oil Well Cement Industry Revenue (Million) Forecast, by Application 2019 & 2032
- Table 17: Netherland Oil Well Cement Industry Revenue (Million) Forecast, by Application 2019 & 2032
- Table 18: Nordics Oil Well Cement Industry Revenue (Million) Forecast, by Application 2019 & 2032
- Table 19: Rest of Europe Oil Well Cement Industry Revenue (Million) Forecast, by Application 2019 & 2032
- Table 20: Global Oil Well Cement Industry Revenue Million Forecast, by Country 2019 & 2032
- Table 21: China Oil Well Cement Industry Revenue (Million) Forecast, by Application 2019 & 2032
- Table 22: Japan Oil Well Cement Industry Revenue (Million) Forecast, by Application 2019 & 2032
- Table 23: India Oil Well Cement Industry Revenue (Million) Forecast, by Application 2019 & 2032
- Table 24: South Korea Oil Well Cement Industry Revenue (Million) Forecast, by Application 2019 & 2032
- Table 25: Southeast Asia Oil Well Cement Industry Revenue (Million) Forecast, by Application 2019 & 2032
- Table 26: Australia Oil Well Cement Industry Revenue (Million) Forecast, by Application 2019 & 2032
- Table 27: Indonesia Oil Well Cement Industry Revenue (Million) Forecast, by Application 2019 & 2032
- Table 28: Phillipes Oil Well Cement Industry Revenue (Million) Forecast, by Application 2019 & 2032
- Table 29: Singapore Oil Well Cement Industry Revenue (Million) Forecast, by Application 2019 & 2032
- Table 30: Thailandc Oil Well Cement Industry Revenue (Million) Forecast, by Application 2019 & 2032
- Table 31: Rest of Asia Pacific Oil Well Cement Industry Revenue (Million) Forecast, by Application 2019 & 2032
- Table 32: Global Oil Well Cement Industry Revenue Million Forecast, by Country 2019 & 2032
- Table 33: Brazil Oil Well Cement Industry Revenue (Million) Forecast, by Application 2019 & 2032
- Table 34: Argentina Oil Well Cement Industry Revenue (Million) Forecast, by Application 2019 & 2032
- Table 35: Peru Oil Well Cement Industry Revenue (Million) Forecast, by Application 2019 & 2032
- Table 36: Chile Oil Well Cement Industry Revenue (Million) Forecast, by Application 2019 & 2032
- Table 37: Colombia Oil Well Cement Industry Revenue (Million) Forecast, by Application 2019 & 2032
- Table 38: Ecuador Oil Well Cement Industry Revenue (Million) Forecast, by Application 2019 & 2032
- Table 39: Venezuela Oil Well Cement Industry Revenue (Million) Forecast, by Application 2019 & 2032
- Table 40: Rest of South America Oil Well Cement Industry Revenue (Million) Forecast, by Application 2019 & 2032
- Table 41: Global Oil Well Cement Industry Revenue Million Forecast, by Country 2019 & 2032
- Table 42: United States Oil Well Cement Industry Revenue (Million) Forecast, by Application 2019 & 2032
- Table 43: Canada Oil Well Cement Industry Revenue (Million) Forecast, by Application 2019 & 2032
- Table 44: Mexico Oil Well Cement Industry Revenue (Million) Forecast, by Application 2019 & 2032
- Table 45: Global Oil Well Cement Industry Revenue Million Forecast, by Country 2019 & 2032
- Table 46: United Arab Emirates Oil Well Cement Industry Revenue (Million) Forecast, by Application 2019 & 2032
- Table 47: Saudi Arabia Oil Well Cement Industry Revenue (Million) Forecast, by Application 2019 & 2032
- Table 48: South Africa Oil Well Cement Industry Revenue (Million) Forecast, by Application 2019 & 2032
- Table 49: Rest of Middle East and Africa Oil Well Cement Industry Revenue (Million) Forecast, by Application 2019 & 2032
- Table 50: Global Oil Well Cement Industry Revenue Million Forecast, by Location of Deployment 2019 & 2032
- Table 51: Global Oil Well Cement Industry Revenue Million Forecast, by Type 2019 & 2032
- Table 52: Global Oil Well Cement Industry Revenue Million Forecast, by Country 2019 & 2032
- Table 53: Global Oil Well Cement Industry Revenue Million Forecast, by Location of Deployment 2019 & 2032
- Table 54: Global Oil Well Cement Industry Revenue Million Forecast, by Type 2019 & 2032
- Table 55: Global Oil Well Cement Industry Revenue Million Forecast, by Country 2019 & 2032
- Table 56: Global Oil Well Cement Industry Revenue Million Forecast, by Location of Deployment 2019 & 2032
- Table 57: Global Oil Well Cement Industry Revenue Million Forecast, by Type 2019 & 2032
- Table 58: Global Oil Well Cement Industry Revenue Million Forecast, by Country 2019 & 2032
- Table 59: Global Oil Well Cement Industry Revenue Million Forecast, by Location of Deployment 2019 & 2032
- Table 60: Global Oil Well Cement Industry Revenue Million Forecast, by Type 2019 & 2032
- Table 61: Global Oil Well Cement Industry Revenue Million Forecast, by Country 2019 & 2032
- Table 62: Global Oil Well Cement Industry Revenue Million Forecast, by Location of Deployment 2019 & 2032
- Table 63: Global Oil Well Cement Industry Revenue Million Forecast, by Type 2019 & 2032
- Table 64: Global Oil Well Cement Industry Revenue Million Forecast, by Country 2019 & 2032
Frequently Asked Questions
1. What is the projected Compound Annual Growth Rate (CAGR) of the Oil Well Cement Industry?
The projected CAGR is approximately > 3.55%.
2. Which companies are prominent players in the Oil Well Cement Industry?
Key companies in the market include Advanced Cementing Services Inc, C&J Services Inc, Weatherford International PLC, Key Energy Services, Viking Services, Baker Hughes Company, China Oilfield Services Limited, Halliburton Company, BJ Services Company, Schlumberger Limited, Superior Oilfield Services Inc, Sanjel Energy Services*List Not Exhaustive, Calfrac Well Services Ltd, Trican Well Services Corporation.
3. What are the main segments of the Oil Well Cement Industry?
The market segments include Location of Deployment, Type.
4. Can you provide details about the market size?
The market size is estimated to be USD XX Million as of 2022.
5. What are some drivers contributing to market growth?
4.; Increasing Energy Demand4.; Government Support for Power Sector.
6. What are the notable trends driving market growth?
Onshore Segment to Dominate the Market.
7. Are there any restraints impacting market growth?
4.; Financial Viability.
8. Can you provide examples of recent developments in the market?
November 2022: Halliburton Company introduced NeoCem E+ and EnviraCem cement barrier systems for oil and gas applications as part of its portfolio of high-performance, reduced Portland cement systems. These new systems combine specialized materials with Portland cement to achieve synergies between their chemical and physical properties. These reduced Portland systems were engineered by Halliburton using an innovative tailoring process to deliver high performance, compressive strength, and ductility at a lower density than conventional systems, thus enhancing barrier reliability.
9. What pricing options are available for accessing the report?
Pricing options include single-user, multi-user, and enterprise licenses priced at USD 4750, USD 5250, and USD 8750 respectively.
10. Is the market size provided in terms of value or volume?
The market size is provided in terms of value, measured in Million.
11. Are there any specific market keywords associated with the report?
Yes, the market keyword associated with the report is "Oil Well Cement Industry," which aids in identifying and referencing the specific market segment covered.
12. How do I determine which pricing option suits my needs best?
The pricing options vary based on user requirements and access needs. Individual users may opt for single-user licenses, while businesses requiring broader access may choose multi-user or enterprise licenses for cost-effective access to the report.
13. Are there any additional resources or data provided in the Oil Well Cement Industry report?
While the report offers comprehensive insights, it's advisable to review the specific contents or supplementary materials provided to ascertain if additional resources or data are available.
14. How can I stay updated on further developments or reports in the Oil Well Cement Industry?
To stay informed about further developments, trends, and reports in the Oil Well Cement Industry, consider subscribing to industry newsletters, following relevant companies and organizations, or regularly checking reputable industry news sources and publications.
Methodology
Step 1 - Identification of Relevant Samples Size from Population Database


Step 2 - Approaches for Defining Global Market Size (Value, Volume* & Price*)

Note*: In applicable scenarios
Step 3 - Data Sources
Primary Research
- Web Analytics
- Survey Reports
- Research Institute
- Latest Research Reports
- Opinion Leaders
Secondary Research
- Annual Reports
- White Paper
- Latest Press Release
- Industry Association
- Paid Database
- Investor Presentations

Step 4 - Data Triangulation
Involves using different sources of information in order to increase the validity of a study
These sources are likely to be stakeholders in a program - participants, other researchers, program staff, other community members, and so on.
Then we put all data in single framework & apply various statistical tools to find out the dynamic on the market.
During the analysis stage, feedback from the stakeholder groups would be compared to determine areas of agreement as well as areas of divergence


