
Key Insights
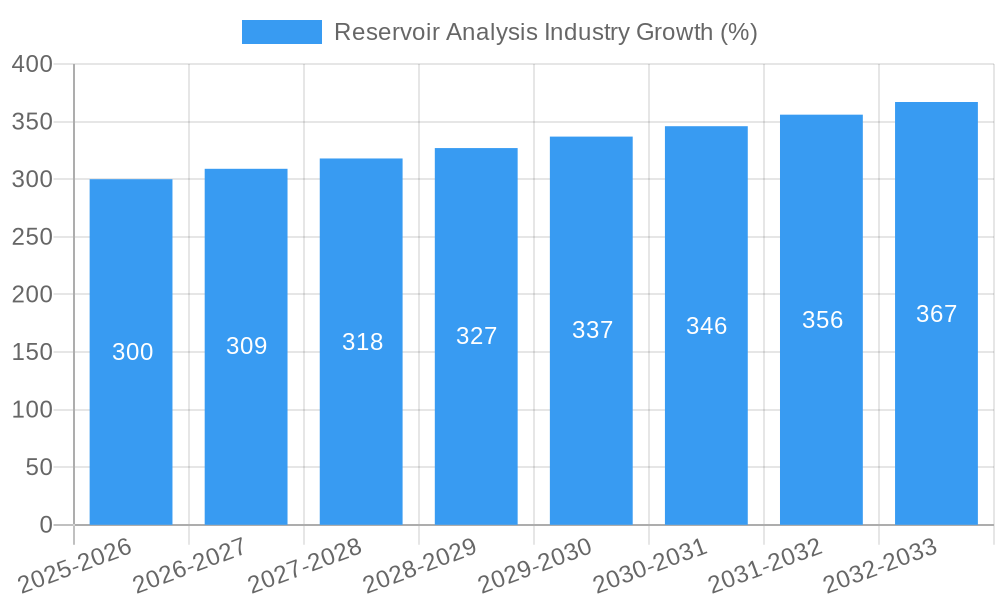
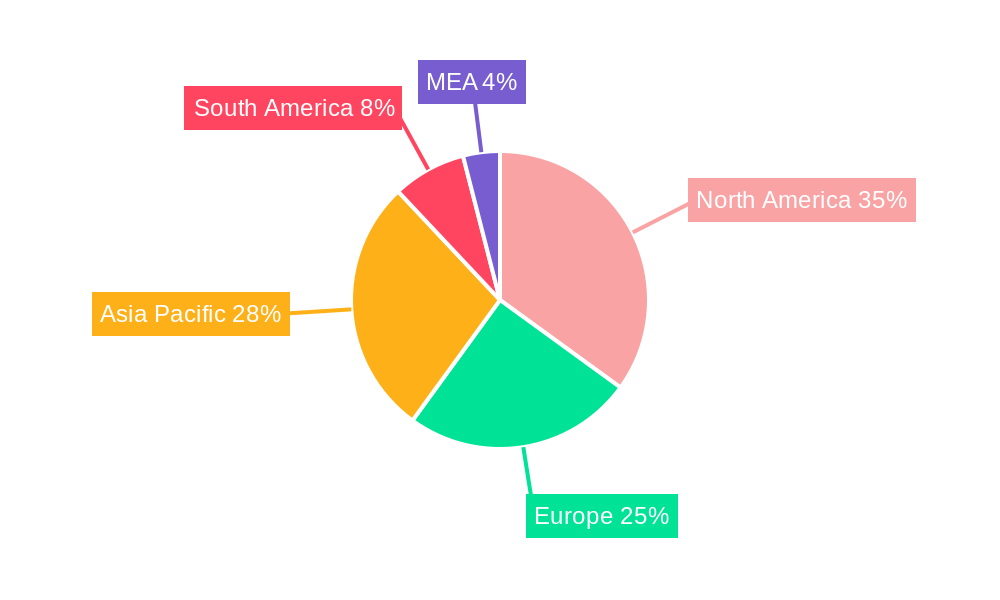
The global reservoir analysis market is experiencing robust growth, driven by the increasing demand for efficient hydrocarbon exploration and production. A compound annual growth rate (CAGR) exceeding 2.00% indicates a steadily expanding market, projected to reach significant value over the forecast period (2025-2033). This growth is fueled by several key factors. Firstly, the ongoing exploration and development of unconventional resources, such as shale gas and tight oil, necessitates advanced reservoir characterization techniques. Secondly, technological advancements in areas like data analytics, artificial intelligence, and high-performance computing are significantly improving the accuracy and speed of reservoir analysis, leading to better production optimization and reduced exploration risks. The market is segmented by reservoir type (conventional and unconventional), service type (geo-modeling, reservoir simulation, data acquisition and monitoring, reservoir sampling, and others), and application (onshore and offshore). The significant presence of major oilfield service companies such as Schlumberger, Halliburton, Baker Hughes, and Weatherford, along with specialized software providers like Roxar, indicates a competitive yet dynamic landscape. Regional variations exist, with North America and the Asia-Pacific region expected to dominate the market share due to significant oil and gas exploration activities and technological infrastructure.
Despite the positive growth trajectory, the reservoir analysis market faces certain restraints. Fluctuations in oil and gas prices can directly impact investment in exploration and production activities, thereby affecting demand. Furthermore, the high capital expenditure required for acquiring and deploying advanced reservoir analysis technologies can act as a barrier to entry for smaller companies. However, the long-term outlook for the market remains optimistic, driven by the continuous need to optimize hydrocarbon recovery, enhance production efficiency, and explore new reserves in increasingly challenging geological settings. The continued development of sophisticated simulation software and the integration of big data analytics are expected to further propel market expansion. The ongoing energy transition towards cleaner energy sources could present a long-term challenge, however, the demand for efficient hydrocarbon extraction is likely to persist for several decades.
This in-depth report provides a comprehensive analysis of the Reservoir Analysis Industry, covering market size, growth drivers, challenges, and key players. With a focus on the period 2019-2033, the report offers invaluable insights for industry stakeholders, investors, and researchers seeking to understand and capitalize on this dynamic market. The study includes detailed segmentation by reservoir type (conventional and unconventional), service type (geo-modeling, reservoir simulation, data acquisition and monitoring, reservoir sampling, and others), and application (onshore and offshore). The report projects a market valued at xx Million by 2025 and xx Million by 2033, providing a robust forecast for informed decision-making.
Reservoir Analysis Industry Market Concentration & Innovation
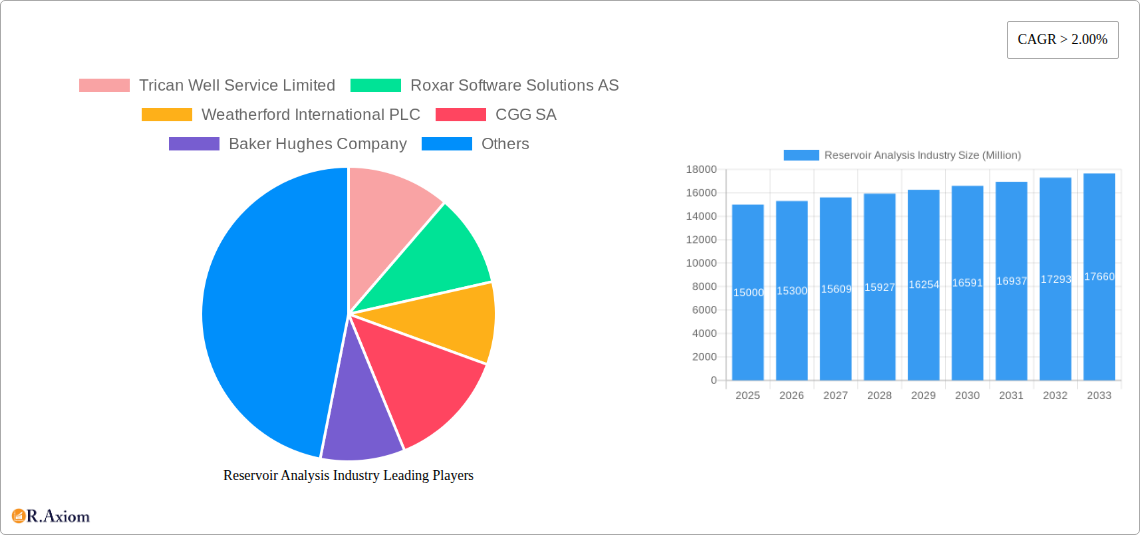
The Reservoir Analysis Industry is characterized by a moderately concentrated market, with a few dominant players holding significant market share. Companies like Schlumberger Limited, Halliburton Company, and Baker Hughes Company command a substantial portion of the global market, driven by their extensive technological capabilities, global reach, and established client bases. However, the market also features a number of smaller, specialized firms focusing on niche segments or innovative technologies. This competitive landscape fosters innovation and drives the development of advanced reservoir analysis techniques.
Market share data for 2024 suggests Schlumberger holds approximately 25%, Halliburton around 20%, and Baker Hughes around 15%, while the remaining 40% is distributed amongst other players including CGG, Weatherford, and numerous smaller companies. M&A activity in the sector has been significant, with deal values reaching xx Million in the past five years. These activities primarily aimed at acquiring specialized technologies or expanding into new geographical markets. Key innovation drivers include the need for improved reservoir characterization, enhanced oil recovery techniques, and digitalization of reservoir management. Regulatory frameworks, particularly those related to environmental protection and data security, significantly influence industry practices. Product substitutes, such as alternative energy sources, pose a long-term challenge, while end-user trends, such as increased demand for sustainable energy solutions, are shaping industry development.
Reservoir Analysis Industry Industry Trends & Insights
The Reservoir Analysis Industry is experiencing significant growth, driven by increasing global energy demand and the need for more efficient hydrocarbon extraction. Technological advancements in areas such as digitalization, artificial intelligence (AI), and machine learning are revolutionizing reservoir characterization and management. The adoption of cloud-based platforms and advanced analytics is enabling faster and more accurate reservoir simulation and forecasting. This has led to improved reservoir management practices, resulting in increased production and reduced operational costs.
The market is exhibiting a Compound Annual Growth Rate (CAGR) of approximately xx% during the historical period (2019-2024) and is projected to maintain a CAGR of xx% during the forecast period (2025-2033). Market penetration of advanced technologies like AI and machine learning in reservoir analysis is steadily increasing, with a projected penetration rate of xx% by 2033. Consumer preferences are shifting toward sustainable and environmentally responsible practices, influencing the demand for efficient and environmentally friendly reservoir management solutions. Competitive dynamics are intense, with major players focusing on innovation, strategic partnerships, and mergers and acquisitions to maintain their market position.
Dominant Markets & Segments in Reservoir Analysis Industry
Leading Region: North America remains a dominant market due to its large shale gas reserves and robust oil and gas industry. The Middle East also holds a significant position due to its substantial conventional hydrocarbon reserves.
Leading Country: The United States holds a leading position due to its extensive unconventional resources and active exploration & production activities.
Dominant Reservoir Type: Unconventional reservoirs, particularly shale gas and tight oil, have witnessed substantial growth due to technological advancements in hydraulic fracturing. However, conventional reservoirs still represent a significant market segment.
Dominant Service: Reservoir simulation is a crucial service, driving efficiency and cost-effectiveness in reservoir management. Geo-modeling is also a significant segment, providing the foundational data for other reservoir analysis services.
Dominant Application: Onshore applications currently dominate the market due to the prevalence of both conventional and unconventional resources. However, offshore applications are also experiencing considerable growth driven by deepwater exploration and production.
Key drivers for the dominance of North America include favorable government policies, strong investment in exploration and production, and technological innovation within the oil and gas sector. The Middle East’s dominance is fueled by its massive hydrocarbon reserves and significant investments in energy infrastructure. The rise of unconventional resources has created new opportunities for service providers and significantly increased the demand for reservoir simulation and data acquisition services.
Reservoir Analysis Industry Product Developments
Recent product innovations focus on integrating advanced technologies like AI, machine learning, and cloud computing into reservoir simulation and characterization software. These advancements are improving the accuracy and speed of reservoir analysis, leading to more efficient resource management and increased production. New applications are emerging in areas such as enhanced oil recovery (EOR) and carbon capture and storage (CCS), driving further growth in the market. These products offer significant competitive advantages by improving prediction accuracy, reducing operational costs, and minimizing environmental impact. The market is witnessing a strong trend towards integrated software solutions that combine various reservoir analysis techniques, providing a holistic view of the reservoir.
Report Scope & Segmentation Analysis
This report segments the Reservoir Analysis Industry by:
Reservoir Type: Conventional and Unconventional. Conventional reservoirs are expected to show steady growth, while unconventional reservoirs are projected to experience higher growth rates driven by technological advancements in extraction techniques. Market sizes vary significantly between these segments, with unconventional reservoirs showing faster growth in recent years.
Service: Geo-modeling, Reservoir Simulation, Data Acquisition and Monitoring, Reservoir Sampling, Others. Each segment displays unique growth characteristics and competitive dynamics. Reservoir simulation is the largest segment, experiencing consistent growth due to its crucial role in optimizing production.
Application: Onshore and Offshore. Onshore applications comprise the majority of the market, although offshore applications are gaining traction with increased deepwater exploration activity. Growth projections vary based on geographical factors and regulatory environments.
Key Drivers of Reservoir Analysis Industry Growth
Several factors are driving the growth of the Reservoir Analysis Industry:
- Technological advancements: AI, machine learning, and cloud computing are improving the accuracy and efficiency of reservoir analysis.
- Increased energy demand: Growing global energy consumption necessitates enhanced hydrocarbon recovery techniques.
- Stringent environmental regulations: Demand for efficient and environmentally conscious reservoir management is rising.
- Government support: Investment in exploration and production, especially in unconventional resources, spurs growth.
Challenges in the Reservoir Analysis Industry Sector
The Reservoir Analysis Industry faces several challenges:
- Fluctuating oil and gas prices: Price volatility directly impacts investment in reservoir analysis projects.
- Data availability and quality: Inconsistent or limited data can hinder accurate reservoir modeling.
- High initial investment costs: Implementing advanced technologies and software requires significant upfront investment.
- Geopolitical risks: Political instability and regulatory changes can disrupt operations and investments.
Emerging Opportunities in Reservoir Analysis Industry
Emerging opportunities include:
- Digitalization and automation: Increased use of AI, machine learning, and cloud computing.
- Focus on sustainability: Demand for environmentally responsible reservoir management solutions.
- Growth in unconventional resources: Expansion into shale gas, tight oil, and other unconventional plays.
- Integration of data from various sources: Development of integrated platforms to analyze multi-source data.
Leading Players in the Reservoir Analysis Industry Market
- Trican Well Service Limited
- Roxar Software Solutions AS
- Weatherford International PLC
- CGG SA
- Baker Hughes Company
- Halliburton Company
- Core Laboratories N V
- Schlumberger Limited
Key Developments in Reservoir Analysis Industry Industry
June 2022: CGG secured a four-year contract extension for its reservoir services center with Petrobras in Rio de Janeiro, Brazil, highlighting the increasing demand for outsourced reservoir analysis services.
December 2022: ADNOC Offshore awarded major software contracts to Kappa and Amarile, demonstrating the growing adoption of advanced software solutions for reservoir management. This signifies a shift towards more sophisticated data management and simulation capabilities within the industry.
Strategic Outlook for Reservoir Analysis Industry Market
The Reservoir Analysis Industry is poised for continued growth, driven by technological advancements, increasing energy demand, and the need for efficient and sustainable resource management. The integration of AI, machine learning, and cloud computing will further enhance the accuracy and efficiency of reservoir analysis, while the focus on sustainable practices will drive demand for environmentally friendly solutions. Emerging markets and the ongoing exploration of unconventional resources will also contribute to market expansion in the coming years. The strategic focus should be on developing innovative solutions, fostering strategic partnerships, and adapting to the evolving regulatory landscape.
Reservoir Analysis Industry Segmentation
-
1. Application
- 1.1. Onshore
- 1.2. Offshore
-
2. Reservoir Type
- 2.1. Conventional
- 2.2. Unconventional
-
3. Service
- 3.1. Geo Modeling
- 3.2. Reservoir Simulation
- 3.3. Data Acquisition and Monitoring
- 3.4. Reservoir Sampling
- 3.5. Others
Reservoir Analysis Industry Segmentation By Geography
- 1. North America
- 2. Asia Pacific
- 3. Europe
- 4. South America
- 5. Middle East and Africa
Reservoir Analysis Industry REPORT HIGHLIGHTS
| Aspects | Details |
|---|---|
| Study Period | 2019-2033 |
| Base Year | 2024 |
| Estimated Year | 2025 |
| Forecast Period | 2025-2033 |
| Historical Period | 2019-2024 |
| Growth Rate | CAGR of > 2.00% from 2019-2033 |
| Segmentation |
|
Table of Contents
- 1. Introduction
- 1.1. Research Scope
- 1.2. Market Segmentation
- 1.3. Research Methodology
- 1.4. Definitions and Assumptions
- 2. Executive Summary
- 2.1. Introduction
- 3. Market Dynamics
- 3.1. Introduction
- 3.2. Market Drivers
- 3.2.1. 4.; Increasing Automotive Sales in Saudi Arabia4.; Rising Demand from Heavy Automotives
- 3.3. Market Restrains
- 3.3.1. 4.; Rising Emphasis on Electric Vehicles
- 3.4. Market Trends
- 3.4.1. Unconventional Segment to Witness Fastest Growth
- 4. Market Factor Analysis
- 4.1. Porters Five Forces
- 4.2. Supply/Value Chain
- 4.3. PESTEL analysis
- 4.4. Market Entropy
- 4.5. Patent/Trademark Analysis
- 5. Global Reservoir Analysis Industry Analysis, Insights and Forecast, 2019-2031
- 5.1. Market Analysis, Insights and Forecast - by Application
- 5.1.1. Onshore
- 5.1.2. Offshore
- 5.2. Market Analysis, Insights and Forecast - by Reservoir Type
- 5.2.1. Conventional
- 5.2.2. Unconventional
- 5.3. Market Analysis, Insights and Forecast - by Service
- 5.3.1. Geo Modeling
- 5.3.2. Reservoir Simulation
- 5.3.3. Data Acquisition and Monitoring
- 5.3.4. Reservoir Sampling
- 5.3.5. Others
- 5.4. Market Analysis, Insights and Forecast - by Region
- 5.4.1. North America
- 5.4.2. Asia Pacific
- 5.4.3. Europe
- 5.4.4. South America
- 5.4.5. Middle East and Africa
- 5.1. Market Analysis, Insights and Forecast - by Application
- 6. North America Reservoir Analysis Industry Analysis, Insights and Forecast, 2019-2031
- 6.1. Market Analysis, Insights and Forecast - by Application
- 6.1.1. Onshore
- 6.1.2. Offshore
- 6.2. Market Analysis, Insights and Forecast - by Reservoir Type
- 6.2.1. Conventional
- 6.2.2. Unconventional
- 6.3. Market Analysis, Insights and Forecast - by Service
- 6.3.1. Geo Modeling
- 6.3.2. Reservoir Simulation
- 6.3.3. Data Acquisition and Monitoring
- 6.3.4. Reservoir Sampling
- 6.3.5. Others
- 6.1. Market Analysis, Insights and Forecast - by Application
- 7. Asia Pacific Reservoir Analysis Industry Analysis, Insights and Forecast, 2019-2031
- 7.1. Market Analysis, Insights and Forecast - by Application
- 7.1.1. Onshore
- 7.1.2. Offshore
- 7.2. Market Analysis, Insights and Forecast - by Reservoir Type
- 7.2.1. Conventional
- 7.2.2. Unconventional
- 7.3. Market Analysis, Insights and Forecast - by Service
- 7.3.1. Geo Modeling
- 7.3.2. Reservoir Simulation
- 7.3.3. Data Acquisition and Monitoring
- 7.3.4. Reservoir Sampling
- 7.3.5. Others
- 7.1. Market Analysis, Insights and Forecast - by Application
- 8. Europe Reservoir Analysis Industry Analysis, Insights and Forecast, 2019-2031
- 8.1. Market Analysis, Insights and Forecast - by Application
- 8.1.1. Onshore
- 8.1.2. Offshore
- 8.2. Market Analysis, Insights and Forecast - by Reservoir Type
- 8.2.1. Conventional
- 8.2.2. Unconventional
- 8.3. Market Analysis, Insights and Forecast - by Service
- 8.3.1. Geo Modeling
- 8.3.2. Reservoir Simulation
- 8.3.3. Data Acquisition and Monitoring
- 8.3.4. Reservoir Sampling
- 8.3.5. Others
- 8.1. Market Analysis, Insights and Forecast - by Application
- 9. South America Reservoir Analysis Industry Analysis, Insights and Forecast, 2019-2031
- 9.1. Market Analysis, Insights and Forecast - by Application
- 9.1.1. Onshore
- 9.1.2. Offshore
- 9.2. Market Analysis, Insights and Forecast - by Reservoir Type
- 9.2.1. Conventional
- 9.2.2. Unconventional
- 9.3. Market Analysis, Insights and Forecast - by Service
- 9.3.1. Geo Modeling
- 9.3.2. Reservoir Simulation
- 9.3.3. Data Acquisition and Monitoring
- 9.3.4. Reservoir Sampling
- 9.3.5. Others
- 9.1. Market Analysis, Insights and Forecast - by Application
- 10. Middle East and Africa Reservoir Analysis Industry Analysis, Insights and Forecast, 2019-2031
- 10.1. Market Analysis, Insights and Forecast - by Application
- 10.1.1. Onshore
- 10.1.2. Offshore
- 10.2. Market Analysis, Insights and Forecast - by Reservoir Type
- 10.2.1. Conventional
- 10.2.2. Unconventional
- 10.3. Market Analysis, Insights and Forecast - by Service
- 10.3.1. Geo Modeling
- 10.3.2. Reservoir Simulation
- 10.3.3. Data Acquisition and Monitoring
- 10.3.4. Reservoir Sampling
- 10.3.5. Others
- 10.1. Market Analysis, Insights and Forecast - by Application
- 11. North America Reservoir Analysis Industry Analysis, Insights and Forecast, 2019-2031
- 11.1. Market Analysis, Insights and Forecast - By Country/Sub-region
- 11.1.1 United States
- 11.1.2 Canada
- 11.1.3 Mexico
- 12. Europe Reservoir Analysis Industry Analysis, Insights and Forecast, 2019-2031
- 12.1. Market Analysis, Insights and Forecast - By Country/Sub-region
- 12.1.1 Germany
- 12.1.2 United Kingdom
- 12.1.3 France
- 12.1.4 Spain
- 12.1.5 Italy
- 12.1.6 Spain
- 12.1.7 Belgium
- 12.1.8 Netherland
- 12.1.9 Nordics
- 12.1.10 Rest of Europe
- 13. Asia Pacific Reservoir Analysis Industry Analysis, Insights and Forecast, 2019-2031
- 13.1. Market Analysis, Insights and Forecast - By Country/Sub-region
- 13.1.1 China
- 13.1.2 Japan
- 13.1.3 India
- 13.1.4 South Korea
- 13.1.5 Southeast Asia
- 13.1.6 Australia
- 13.1.7 Indonesia
- 13.1.8 Phillipes
- 13.1.9 Singapore
- 13.1.10 Thailandc
- 13.1.11 Rest of Asia Pacific
- 14. South America Reservoir Analysis Industry Analysis, Insights and Forecast, 2019-2031
- 14.1. Market Analysis, Insights and Forecast - By Country/Sub-region
- 14.1.1 Brazil
- 14.1.2 Argentina
- 14.1.3 Peru
- 14.1.4 Chile
- 14.1.5 Colombia
- 14.1.6 Ecuador
- 14.1.7 Venezuela
- 14.1.8 Rest of South America
- 15. MEA Reservoir Analysis Industry Analysis, Insights and Forecast, 2019-2031
- 15.1. Market Analysis, Insights and Forecast - By Country/Sub-region
- 15.1.1 United Arab Emirates
- 15.1.2 Saudi Arabia
- 15.1.3 South Africa
- 15.1.4 Rest of Middle East and Africa
- 16. Competitive Analysis
- 16.1. Global Market Share Analysis 2024
- 16.2. Company Profiles
- 16.2.1 Trican Well Service Limited
- 16.2.1.1. Overview
- 16.2.1.2. Products
- 16.2.1.3. SWOT Analysis
- 16.2.1.4. Recent Developments
- 16.2.1.5. Financials (Based on Availability)
- 16.2.2 Roxar Software Solutions AS
- 16.2.2.1. Overview
- 16.2.2.2. Products
- 16.2.2.3. SWOT Analysis
- 16.2.2.4. Recent Developments
- 16.2.2.5. Financials (Based on Availability)
- 16.2.3 Weatherford International PLC
- 16.2.3.1. Overview
- 16.2.3.2. Products
- 16.2.3.3. SWOT Analysis
- 16.2.3.4. Recent Developments
- 16.2.3.5. Financials (Based on Availability)
- 16.2.4 CGG SA
- 16.2.4.1. Overview
- 16.2.4.2. Products
- 16.2.4.3. SWOT Analysis
- 16.2.4.4. Recent Developments
- 16.2.4.5. Financials (Based on Availability)
- 16.2.5 Baker Hughes Company
- 16.2.5.1. Overview
- 16.2.5.2. Products
- 16.2.5.3. SWOT Analysis
- 16.2.5.4. Recent Developments
- 16.2.5.5. Financials (Based on Availability)
- 16.2.6 Halliburton Company
- 16.2.6.1. Overview
- 16.2.6.2. Products
- 16.2.6.3. SWOT Analysis
- 16.2.6.4. Recent Developments
- 16.2.6.5. Financials (Based on Availability)
- 16.2.7 Core Laboratories N V
- 16.2.7.1. Overview
- 16.2.7.2. Products
- 16.2.7.3. SWOT Analysis
- 16.2.7.4. Recent Developments
- 16.2.7.5. Financials (Based on Availability)
- 16.2.8 Schlumberger Limited
- 16.2.8.1. Overview
- 16.2.8.2. Products
- 16.2.8.3. SWOT Analysis
- 16.2.8.4. Recent Developments
- 16.2.8.5. Financials (Based on Availability)
- 16.2.1 Trican Well Service Limited
List of Figures
- Figure 1: Global Reservoir Analysis Industry Revenue Breakdown (Million, %) by Region 2024 & 2032
- Figure 2: North America Reservoir Analysis Industry Revenue (Million), by Country 2024 & 2032
- Figure 3: North America Reservoir Analysis Industry Revenue Share (%), by Country 2024 & 2032
- Figure 4: Europe Reservoir Analysis Industry Revenue (Million), by Country 2024 & 2032
- Figure 5: Europe Reservoir Analysis Industry Revenue Share (%), by Country 2024 & 2032
- Figure 6: Asia Pacific Reservoir Analysis Industry Revenue (Million), by Country 2024 & 2032
- Figure 7: Asia Pacific Reservoir Analysis Industry Revenue Share (%), by Country 2024 & 2032
- Figure 8: South America Reservoir Analysis Industry Revenue (Million), by Country 2024 & 2032
- Figure 9: South America Reservoir Analysis Industry Revenue Share (%), by Country 2024 & 2032
- Figure 10: MEA Reservoir Analysis Industry Revenue (Million), by Country 2024 & 2032
- Figure 11: MEA Reservoir Analysis Industry Revenue Share (%), by Country 2024 & 2032
- Figure 12: North America Reservoir Analysis Industry Revenue (Million), by Application 2024 & 2032
- Figure 13: North America Reservoir Analysis Industry Revenue Share (%), by Application 2024 & 2032
- Figure 14: North America Reservoir Analysis Industry Revenue (Million), by Reservoir Type 2024 & 2032
- Figure 15: North America Reservoir Analysis Industry Revenue Share (%), by Reservoir Type 2024 & 2032
- Figure 16: North America Reservoir Analysis Industry Revenue (Million), by Service 2024 & 2032
- Figure 17: North America Reservoir Analysis Industry Revenue Share (%), by Service 2024 & 2032
- Figure 18: North America Reservoir Analysis Industry Revenue (Million), by Country 2024 & 2032
- Figure 19: North America Reservoir Analysis Industry Revenue Share (%), by Country 2024 & 2032
- Figure 20: Asia Pacific Reservoir Analysis Industry Revenue (Million), by Application 2024 & 2032
- Figure 21: Asia Pacific Reservoir Analysis Industry Revenue Share (%), by Application 2024 & 2032
- Figure 22: Asia Pacific Reservoir Analysis Industry Revenue (Million), by Reservoir Type 2024 & 2032
- Figure 23: Asia Pacific Reservoir Analysis Industry Revenue Share (%), by Reservoir Type 2024 & 2032
- Figure 24: Asia Pacific Reservoir Analysis Industry Revenue (Million), by Service 2024 & 2032
- Figure 25: Asia Pacific Reservoir Analysis Industry Revenue Share (%), by Service 2024 & 2032
- Figure 26: Asia Pacific Reservoir Analysis Industry Revenue (Million), by Country 2024 & 2032
- Figure 27: Asia Pacific Reservoir Analysis Industry Revenue Share (%), by Country 2024 & 2032
- Figure 28: Europe Reservoir Analysis Industry Revenue (Million), by Application 2024 & 2032
- Figure 29: Europe Reservoir Analysis Industry Revenue Share (%), by Application 2024 & 2032
- Figure 30: Europe Reservoir Analysis Industry Revenue (Million), by Reservoir Type 2024 & 2032
- Figure 31: Europe Reservoir Analysis Industry Revenue Share (%), by Reservoir Type 2024 & 2032
- Figure 32: Europe Reservoir Analysis Industry Revenue (Million), by Service 2024 & 2032
- Figure 33: Europe Reservoir Analysis Industry Revenue Share (%), by Service 2024 & 2032
- Figure 34: Europe Reservoir Analysis Industry Revenue (Million), by Country 2024 & 2032
- Figure 35: Europe Reservoir Analysis Industry Revenue Share (%), by Country 2024 & 2032
- Figure 36: South America Reservoir Analysis Industry Revenue (Million), by Application 2024 & 2032
- Figure 37: South America Reservoir Analysis Industry Revenue Share (%), by Application 2024 & 2032
- Figure 38: South America Reservoir Analysis Industry Revenue (Million), by Reservoir Type 2024 & 2032
- Figure 39: South America Reservoir Analysis Industry Revenue Share (%), by Reservoir Type 2024 & 2032
- Figure 40: South America Reservoir Analysis Industry Revenue (Million), by Service 2024 & 2032
- Figure 41: South America Reservoir Analysis Industry Revenue Share (%), by Service 2024 & 2032
- Figure 42: South America Reservoir Analysis Industry Revenue (Million), by Country 2024 & 2032
- Figure 43: South America Reservoir Analysis Industry Revenue Share (%), by Country 2024 & 2032
- Figure 44: Middle East and Africa Reservoir Analysis Industry Revenue (Million), by Application 2024 & 2032
- Figure 45: Middle East and Africa Reservoir Analysis Industry Revenue Share (%), by Application 2024 & 2032
- Figure 46: Middle East and Africa Reservoir Analysis Industry Revenue (Million), by Reservoir Type 2024 & 2032
- Figure 47: Middle East and Africa Reservoir Analysis Industry Revenue Share (%), by Reservoir Type 2024 & 2032
- Figure 48: Middle East and Africa Reservoir Analysis Industry Revenue (Million), by Service 2024 & 2032
- Figure 49: Middle East and Africa Reservoir Analysis Industry Revenue Share (%), by Service 2024 & 2032
- Figure 50: Middle East and Africa Reservoir Analysis Industry Revenue (Million), by Country 2024 & 2032
- Figure 51: Middle East and Africa Reservoir Analysis Industry Revenue Share (%), by Country 2024 & 2032
List of Tables
- Table 1: Global Reservoir Analysis Industry Revenue Million Forecast, by Region 2019 & 2032
- Table 2: Global Reservoir Analysis Industry Revenue Million Forecast, by Application 2019 & 2032
- Table 3: Global Reservoir Analysis Industry Revenue Million Forecast, by Reservoir Type 2019 & 2032
- Table 4: Global Reservoir Analysis Industry Revenue Million Forecast, by Service 2019 & 2032
- Table 5: Global Reservoir Analysis Industry Revenue Million Forecast, by Region 2019 & 2032
- Table 6: Global Reservoir Analysis Industry Revenue Million Forecast, by Country 2019 & 2032
- Table 7: United States Reservoir Analysis Industry Revenue (Million) Forecast, by Application 2019 & 2032
- Table 8: Canada Reservoir Analysis Industry Revenue (Million) Forecast, by Application 2019 & 2032
- Table 9: Mexico Reservoir Analysis Industry Revenue (Million) Forecast, by Application 2019 & 2032
- Table 10: Global Reservoir Analysis Industry Revenue Million Forecast, by Country 2019 & 2032
- Table 11: Germany Reservoir Analysis Industry Revenue (Million) Forecast, by Application 2019 & 2032
- Table 12: United Kingdom Reservoir Analysis Industry Revenue (Million) Forecast, by Application 2019 & 2032
- Table 13: France Reservoir Analysis Industry Revenue (Million) Forecast, by Application 2019 & 2032
- Table 14: Spain Reservoir Analysis Industry Revenue (Million) Forecast, by Application 2019 & 2032
- Table 15: Italy Reservoir Analysis Industry Revenue (Million) Forecast, by Application 2019 & 2032
- Table 16: Spain Reservoir Analysis Industry Revenue (Million) Forecast, by Application 2019 & 2032
- Table 17: Belgium Reservoir Analysis Industry Revenue (Million) Forecast, by Application 2019 & 2032
- Table 18: Netherland Reservoir Analysis Industry Revenue (Million) Forecast, by Application 2019 & 2032
- Table 19: Nordics Reservoir Analysis Industry Revenue (Million) Forecast, by Application 2019 & 2032
- Table 20: Rest of Europe Reservoir Analysis Industry Revenue (Million) Forecast, by Application 2019 & 2032
- Table 21: Global Reservoir Analysis Industry Revenue Million Forecast, by Country 2019 & 2032
- Table 22: China Reservoir Analysis Industry Revenue (Million) Forecast, by Application 2019 & 2032
- Table 23: Japan Reservoir Analysis Industry Revenue (Million) Forecast, by Application 2019 & 2032
- Table 24: India Reservoir Analysis Industry Revenue (Million) Forecast, by Application 2019 & 2032
- Table 25: South Korea Reservoir Analysis Industry Revenue (Million) Forecast, by Application 2019 & 2032
- Table 26: Southeast Asia Reservoir Analysis Industry Revenue (Million) Forecast, by Application 2019 & 2032
- Table 27: Australia Reservoir Analysis Industry Revenue (Million) Forecast, by Application 2019 & 2032
- Table 28: Indonesia Reservoir Analysis Industry Revenue (Million) Forecast, by Application 2019 & 2032
- Table 29: Phillipes Reservoir Analysis Industry Revenue (Million) Forecast, by Application 2019 & 2032
- Table 30: Singapore Reservoir Analysis Industry Revenue (Million) Forecast, by Application 2019 & 2032
- Table 31: Thailandc Reservoir Analysis Industry Revenue (Million) Forecast, by Application 2019 & 2032
- Table 32: Rest of Asia Pacific Reservoir Analysis Industry Revenue (Million) Forecast, by Application 2019 & 2032
- Table 33: Global Reservoir Analysis Industry Revenue Million Forecast, by Country 2019 & 2032
- Table 34: Brazil Reservoir Analysis Industry Revenue (Million) Forecast, by Application 2019 & 2032
- Table 35: Argentina Reservoir Analysis Industry Revenue (Million) Forecast, by Application 2019 & 2032
- Table 36: Peru Reservoir Analysis Industry Revenue (Million) Forecast, by Application 2019 & 2032
- Table 37: Chile Reservoir Analysis Industry Revenue (Million) Forecast, by Application 2019 & 2032
- Table 38: Colombia Reservoir Analysis Industry Revenue (Million) Forecast, by Application 2019 & 2032
- Table 39: Ecuador Reservoir Analysis Industry Revenue (Million) Forecast, by Application 2019 & 2032
- Table 40: Venezuela Reservoir Analysis Industry Revenue (Million) Forecast, by Application 2019 & 2032
- Table 41: Rest of South America Reservoir Analysis Industry Revenue (Million) Forecast, by Application 2019 & 2032
- Table 42: Global Reservoir Analysis Industry Revenue Million Forecast, by Country 2019 & 2032
- Table 43: United Arab Emirates Reservoir Analysis Industry Revenue (Million) Forecast, by Application 2019 & 2032
- Table 44: Saudi Arabia Reservoir Analysis Industry Revenue (Million) Forecast, by Application 2019 & 2032
- Table 45: South Africa Reservoir Analysis Industry Revenue (Million) Forecast, by Application 2019 & 2032
- Table 46: Rest of Middle East and Africa Reservoir Analysis Industry Revenue (Million) Forecast, by Application 2019 & 2032
- Table 47: Global Reservoir Analysis Industry Revenue Million Forecast, by Application 2019 & 2032
- Table 48: Global Reservoir Analysis Industry Revenue Million Forecast, by Reservoir Type 2019 & 2032
- Table 49: Global Reservoir Analysis Industry Revenue Million Forecast, by Service 2019 & 2032
- Table 50: Global Reservoir Analysis Industry Revenue Million Forecast, by Country 2019 & 2032
- Table 51: Global Reservoir Analysis Industry Revenue Million Forecast, by Application 2019 & 2032
- Table 52: Global Reservoir Analysis Industry Revenue Million Forecast, by Reservoir Type 2019 & 2032
- Table 53: Global Reservoir Analysis Industry Revenue Million Forecast, by Service 2019 & 2032
- Table 54: Global Reservoir Analysis Industry Revenue Million Forecast, by Country 2019 & 2032
- Table 55: Global Reservoir Analysis Industry Revenue Million Forecast, by Application 2019 & 2032
- Table 56: Global Reservoir Analysis Industry Revenue Million Forecast, by Reservoir Type 2019 & 2032
- Table 57: Global Reservoir Analysis Industry Revenue Million Forecast, by Service 2019 & 2032
- Table 58: Global Reservoir Analysis Industry Revenue Million Forecast, by Country 2019 & 2032
- Table 59: Global Reservoir Analysis Industry Revenue Million Forecast, by Application 2019 & 2032
- Table 60: Global Reservoir Analysis Industry Revenue Million Forecast, by Reservoir Type 2019 & 2032
- Table 61: Global Reservoir Analysis Industry Revenue Million Forecast, by Service 2019 & 2032
- Table 62: Global Reservoir Analysis Industry Revenue Million Forecast, by Country 2019 & 2032
- Table 63: Global Reservoir Analysis Industry Revenue Million Forecast, by Application 2019 & 2032
- Table 64: Global Reservoir Analysis Industry Revenue Million Forecast, by Reservoir Type 2019 & 2032
- Table 65: Global Reservoir Analysis Industry Revenue Million Forecast, by Service 2019 & 2032
- Table 66: Global Reservoir Analysis Industry Revenue Million Forecast, by Country 2019 & 2032
Frequently Asked Questions
1. What is the projected Compound Annual Growth Rate (CAGR) of the Reservoir Analysis Industry?
The projected CAGR is approximately > 2.00%.
2. Which companies are prominent players in the Reservoir Analysis Industry?
Key companies in the market include Trican Well Service Limited, Roxar Software Solutions AS, Weatherford International PLC, CGG SA, Baker Hughes Company, Halliburton Company, Core Laboratories N V, Schlumberger Limited.
3. What are the main segments of the Reservoir Analysis Industry?
The market segments include Application, Reservoir Type, Service.
4. Can you provide details about the market size?
The market size is estimated to be USD XX Million as of 2022.
5. What are some drivers contributing to market growth?
4.; Increasing Automotive Sales in Saudi Arabia4.; Rising Demand from Heavy Automotives.
6. What are the notable trends driving market growth?
Unconventional Segment to Witness Fastest Growth.
7. Are there any restraints impacting market growth?
4.; Rising Emphasis on Electric Vehicles.
8. Can you provide examples of recent developments in the market?
December 2022: ADNOC Offshore awarded two major software contracts to Dome Principals, Kappa, and Amarile. Kappa, a petroleum engineering software company, will provide ADNOC with different types of Reservoir Related Software Management Systems such as EMERAUDE,SAPHIRE, TOPAZ, etc. Amarile is a company helping Reservoir Engineers speed up and improve the quality of their field dynamic simulation workflow.
9. What pricing options are available for accessing the report?
Pricing options include single-user, multi-user, and enterprise licenses priced at USD 4750, USD 5250, and USD 8750 respectively.
10. Is the market size provided in terms of value or volume?
The market size is provided in terms of value, measured in Million.
11. Are there any specific market keywords associated with the report?
Yes, the market keyword associated with the report is "Reservoir Analysis Industry," which aids in identifying and referencing the specific market segment covered.
12. How do I determine which pricing option suits my needs best?
The pricing options vary based on user requirements and access needs. Individual users may opt for single-user licenses, while businesses requiring broader access may choose multi-user or enterprise licenses for cost-effective access to the report.
13. Are there any additional resources or data provided in the Reservoir Analysis Industry report?
While the report offers comprehensive insights, it's advisable to review the specific contents or supplementary materials provided to ascertain if additional resources or data are available.
14. How can I stay updated on further developments or reports in the Reservoir Analysis Industry?
To stay informed about further developments, trends, and reports in the Reservoir Analysis Industry, consider subscribing to industry newsletters, following relevant companies and organizations, or regularly checking reputable industry news sources and publications.
Methodology
Step 1 - Identification of Relevant Samples Size from Population Database


Step 2 - Approaches for Defining Global Market Size (Value, Volume* & Price*)

Note*: In applicable scenarios
Step 3 - Data Sources
Primary Research
- Web Analytics
- Survey Reports
- Research Institute
- Latest Research Reports
- Opinion Leaders
Secondary Research
- Annual Reports
- White Paper
- Latest Press Release
- Industry Association
- Paid Database
- Investor Presentations

Step 4 - Data Triangulation
Involves using different sources of information in order to increase the validity of a study
These sources are likely to be stakeholders in a program - participants, other researchers, program staff, other community members, and so on.
Then we put all data in single framework & apply various statistical tools to find out the dynamic on the market.
During the analysis stage, feedback from the stakeholder groups would be compared to determine areas of agreement as well as areas of divergence


