
Key Insights
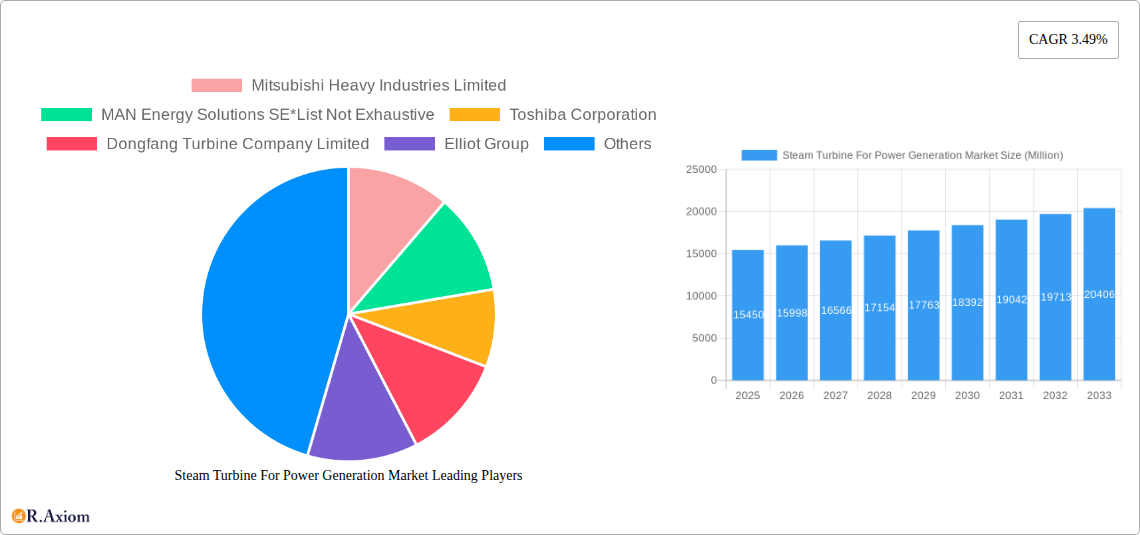
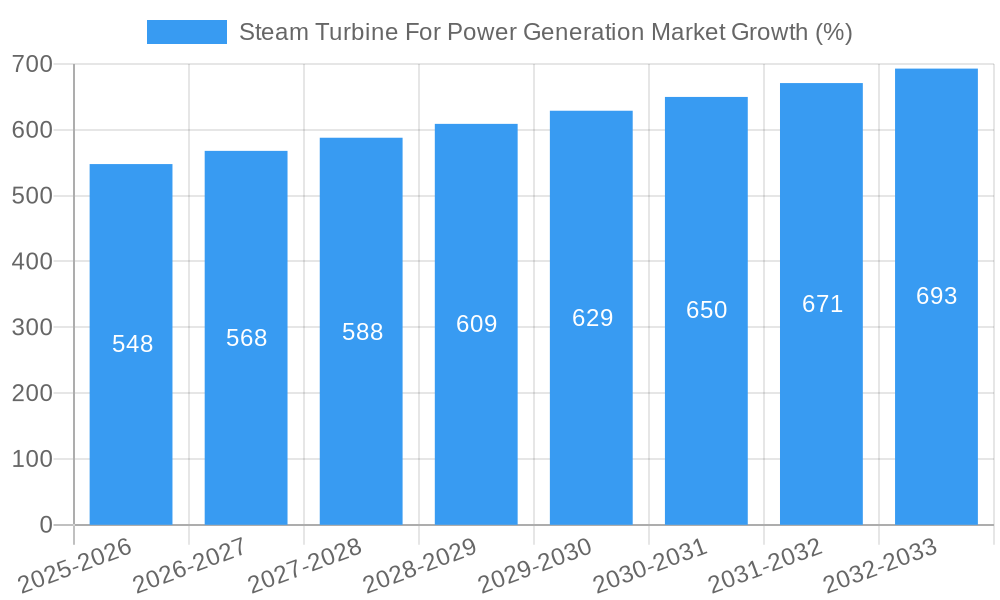
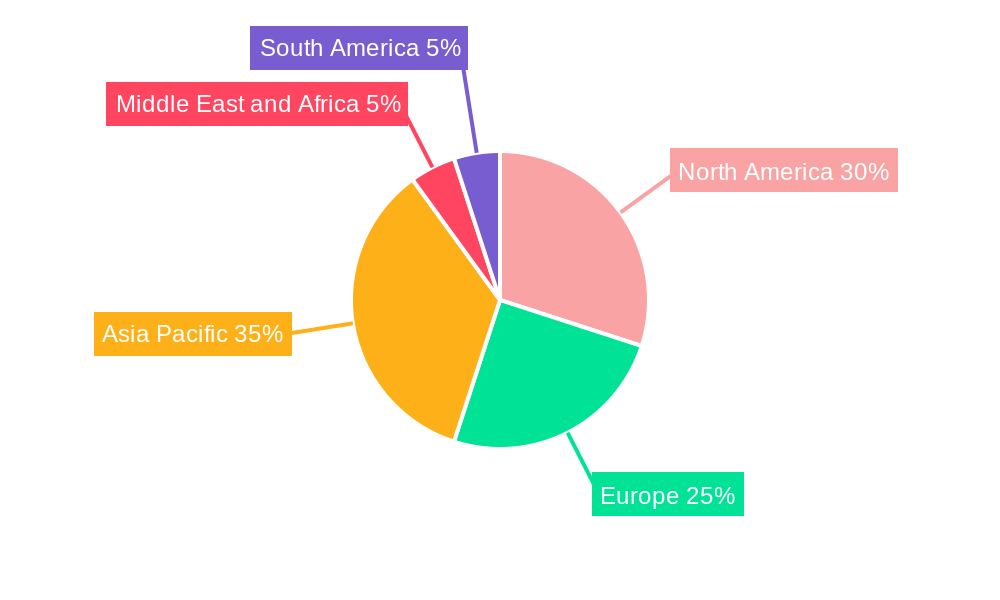
The global Steam Turbine for Power Generation market, valued at $15.45 billion in 2025, is projected to experience steady growth, driven by increasing global energy demand and the ongoing need for efficient power generation solutions. A Compound Annual Growth Rate (CAGR) of 3.49% from 2025 to 2033 indicates a continuous expansion, though the rate suggests a relatively mature market with incremental advancements rather than explosive growth. Key drivers include the rising adoption of renewable energy sources integrated with steam turbines for enhanced efficiency (e.g., combined cycle power plants), growing investments in infrastructure development across emerging economies, and ongoing efforts to modernize aging power generation infrastructure in developed nations. Market segmentation reveals a significant portion of the market is occupied by larger capacity turbines (above 40 MW), reflecting the preference for centralized power generation. However, the smaller capacity segment (less than 20 MW) is likely to see growth driven by decentralized energy solutions and microgrids, particularly in remote areas or applications requiring localized power supply. Geographic distribution shows considerable market presence across North America, Asia-Pacific, and Europe, with China and the US likely being the largest contributors due to their substantial energy demands and established power infrastructure. However, developing regions in Asia-Pacific and the Middle East and Africa offer potential for future expansion due to planned infrastructure developments.
Competitive intensity is relatively high, with established players like Mitsubishi Heavy Industries, Siemens Energy, and General Electric dominating the market alongside regional players like Bharat Heavy Electricals (India) and Dongfang Turbine (China). The market's sustained growth hinges on factors like technological innovation (e.g., advancements in materials science leading to increased efficiency and lifespan), regulatory policies supporting cleaner energy sources, and overall economic growth. Challenges, however, may arise from volatile fuel prices (particularly for coal-fired plants), stricter environmental regulations leading to higher compliance costs, and potential disruptions to supply chains. The long-term outlook remains positive, predicated on the enduring requirement for reliable and efficient power generation to meet the expanding global energy demands, with a shift toward cleaner and more sustainable technologies likely shaping future market dynamics.
Steam Turbine For Power Generation Market: A Comprehensive Report (2019-2033)
This in-depth report provides a comprehensive analysis of the Steam Turbine for Power Generation market, offering valuable insights for industry stakeholders, investors, and strategic decision-makers. Covering the period from 2019 to 2033, with a base year of 2025 and a forecast period of 2025-2033, this report meticulously examines market trends, competitive dynamics, and future growth prospects. The report's detailed segmentation by plant type (Gas, Coal, Other Plant Types), capacity (Less than 20 MW, 20-40 MW, Above 40 MW), and geographic regions provides granular insights into market opportunities and challenges. Key players like Mitsubishi Heavy Industries Limited, MAN Energy Solutions SE, Toshiba Corporation, Dongfang Turbine Company Limited, Elliot Group, Bharat Heavy Electricals Limited, WEG S A, Doosan Enerbility Co Ltd, Siemens Energy AG, and General Electric Company are profiled, highlighting their strategies and market positions.
Steam Turbine For Power Generation Market Market Concentration & Innovation
The Steam Turbine for Power Generation market exhibits a moderately concentrated structure, with a few major players holding significant market share. However, the presence of numerous smaller players contributes to a dynamic competitive landscape. Innovation is driven by the need for higher efficiency, reduced emissions, and improved reliability. Stringent environmental regulations are pushing the adoption of advanced technologies, such as digital twins and AI-powered predictive maintenance. The market witnesses continuous product development, focusing on improving turbine designs for enhanced performance and lifespan. Mergers and acquisitions (M&A) activities are relatively frequent, with larger players acquiring smaller companies to expand their product portfolios and market reach. Recent M&A deals have involved values ranging from xx Million to xx Million USD, impacting market share dynamics significantly.
- Market Concentration: The top 5 players account for approximately xx% of the global market share in 2025.
- Innovation Drivers: Stringent emission norms, rising demand for efficient power generation, advancements in materials science.
- Regulatory Framework: Government policies supporting renewable energy sources and stricter emission standards influence market growth.
- Product Substitutes: While steam turbines remain dominant, alternative technologies like gas turbines and renewable energy sources pose some level of competition.
- End-User Trends: The increasing demand for electricity from diverse sectors, such as industry, residential, and commercial, fuels market expansion.
- M&A Activities: Consolidation is evident, with larger companies acquiring smaller players to achieve economies of scale and expand their product offerings.
Steam Turbine For Power Generation Market Industry Trends & Insights
The Steam Turbine for Power Generation market is projected to witness significant growth during the forecast period, with a Compound Annual Growth Rate (CAGR) of xx% from 2025 to 2033. This growth is primarily driven by increasing global energy demand, particularly in developing economies, coupled with the ongoing expansion of power generation infrastructure. Technological advancements in steam turbine designs, leading to improved efficiency and reduced operational costs, are also significant contributors. Consumer preference for reliable and cost-effective power sources further fuels market expansion. Competitive dynamics are characterized by continuous innovation, strategic partnerships, and M&A activities. Market penetration of advanced steam turbine technologies is steadily increasing, with digitalization playing a crucial role in enhancing operational efficiency and maintenance. The market is also witnessing the emergence of hybrid power generation systems, integrating steam turbines with other renewable energy sources.
Dominant Markets & Segments in Steam Turbine For Power Generation Market
The Asia-Pacific region is expected to dominate the Steam Turbine for Power Generation market throughout the forecast period, driven by rapid industrialization and urbanization. China and India, in particular, are key growth drivers due to their significant investments in power generation infrastructure.
- Plant Type: Coal-fired power plants currently constitute the largest segment, although the share of gas-fired and other plant types (nuclear, CHP) is gradually increasing due to environmental concerns and technological advancements.
- Capacity: The segment with capacity above 40 MW holds the largest market share due to the growing demand for large-scale power plants.
Key Drivers:
- Asia-Pacific: Rapid industrialization, rising energy demand, substantial investments in power infrastructure.
- Coal-fired Plants: Established infrastructure, cost-effectiveness (though facing decreasing dominance).
- >40 MW Capacity: Suitability for large-scale power projects and economies of scale.
Steam Turbine For Power Generation Market Product Developments
Recent product innovations focus on improving efficiency, reducing emissions, and enhancing reliability. Advanced materials, improved blade designs, and digital control systems are key areas of development. These advancements enable steam turbines to operate at higher temperatures and pressures, leading to increased power output and reduced fuel consumption. The integration of digital technologies enables predictive maintenance and optimized performance, enhancing the overall operational efficiency and reducing downtime. The market fit is strong, driven by the increasing demand for efficient and reliable power generation solutions.
Report Scope & Segmentation Analysis
This report segments the Steam Turbine for Power Generation market based on Plant Type (Gas, Coal, Other Plant Types), and Capacity (Less than 20 MW, 20-40 MW, Above 40 MW). Each segment's growth projections, market size, and competitive dynamics are analyzed in detail. The "Other Plant Types" segment includes nuclear and combined heat and power (CHP) plants, showing increasing growth potential due to the transition towards sustainable and efficient energy sources. The capacity segment "Above 40 MW" is anticipated to experience the most significant growth due to increasing demand for large-scale power projects. Competitive landscapes within each segment are assessed, highlighting key players and their market shares.
Key Drivers of Steam Turbine For Power Generation Market Growth
Several factors drive the growth of the Steam Turbine for Power Generation market. The increasing global demand for electricity, driven by economic development and population growth, is a primary driver. Technological advancements, resulting in higher efficiency and reduced emissions, further fuel market expansion. Government policies and regulations supporting renewable energy integration, while also promoting efficient thermal power generation, also play a significant role. Furthermore, the increasing need for reliable and cost-effective power generation solutions in both developed and developing economies contributes to the market's growth.
Challenges in the Steam Turbine For Power Generation Market Sector
The Steam Turbine for Power Generation market faces challenges such as stringent environmental regulations leading to higher compliance costs. Supply chain disruptions can cause delays and impact production. Intense competition among established players and the emergence of alternative energy sources create pressure on pricing and profitability. Fluctuations in raw material prices, such as coal and natural gas, impact the overall cost of power generation and profitability for turbine manufacturers. The estimated impact on market growth due to these challenges is approximately xx%.
Emerging Opportunities in Steam Turbine For Power Generation Market
Emerging opportunities exist in developing economies with increasing energy demand. The integration of steam turbines with renewable energy sources, creating hybrid systems, presents significant potential. Advancements in digital technologies, such as AI-powered predictive maintenance and digital twins, offer opportunities for enhanced operational efficiency and reduced downtime. Moreover, the development of more sustainable and efficient steam turbine technologies addresses environmental concerns and fosters market growth.
Leading Players in the Steam Turbine For Power Generation Market Market
- Mitsubishi Heavy Industries Limited
- MAN Energy Solutions SE
- Toshiba Corporation
- Dongfang Turbine Company Limited
- Elliot Group
- Bharat Heavy Electricals Limited
- WEG S A
- Doosan Enerbility Co Ltd
- Siemens Energy AG
- General Electric Company
Key Developments in Steam Turbine For Power Generation Market Industry
- April 2023: Doosan Koda Power secured a contract for a steam turbine for the South Clyde Energy Centre (Scotland), a project powering 70,000 homes by 2025. This highlights the market's focus on sustainable energy solutions.
- April 2023: The Thar Block-1 thermal power plant (1,320 MW) commenced commercial operation, utilizing Shanghai Electric's steam turbines, showcasing the scale of projects utilizing this technology.
- January 2023: BHEL secured a USD 36.46 Million contract for rehabilitating steam turbines at Gujarat's Ukai Thermal Power Station, indicating ongoing maintenance and modernization needs within the market.
Strategic Outlook for Steam Turbine For Power Generation Market Market
The Steam Turbine for Power Generation market is poised for continued growth, fueled by increasing global energy demand and technological advancements. Opportunities exist in the development of highly efficient, low-emission turbines, the integration with renewable energy sources, and the adoption of digital technologies for optimized operation and maintenance. The market is expected to witness further consolidation through M&A activities, with leading players focusing on innovation and expansion into emerging markets. The long-term outlook remains positive, with significant growth potential across various segments and regions.
Steam Turbine For Power Generation Market Segmentation
-
1. Plant Type
- 1.1. Gas
- 1.2. Coal
- 1.3. Other Plant Types (Nuclear, CHP, etc.)
-
2. Capacity
- 2.1. Below 40 MW
- 2.2. Above 40 MW
Steam Turbine For Power Generation Market Segmentation By Geography
-
1. North America
- 1.1. United States
- 1.2. Canada
- 1.3. Rest of North America
-
2. Asia Pacific
- 2.1. China
- 2.2. India
- 2.3. Japan
- 2.4. South Korea
- 2.5. Malaysia
- 2.6. Thailand
- 2.7. Indonesia
- 2.8. Vietnam
- 2.9. Rest of Asia Pacific
-
3. Europe
- 3.1. Germany
- 3.2. France
- 3.3. United Kingdom
- 3.4. Italy
- 3.5. Spain
- 3.6. NORDIC
- 3.7. Turkey
- 3.8. Russia
- 3.9. Rest of Europe
-
4. Middle East and Africa
- 4.1. Saudi Arabia
- 4.2. United Arab Emirates
- 4.3. South Africa
- 4.4. Qatar
- 4.5. Nigeria
- 4.6. Oman
- 4.7. Egypt
- 4.8. Algeria
- 4.9. Rest of Middle East and Africa
-
5. South America
- 5.1. Brazil
- 5.2. Argentina
- 5.3. Colombia
- 5.4. Rest of South America
Steam Turbine For Power Generation Market REPORT HIGHLIGHTS
| Aspects | Details |
|---|---|
| Study Period | 2019-2033 |
| Base Year | 2024 |
| Estimated Year | 2025 |
| Forecast Period | 2025-2033 |
| Historical Period | 2019-2024 |
| Growth Rate | CAGR of 3.49% from 2019-2033 |
| Segmentation |
|
Table of Contents
- 1. Introduction
- 1.1. Research Scope
- 1.2. Market Segmentation
- 1.3. Research Methodology
- 1.4. Definitions and Assumptions
- 2. Executive Summary
- 2.1. Introduction
- 3. Market Dynamics
- 3.1. Introduction
- 3.2. Market Drivers
- 3.2.1. 4.; Need for Continuous 24/7 Supply of Electricity 4.; Increasing Penetration of Natural Gas for Power Generation
- 3.3. Market Restrains
- 3.3.1. 4.; The Complex Maintenance Process of Components And the Emergence of Toxic Wastes that Affect the Environment
- 3.4. Market Trends
- 3.4.1. Natural Gas Plants to Witness Significant Growth
- 4. Market Factor Analysis
- 4.1. Porters Five Forces
- 4.2. Supply/Value Chain
- 4.3. PESTEL analysis
- 4.4. Market Entropy
- 4.5. Patent/Trademark Analysis
- 5. Global Steam Turbine For Power Generation Market Analysis, Insights and Forecast, 2019-2031
- 5.1. Market Analysis, Insights and Forecast - by Plant Type
- 5.1.1. Gas
- 5.1.2. Coal
- 5.1.3. Other Plant Types (Nuclear, CHP, etc.)
- 5.2. Market Analysis, Insights and Forecast - by Capacity
- 5.2.1. Below 40 MW
- 5.2.2. Above 40 MW
- 5.3. Market Analysis, Insights and Forecast - by Region
- 5.3.1. North America
- 5.3.2. Asia Pacific
- 5.3.3. Europe
- 5.3.4. Middle East and Africa
- 5.3.5. South America
- 5.1. Market Analysis, Insights and Forecast - by Plant Type
- 6. North America Steam Turbine For Power Generation Market Analysis, Insights and Forecast, 2019-2031
- 6.1. Market Analysis, Insights and Forecast - by Plant Type
- 6.1.1. Gas
- 6.1.2. Coal
- 6.1.3. Other Plant Types (Nuclear, CHP, etc.)
- 6.2. Market Analysis, Insights and Forecast - by Capacity
- 6.2.1. Below 40 MW
- 6.2.2. Above 40 MW
- 6.1. Market Analysis, Insights and Forecast - by Plant Type
- 7. Asia Pacific Steam Turbine For Power Generation Market Analysis, Insights and Forecast, 2019-2031
- 7.1. Market Analysis, Insights and Forecast - by Plant Type
- 7.1.1. Gas
- 7.1.2. Coal
- 7.1.3. Other Plant Types (Nuclear, CHP, etc.)
- 7.2. Market Analysis, Insights and Forecast - by Capacity
- 7.2.1. Below 40 MW
- 7.2.2. Above 40 MW
- 7.1. Market Analysis, Insights and Forecast - by Plant Type
- 8. Europe Steam Turbine For Power Generation Market Analysis, Insights and Forecast, 2019-2031
- 8.1. Market Analysis, Insights and Forecast - by Plant Type
- 8.1.1. Gas
- 8.1.2. Coal
- 8.1.3. Other Plant Types (Nuclear, CHP, etc.)
- 8.2. Market Analysis, Insights and Forecast - by Capacity
- 8.2.1. Below 40 MW
- 8.2.2. Above 40 MW
- 8.1. Market Analysis, Insights and Forecast - by Plant Type
- 9. Middle East and Africa Steam Turbine For Power Generation Market Analysis, Insights and Forecast, 2019-2031
- 9.1. Market Analysis, Insights and Forecast - by Plant Type
- 9.1.1. Gas
- 9.1.2. Coal
- 9.1.3. Other Plant Types (Nuclear, CHP, etc.)
- 9.2. Market Analysis, Insights and Forecast - by Capacity
- 9.2.1. Below 40 MW
- 9.2.2. Above 40 MW
- 9.1. Market Analysis, Insights and Forecast - by Plant Type
- 10. South America Steam Turbine For Power Generation Market Analysis, Insights and Forecast, 2019-2031
- 10.1. Market Analysis, Insights and Forecast - by Plant Type
- 10.1.1. Gas
- 10.1.2. Coal
- 10.1.3. Other Plant Types (Nuclear, CHP, etc.)
- 10.2. Market Analysis, Insights and Forecast - by Capacity
- 10.2.1. Below 40 MW
- 10.2.2. Above 40 MW
- 10.1. Market Analysis, Insights and Forecast - by Plant Type
- 11. North America Steam Turbine For Power Generation Market Analysis, Insights and Forecast, 2019-2031
- 11.1. Market Analysis, Insights and Forecast - By Country/Sub-region
- 11.1.1 United States
- 11.1.2 Canada
- 11.1.3 Rest of North America
- 12. Asia Pacific Steam Turbine For Power Generation Market Analysis, Insights and Forecast, 2019-2031
- 12.1. Market Analysis, Insights and Forecast - By Country/Sub-region
- 12.1.1 China
- 12.1.2 India
- 12.1.3 Japan
- 12.1.4 Rest of Asia Pacific
- 13. Europe Steam Turbine For Power Generation Market Analysis, Insights and Forecast, 2019-2031
- 13.1. Market Analysis, Insights and Forecast - By Country/Sub-region
- 13.1.1 Germany
- 13.1.2 France
- 13.1.3 United Kingdom
- 13.1.4 Italy
- 13.1.5 Rest of Europe
- 14. Middle East and Africa Steam Turbine For Power Generation Market Analysis, Insights and Forecast, 2019-2031
- 14.1. Market Analysis, Insights and Forecast - By Country/Sub-region
- 14.1.1 Saudi Arabia
- 14.1.2 United Arab Emirates
- 14.1.3 South Africa
- 14.1.4 Qatar
- 15. South America Steam Turbine For Power Generation Market Analysis, Insights and Forecast, 2019-2031
- 15.1. Market Analysis, Insights and Forecast - By Country/Sub-region
- 15.1.1 Brazil
- 15.1.2 Argentina
- 15.1.3 Rest of South America
- 16. Competitive Analysis
- 16.1. Global Market Share Analysis 2024
- 16.2. Company Profiles
- 16.2.1 Mitsubishi Heavy Industries Limited
- 16.2.1.1. Overview
- 16.2.1.2. Products
- 16.2.1.3. SWOT Analysis
- 16.2.1.4. Recent Developments
- 16.2.1.5. Financials (Based on Availability)
- 16.2.2 MAN Energy Solutions SE*List Not Exhaustive
- 16.2.2.1. Overview
- 16.2.2.2. Products
- 16.2.2.3. SWOT Analysis
- 16.2.2.4. Recent Developments
- 16.2.2.5. Financials (Based on Availability)
- 16.2.3 Toshiba Corporation
- 16.2.3.1. Overview
- 16.2.3.2. Products
- 16.2.3.3. SWOT Analysis
- 16.2.3.4. Recent Developments
- 16.2.3.5. Financials (Based on Availability)
- 16.2.4 Dongfang Turbine Company Limited
- 16.2.4.1. Overview
- 16.2.4.2. Products
- 16.2.4.3. SWOT Analysis
- 16.2.4.4. Recent Developments
- 16.2.4.5. Financials (Based on Availability)
- 16.2.5 Elliot Group
- 16.2.5.1. Overview
- 16.2.5.2. Products
- 16.2.5.3. SWOT Analysis
- 16.2.5.4. Recent Developments
- 16.2.5.5. Financials (Based on Availability)
- 16.2.6 Bharat Heavy Electricals Limited
- 16.2.6.1. Overview
- 16.2.6.2. Products
- 16.2.6.3. SWOT Analysis
- 16.2.6.4. Recent Developments
- 16.2.6.5. Financials (Based on Availability)
- 16.2.7 WEG S A
- 16.2.7.1. Overview
- 16.2.7.2. Products
- 16.2.7.3. SWOT Analysis
- 16.2.7.4. Recent Developments
- 16.2.7.5. Financials (Based on Availability)
- 16.2.8 Doosan Enerbility Co Ltd
- 16.2.8.1. Overview
- 16.2.8.2. Products
- 16.2.8.3. SWOT Analysis
- 16.2.8.4. Recent Developments
- 16.2.8.5. Financials (Based on Availability)
- 16.2.9 Siemens Energy AG
- 16.2.9.1. Overview
- 16.2.9.2. Products
- 16.2.9.3. SWOT Analysis
- 16.2.9.4. Recent Developments
- 16.2.9.5. Financials (Based on Availability)
- 16.2.10 General Electric Company
- 16.2.10.1. Overview
- 16.2.10.2. Products
- 16.2.10.3. SWOT Analysis
- 16.2.10.4. Recent Developments
- 16.2.10.5. Financials (Based on Availability)
- 16.2.1 Mitsubishi Heavy Industries Limited
List of Figures
- Figure 1: Global Steam Turbine For Power Generation Market Revenue Breakdown (Million, %) by Region 2024 & 2032
- Figure 2: North America Steam Turbine For Power Generation Market Revenue (Million), by Country 2024 & 2032
- Figure 3: North America Steam Turbine For Power Generation Market Revenue Share (%), by Country 2024 & 2032
- Figure 4: Asia Pacific Steam Turbine For Power Generation Market Revenue (Million), by Country 2024 & 2032
- Figure 5: Asia Pacific Steam Turbine For Power Generation Market Revenue Share (%), by Country 2024 & 2032
- Figure 6: Europe Steam Turbine For Power Generation Market Revenue (Million), by Country 2024 & 2032
- Figure 7: Europe Steam Turbine For Power Generation Market Revenue Share (%), by Country 2024 & 2032
- Figure 8: Middle East and Africa Steam Turbine For Power Generation Market Revenue (Million), by Country 2024 & 2032
- Figure 9: Middle East and Africa Steam Turbine For Power Generation Market Revenue Share (%), by Country 2024 & 2032
- Figure 10: South America Steam Turbine For Power Generation Market Revenue (Million), by Country 2024 & 2032
- Figure 11: South America Steam Turbine For Power Generation Market Revenue Share (%), by Country 2024 & 2032
- Figure 12: North America Steam Turbine For Power Generation Market Revenue (Million), by Plant Type 2024 & 2032
- Figure 13: North America Steam Turbine For Power Generation Market Revenue Share (%), by Plant Type 2024 & 2032
- Figure 14: North America Steam Turbine For Power Generation Market Revenue (Million), by Capacity 2024 & 2032
- Figure 15: North America Steam Turbine For Power Generation Market Revenue Share (%), by Capacity 2024 & 2032
- Figure 16: North America Steam Turbine For Power Generation Market Revenue (Million), by Country 2024 & 2032
- Figure 17: North America Steam Turbine For Power Generation Market Revenue Share (%), by Country 2024 & 2032
- Figure 18: Asia Pacific Steam Turbine For Power Generation Market Revenue (Million), by Plant Type 2024 & 2032
- Figure 19: Asia Pacific Steam Turbine For Power Generation Market Revenue Share (%), by Plant Type 2024 & 2032
- Figure 20: Asia Pacific Steam Turbine For Power Generation Market Revenue (Million), by Capacity 2024 & 2032
- Figure 21: Asia Pacific Steam Turbine For Power Generation Market Revenue Share (%), by Capacity 2024 & 2032
- Figure 22: Asia Pacific Steam Turbine For Power Generation Market Revenue (Million), by Country 2024 & 2032
- Figure 23: Asia Pacific Steam Turbine For Power Generation Market Revenue Share (%), by Country 2024 & 2032
- Figure 24: Europe Steam Turbine For Power Generation Market Revenue (Million), by Plant Type 2024 & 2032
- Figure 25: Europe Steam Turbine For Power Generation Market Revenue Share (%), by Plant Type 2024 & 2032
- Figure 26: Europe Steam Turbine For Power Generation Market Revenue (Million), by Capacity 2024 & 2032
- Figure 27: Europe Steam Turbine For Power Generation Market Revenue Share (%), by Capacity 2024 & 2032
- Figure 28: Europe Steam Turbine For Power Generation Market Revenue (Million), by Country 2024 & 2032
- Figure 29: Europe Steam Turbine For Power Generation Market Revenue Share (%), by Country 2024 & 2032
- Figure 30: Middle East and Africa Steam Turbine For Power Generation Market Revenue (Million), by Plant Type 2024 & 2032
- Figure 31: Middle East and Africa Steam Turbine For Power Generation Market Revenue Share (%), by Plant Type 2024 & 2032
- Figure 32: Middle East and Africa Steam Turbine For Power Generation Market Revenue (Million), by Capacity 2024 & 2032
- Figure 33: Middle East and Africa Steam Turbine For Power Generation Market Revenue Share (%), by Capacity 2024 & 2032
- Figure 34: Middle East and Africa Steam Turbine For Power Generation Market Revenue (Million), by Country 2024 & 2032
- Figure 35: Middle East and Africa Steam Turbine For Power Generation Market Revenue Share (%), by Country 2024 & 2032
- Figure 36: South America Steam Turbine For Power Generation Market Revenue (Million), by Plant Type 2024 & 2032
- Figure 37: South America Steam Turbine For Power Generation Market Revenue Share (%), by Plant Type 2024 & 2032
- Figure 38: South America Steam Turbine For Power Generation Market Revenue (Million), by Capacity 2024 & 2032
- Figure 39: South America Steam Turbine For Power Generation Market Revenue Share (%), by Capacity 2024 & 2032
- Figure 40: South America Steam Turbine For Power Generation Market Revenue (Million), by Country 2024 & 2032
- Figure 41: South America Steam Turbine For Power Generation Market Revenue Share (%), by Country 2024 & 2032
List of Tables
- Table 1: Global Steam Turbine For Power Generation Market Revenue Million Forecast, by Region 2019 & 2032
- Table 2: Global Steam Turbine For Power Generation Market Revenue Million Forecast, by Plant Type 2019 & 2032
- Table 3: Global Steam Turbine For Power Generation Market Revenue Million Forecast, by Capacity 2019 & 2032
- Table 4: Global Steam Turbine For Power Generation Market Revenue Million Forecast, by Region 2019 & 2032
- Table 5: Global Steam Turbine For Power Generation Market Revenue Million Forecast, by Country 2019 & 2032
- Table 6: United States Steam Turbine For Power Generation Market Revenue (Million) Forecast, by Application 2019 & 2032
- Table 7: Canada Steam Turbine For Power Generation Market Revenue (Million) Forecast, by Application 2019 & 2032
- Table 8: Rest of North America Steam Turbine For Power Generation Market Revenue (Million) Forecast, by Application 2019 & 2032
- Table 9: Global Steam Turbine For Power Generation Market Revenue Million Forecast, by Country 2019 & 2032
- Table 10: China Steam Turbine For Power Generation Market Revenue (Million) Forecast, by Application 2019 & 2032
- Table 11: India Steam Turbine For Power Generation Market Revenue (Million) Forecast, by Application 2019 & 2032
- Table 12: Japan Steam Turbine For Power Generation Market Revenue (Million) Forecast, by Application 2019 & 2032
- Table 13: Rest of Asia Pacific Steam Turbine For Power Generation Market Revenue (Million) Forecast, by Application 2019 & 2032
- Table 14: Global Steam Turbine For Power Generation Market Revenue Million Forecast, by Country 2019 & 2032
- Table 15: Germany Steam Turbine For Power Generation Market Revenue (Million) Forecast, by Application 2019 & 2032
- Table 16: France Steam Turbine For Power Generation Market Revenue (Million) Forecast, by Application 2019 & 2032
- Table 17: United Kingdom Steam Turbine For Power Generation Market Revenue (Million) Forecast, by Application 2019 & 2032
- Table 18: Italy Steam Turbine For Power Generation Market Revenue (Million) Forecast, by Application 2019 & 2032
- Table 19: Rest of Europe Steam Turbine For Power Generation Market Revenue (Million) Forecast, by Application 2019 & 2032
- Table 20: Global Steam Turbine For Power Generation Market Revenue Million Forecast, by Country 2019 & 2032
- Table 21: Saudi Arabia Steam Turbine For Power Generation Market Revenue (Million) Forecast, by Application 2019 & 2032
- Table 22: United Arab Emirates Steam Turbine For Power Generation Market Revenue (Million) Forecast, by Application 2019 & 2032
- Table 23: South Africa Steam Turbine For Power Generation Market Revenue (Million) Forecast, by Application 2019 & 2032
- Table 24: Qatar Steam Turbine For Power Generation Market Revenue (Million) Forecast, by Application 2019 & 2032
- Table 25: Global Steam Turbine For Power Generation Market Revenue Million Forecast, by Country 2019 & 2032
- Table 26: Brazil Steam Turbine For Power Generation Market Revenue (Million) Forecast, by Application 2019 & 2032
- Table 27: Argentina Steam Turbine For Power Generation Market Revenue (Million) Forecast, by Application 2019 & 2032
- Table 28: Rest of South America Steam Turbine For Power Generation Market Revenue (Million) Forecast, by Application 2019 & 2032
- Table 29: Global Steam Turbine For Power Generation Market Revenue Million Forecast, by Plant Type 2019 & 2032
- Table 30: Global Steam Turbine For Power Generation Market Revenue Million Forecast, by Capacity 2019 & 2032
- Table 31: Global Steam Turbine For Power Generation Market Revenue Million Forecast, by Country 2019 & 2032
- Table 32: United States Steam Turbine For Power Generation Market Revenue (Million) Forecast, by Application 2019 & 2032
- Table 33: Canada Steam Turbine For Power Generation Market Revenue (Million) Forecast, by Application 2019 & 2032
- Table 34: Rest of North America Steam Turbine For Power Generation Market Revenue (Million) Forecast, by Application 2019 & 2032
- Table 35: Global Steam Turbine For Power Generation Market Revenue Million Forecast, by Plant Type 2019 & 2032
- Table 36: Global Steam Turbine For Power Generation Market Revenue Million Forecast, by Capacity 2019 & 2032
- Table 37: Global Steam Turbine For Power Generation Market Revenue Million Forecast, by Country 2019 & 2032
- Table 38: China Steam Turbine For Power Generation Market Revenue (Million) Forecast, by Application 2019 & 2032
- Table 39: India Steam Turbine For Power Generation Market Revenue (Million) Forecast, by Application 2019 & 2032
- Table 40: Japan Steam Turbine For Power Generation Market Revenue (Million) Forecast, by Application 2019 & 2032
- Table 41: South Korea Steam Turbine For Power Generation Market Revenue (Million) Forecast, by Application 2019 & 2032
- Table 42: Malaysia Steam Turbine For Power Generation Market Revenue (Million) Forecast, by Application 2019 & 2032
- Table 43: Thailand Steam Turbine For Power Generation Market Revenue (Million) Forecast, by Application 2019 & 2032
- Table 44: Indonesia Steam Turbine For Power Generation Market Revenue (Million) Forecast, by Application 2019 & 2032
- Table 45: Vietnam Steam Turbine For Power Generation Market Revenue (Million) Forecast, by Application 2019 & 2032
- Table 46: Rest of Asia Pacific Steam Turbine For Power Generation Market Revenue (Million) Forecast, by Application 2019 & 2032
- Table 47: Global Steam Turbine For Power Generation Market Revenue Million Forecast, by Plant Type 2019 & 2032
- Table 48: Global Steam Turbine For Power Generation Market Revenue Million Forecast, by Capacity 2019 & 2032
- Table 49: Global Steam Turbine For Power Generation Market Revenue Million Forecast, by Country 2019 & 2032
- Table 50: Germany Steam Turbine For Power Generation Market Revenue (Million) Forecast, by Application 2019 & 2032
- Table 51: France Steam Turbine For Power Generation Market Revenue (Million) Forecast, by Application 2019 & 2032
- Table 52: United Kingdom Steam Turbine For Power Generation Market Revenue (Million) Forecast, by Application 2019 & 2032
- Table 53: Italy Steam Turbine For Power Generation Market Revenue (Million) Forecast, by Application 2019 & 2032
- Table 54: Spain Steam Turbine For Power Generation Market Revenue (Million) Forecast, by Application 2019 & 2032
- Table 55: NORDIC Steam Turbine For Power Generation Market Revenue (Million) Forecast, by Application 2019 & 2032
- Table 56: Turkey Steam Turbine For Power Generation Market Revenue (Million) Forecast, by Application 2019 & 2032
- Table 57: Russia Steam Turbine For Power Generation Market Revenue (Million) Forecast, by Application 2019 & 2032
- Table 58: Rest of Europe Steam Turbine For Power Generation Market Revenue (Million) Forecast, by Application 2019 & 2032
- Table 59: Global Steam Turbine For Power Generation Market Revenue Million Forecast, by Plant Type 2019 & 2032
- Table 60: Global Steam Turbine For Power Generation Market Revenue Million Forecast, by Capacity 2019 & 2032
- Table 61: Global Steam Turbine For Power Generation Market Revenue Million Forecast, by Country 2019 & 2032
- Table 62: Saudi Arabia Steam Turbine For Power Generation Market Revenue (Million) Forecast, by Application 2019 & 2032
- Table 63: United Arab Emirates Steam Turbine For Power Generation Market Revenue (Million) Forecast, by Application 2019 & 2032
- Table 64: South Africa Steam Turbine For Power Generation Market Revenue (Million) Forecast, by Application 2019 & 2032
- Table 65: Qatar Steam Turbine For Power Generation Market Revenue (Million) Forecast, by Application 2019 & 2032
- Table 66: Nigeria Steam Turbine For Power Generation Market Revenue (Million) Forecast, by Application 2019 & 2032
- Table 67: Oman Steam Turbine For Power Generation Market Revenue (Million) Forecast, by Application 2019 & 2032
- Table 68: Egypt Steam Turbine For Power Generation Market Revenue (Million) Forecast, by Application 2019 & 2032
- Table 69: Algeria Steam Turbine For Power Generation Market Revenue (Million) Forecast, by Application 2019 & 2032
- Table 70: Rest of Middle East and Africa Steam Turbine For Power Generation Market Revenue (Million) Forecast, by Application 2019 & 2032
- Table 71: Global Steam Turbine For Power Generation Market Revenue Million Forecast, by Plant Type 2019 & 2032
- Table 72: Global Steam Turbine For Power Generation Market Revenue Million Forecast, by Capacity 2019 & 2032
- Table 73: Global Steam Turbine For Power Generation Market Revenue Million Forecast, by Country 2019 & 2032
- Table 74: Brazil Steam Turbine For Power Generation Market Revenue (Million) Forecast, by Application 2019 & 2032
- Table 75: Argentina Steam Turbine For Power Generation Market Revenue (Million) Forecast, by Application 2019 & 2032
- Table 76: Colombia Steam Turbine For Power Generation Market Revenue (Million) Forecast, by Application 2019 & 2032
- Table 77: Rest of South America Steam Turbine For Power Generation Market Revenue (Million) Forecast, by Application 2019 & 2032
Frequently Asked Questions
1. What is the projected Compound Annual Growth Rate (CAGR) of the Steam Turbine For Power Generation Market?
The projected CAGR is approximately 3.49%.
2. Which companies are prominent players in the Steam Turbine For Power Generation Market?
Key companies in the market include Mitsubishi Heavy Industries Limited, MAN Energy Solutions SE*List Not Exhaustive, Toshiba Corporation, Dongfang Turbine Company Limited, Elliot Group, Bharat Heavy Electricals Limited, WEG S A, Doosan Enerbility Co Ltd, Siemens Energy AG, General Electric Company.
3. What are the main segments of the Steam Turbine For Power Generation Market?
The market segments include Plant Type, Capacity.
4. Can you provide details about the market size?
The market size is estimated to be USD 15.45 Million as of 2022.
5. What are some drivers contributing to market growth?
4.; Need for Continuous 24/7 Supply of Electricity 4.; Increasing Penetration of Natural Gas for Power Generation.
6. What are the notable trends driving market growth?
Natural Gas Plants to Witness Significant Growth.
7. Are there any restraints impacting market growth?
4.; The Complex Maintenance Process of Components And the Emergence of Toxic Wastes that Affect the Environment.
8. Can you provide examples of recent developments in the market?
April 2023: Doosan Koda Power was awarded a contract to supply a steam turbine to the South Clyde Energy Centre, a Scottish energy-from-waste (EfW) facility. When completed, this new facility will likely power 70,000 homes. Commercial operations will begin in 2025, with Scotland's ban on landfilling biodegradable municipal garbage.
9. What pricing options are available for accessing the report?
Pricing options include single-user, multi-user, and enterprise licenses priced at USD 4750, USD 5250, and USD 8750 respectively.
10. Is the market size provided in terms of value or volume?
The market size is provided in terms of value, measured in Million.
11. Are there any specific market keywords associated with the report?
Yes, the market keyword associated with the report is "Steam Turbine For Power Generation Market," which aids in identifying and referencing the specific market segment covered.
12. How do I determine which pricing option suits my needs best?
The pricing options vary based on user requirements and access needs. Individual users may opt for single-user licenses, while businesses requiring broader access may choose multi-user or enterprise licenses for cost-effective access to the report.
13. Are there any additional resources or data provided in the Steam Turbine For Power Generation Market report?
While the report offers comprehensive insights, it's advisable to review the specific contents or supplementary materials provided to ascertain if additional resources or data are available.
14. How can I stay updated on further developments or reports in the Steam Turbine For Power Generation Market?
To stay informed about further developments, trends, and reports in the Steam Turbine For Power Generation Market, consider subscribing to industry newsletters, following relevant companies and organizations, or regularly checking reputable industry news sources and publications.
Methodology
Step 1 - Identification of Relevant Samples Size from Population Database


Step 2 - Approaches for Defining Global Market Size (Value, Volume* & Price*)

Note*: In applicable scenarios
Step 3 - Data Sources
Primary Research
- Web Analytics
- Survey Reports
- Research Institute
- Latest Research Reports
- Opinion Leaders
Secondary Research
- Annual Reports
- White Paper
- Latest Press Release
- Industry Association
- Paid Database
- Investor Presentations

Step 4 - Data Triangulation
Involves using different sources of information in order to increase the validity of a study
These sources are likely to be stakeholders in a program - participants, other researchers, program staff, other community members, and so on.
Then we put all data in single framework & apply various statistical tools to find out the dynamic on the market.
During the analysis stage, feedback from the stakeholder groups would be compared to determine areas of agreement as well as areas of divergence


