

Key Insights
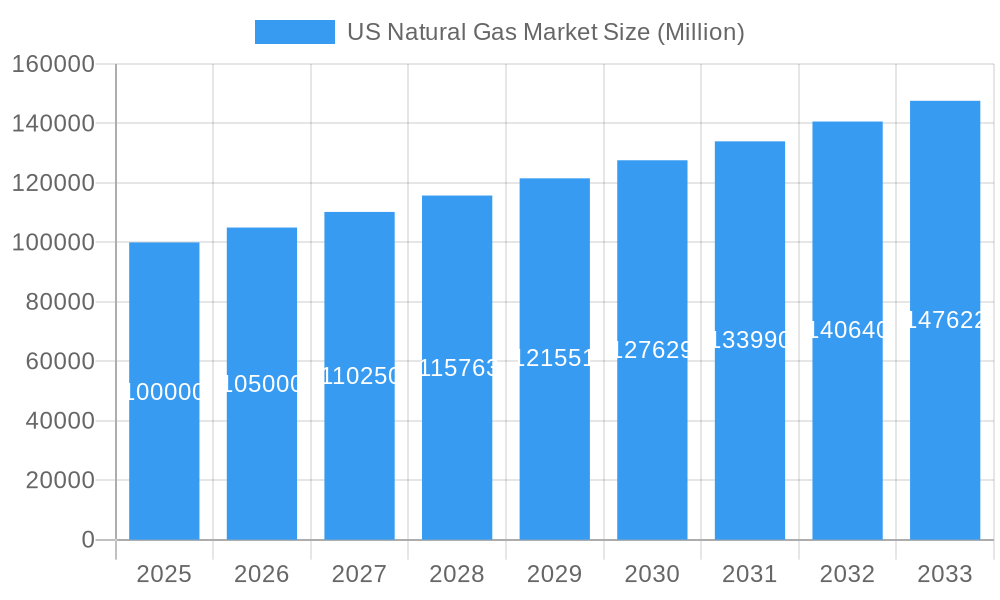
The U.S. natural gas market, valued at approximately $473.4 billion in 2025, is projected for significant expansion with a compound annual growth rate (CAGR) of 3.5% from 2025 to 2033. This growth is primarily propelled by escalating demand in the power generation sector, driven by the shift from coal and the competitive pricing of natural gas. The increasing adoption of compressed natural gas (CNG) vehicles in the automotive sector, while currently nascent, represents a notable avenue for expansion. Sustained demand from residential and industrial consumers further underpins market growth. The market is comprehensively segmented by gas type (wet and dry natural gas) and end-use sectors (power generation, automotive, residential, and industrial), facilitating in-depth market analysis. Leading entities such as Occidental Petroleum, Shell, and ExxonMobil are strategically positioned to leverage this growth through investments in exploration, production, and infrastructure. Regional dynamics, including the Northeast, Southeast, Midwest, Southwest, and West, exhibit distinct growth patterns influenced by regulatory environments, infrastructure development, and industrial activity.
US Natural Gas Market Market Size (In Billion)
Despite positive growth projections, the market faces potential headwinds. Environmental considerations, particularly concerning methane emissions, and the increasing prominence of renewable energy sources pose restraint factors. Furthermore, evolving regulatory frameworks and price volatility in natural gas markets introduce inherent risks. Market participants must adopt a comprehensive strategy to mitigate these challenges, focusing on clean technology adoption, infrastructure enhancement, and adaptability to regulatory shifts. The long-term outlook remains optimistic, reinforcing natural gas's role as a critical transitional fuel. The anticipated growth signifies substantial investment potential, particularly within the power generation and industrial application segments.
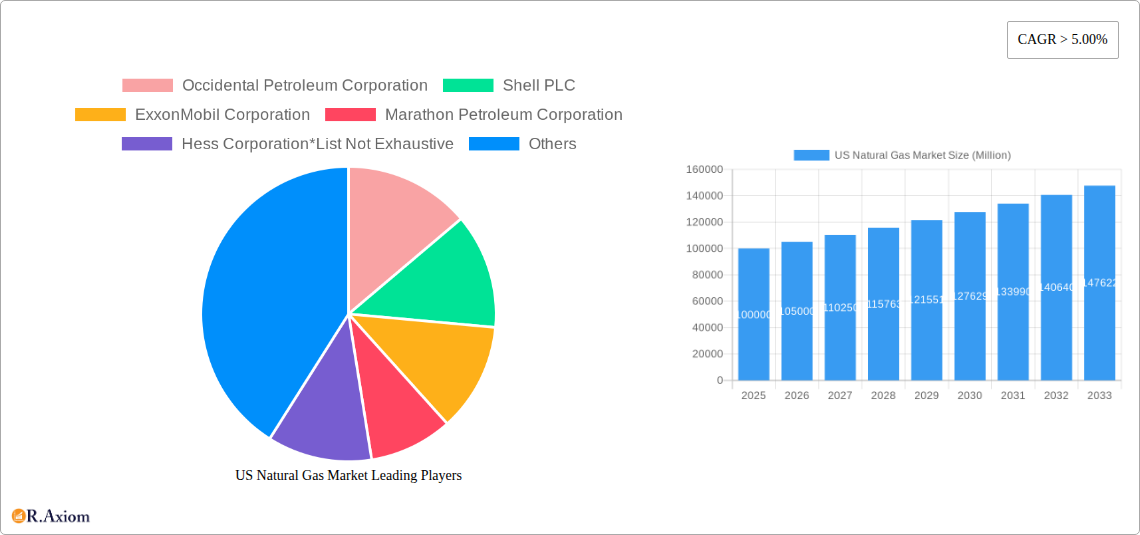
US Natural Gas Market Company Market Share
US Natural Gas Market: A Comprehensive Report (2019-2033)
This detailed report provides a comprehensive analysis of the US Natural Gas Market from 2019 to 2033, covering market size, segmentation, key players, industry trends, and future outlook. The study period spans 2019-2024 (historical period), with 2025 serving as the base and estimated year, and a forecast period of 2025-2033. This report is essential for industry stakeholders, investors, and policymakers seeking actionable insights into this dynamic market.
US Natural Gas Market Market Concentration & Innovation
This section analyzes the competitive landscape of the US Natural Gas market, encompassing market concentration, innovation drivers, regulatory influences, substitute products, end-user trends, and merger and acquisition (M&A) activity. The market is characterized by a moderately concentrated structure, with several major players holding significant market share. However, a considerable number of smaller companies also contribute to the overall market.
- Market Concentration: The top 10 companies account for approximately xx% of the total market share in 2024. This concentration is likely to remain relatively stable over the forecast period, though smaller players might experience growth through innovation and strategic acquisitions.
- Innovation Drivers: Technological advancements in exploration and production (E&P) technologies, such as horizontal drilling and hydraulic fracturing, are driving efficiency and cost reductions. Furthermore, the development of innovative pipeline infrastructure and liquefied natural gas (LNG) export facilities is boosting the industry’s competitiveness in the global market.
- Regulatory Framework: Government regulations concerning environmental protection, pipeline safety, and pricing mechanisms significantly impact market operations. Changes in these regulations can influence investment decisions and overall market dynamics.
- Product Substitutes: Renewable energy sources, such as solar and wind power, pose a growing competitive threat to natural gas, especially in the electricity generation sector. However, natural gas continues to hold a crucial role in providing reliable baseload power due to its flexibility and relatively low cost.
- End-User Trends: The demand for natural gas is driven by various sectors, including power generation (the largest segment), residential heating, industrial processes, and transportation. Future trends will depend on the growth of renewable energy and the adoption of electric vehicles.
- M&A Activity: The US natural gas sector has witnessed significant M&A activity in recent years, with large players consolidating their market positions through strategic acquisitions. Deal values have fluctuated, with larger deals typically exceeding xx Million. These M&A activities aim to expand reserves, optimize operations, and enhance market share.
US Natural Gas Market Industry Trends & Insights
This section explores major trends and insights shaping the US Natural Gas market. The market exhibits a robust growth trajectory, driven by factors such as the increasing demand for energy, the relatively low cost of natural gas compared to other fossil fuels, and the government’s support for infrastructure development.
The market is expected to witness a Compound Annual Growth Rate (CAGR) of xx% during the forecast period (2025-2033). Technological disruptions, such as the development of more efficient extraction techniques and improvements in pipeline infrastructure, are enhancing production efficiency and reducing costs. Consumer preferences are also evolving, with a greater emphasis on environmentally responsible energy sources, posing challenges and opportunities for the industry. Competitive dynamics are intense, with companies investing heavily in R&D to develop innovative technologies and optimize production processes. Market penetration of natural gas in different end-use sectors varies significantly, with power generation maintaining a dominant position.
Dominant Markets & Segments in US Natural Gas Market
This section identifies the leading regions, countries, and segments within the US natural gas market, focusing on the types (Wet and Dry Natural Gas) and end-uses (Power Generation, Automotive, Residential, and Industries).
Dominant Segments:
- Type: Dry natural gas currently holds the largest market share, driven by its wider application in various sectors. However, wet natural gas is also expected to see growth due to increasing demand for natural gas liquids (NGLs).
- End Use: Power Generation is the dominant end-use segment, owing to natural gas's role as a reliable and relatively clean-burning fuel source for electricity generation.
Key Drivers of Segment Dominance:
- Power Generation: Strong demand for electricity, coupled with the relatively lower greenhouse gas emissions compared to coal, propels this sector's growth.
- Industrial: Natural gas plays a crucial role in numerous industrial processes, including fertilizer production, metal manufacturing, and chemical processing. Economic activity and industrial expansion directly drive the natural gas demand within this segment.
- Residential: Natural gas serves as a primary heating fuel in many US households, particularly in colder regions. Population growth and the ongoing reliance on natural gas heating contribute to demand in this segment.
- Automotive: While currently a smaller segment, natural gas vehicles are gaining traction as concerns around air quality increase, making this segment a promising area for future growth.
US Natural Gas Market Product Developments
The US natural gas market witnesses continuous product innovations, primarily focused on enhancing extraction and transportation efficiency. Technological advancements in horizontal drilling and hydraulic fracturing have significantly boosted production volumes. Further innovations include improved pipeline technologies that minimize leakages and enhance safety. These developments increase the overall competitiveness of natural gas compared to alternative energy sources.
Report Scope & Segmentation Analysis
This report comprehensively segments the US Natural Gas Market by type (Wet Natural Gas and Dry Natural Gas) and end-use (Power Generation, Automotive, Residential, and Industries). Each segment is analyzed in detail, including market size, growth projections, and competitive dynamics. Dry natural gas holds a larger market share compared to wet natural gas, primarily due to its wider applicability across various end-use sectors. The power generation sector dominates the end-use segment, driven by robust electricity demand and the relative cleanliness of natural gas combustion. The other segments—automotive, residential, and industrial—also contribute significantly to the overall market size, each with its specific growth drivers and challenges.
Key Drivers of US Natural Gas Market Growth
Several factors drive the growth of the US Natural Gas Market. Firstly, the ongoing demand for energy fuels this market's expansion. Secondly, the comparatively lower cost of natural gas compared to other fossil fuels increases its attractiveness to both consumers and industries. Lastly, government support for infrastructure development further boosts growth by improving extraction and transportation capabilities.
Challenges in the US Natural Gas Market Sector
The US Natural Gas Market faces several challenges. Regulatory hurdles related to environmental protection and pipeline safety regulations significantly influence market dynamics. Supply chain disruptions and fluctuations in natural gas prices also impact market stability. Lastly, increasing competition from renewable energy sources puts pressure on the industry to enhance its competitiveness and adopt sustainable practices. These challenges can lead to decreased profitability and potentially hinder the market's growth trajectory.
Emerging Opportunities in US Natural Gas Market
The US Natural Gas Market presents numerous opportunities. The growing demand for cleaner energy sources offers opportunities for natural gas as a transition fuel. Technological advancements, such as improved extraction techniques and carbon capture technologies, are expected to enhance the industry's environmental performance. Furthermore, the expansion of natural gas infrastructure, including LNG export terminals, creates new market access and enhances international competitiveness. These factors could significantly improve the long-term prospects of the US Natural Gas Market.
Leading Players in the US Natural Gas Market Market
- Occidental Petroleum Corporation
- Shell PLC
- ExxonMobil Corporation
- Marathon Petroleum Corporation
- Hess Corporation
- ConocoPhillips
- Chevron Corporation
- TotalEnergies SE
- Phillips
- EOG Resources Inc
Key Developments in US Natural Gas Market Industry
- May 2022: The US Energy Information Administration updated the Natural Gas Pipeline Project Tracker, noting FERC's approval of three projects to boost natural gas export via pipelines and LNG. Two projects connect LNG terminals in Louisiana; the Evangeline Pass Expansion Project (1.1 Billion cubic feet) and the Plaquemines LNG Project (13.1 miles of new pipeline and two compressor stations). These developments significantly enhance US natural gas export capacity.
- April 2022: TotalEnergies signed a Heads of Agreement to expand the Cameron LNG facility in Louisiana. This expansion includes a fourth train (6.75 Million metric tons per annum capacity) and a 5% production increase from the first three trains. This expansion demonstrates the continued investment in LNG export capacity and signifies a robust outlook for the US natural gas market.
Strategic Outlook for US Natural Gas Market Market
The US Natural Gas Market is poised for continued growth, driven by several key factors. The persistent demand for energy, particularly in power generation and industrial applications, will drive market expansion. Further developments in extraction technologies and infrastructure improvements will enhance production and transportation efficiency. While challenges exist, the strategic positioning of natural gas as a transition fuel and the exploration of innovative solutions like carbon capture technology suggest a promising outlook for the market in the coming years. The industry's focus on innovation and adaptation to environmental concerns will be crucial to navigating future challenges and capitalizing on the significant growth opportunities.
US Natural Gas Market Segmentation
-
1. Type
- 1.1. Wet Natural Gas
- 1.2. Dry Natural Gas
-
2. End Use
- 2.1. Power Generation
- 2.2. Automotive
- 2.3. Residential
- 2.4. Industries
US Natural Gas Market Segmentation By Geography
-
1. North America
- 1.1. United States
- 1.2. Canada
- 1.3. Mexico
-
2. South America
- 2.1. Brazil
- 2.2. Argentina
- 2.3. Rest of South America
-
3. Europe
- 3.1. United Kingdom
- 3.2. Germany
- 3.3. France
- 3.4. Italy
- 3.5. Spain
- 3.6. Russia
- 3.7. Benelux
- 3.8. Nordics
- 3.9. Rest of Europe
-
4. Middle East & Africa
- 4.1. Turkey
- 4.2. Israel
- 4.3. GCC
- 4.4. North Africa
- 4.5. South Africa
- 4.6. Rest of Middle East & Africa
-
5. Asia Pacific
- 5.1. China
- 5.2. India
- 5.3. Japan
- 5.4. South Korea
- 5.5. ASEAN
- 5.6. Oceania
- 5.7. Rest of Asia Pacific
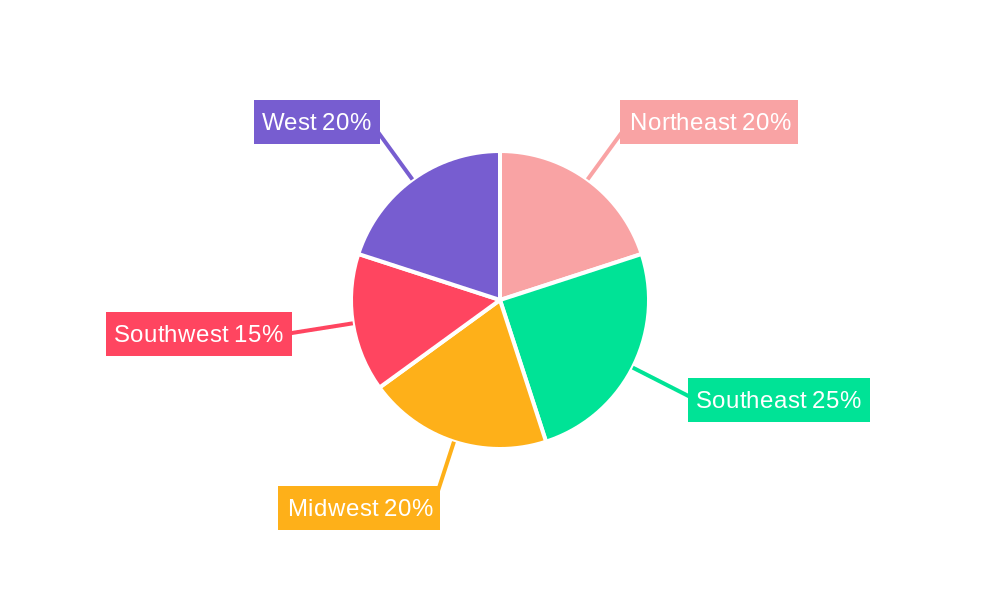
US Natural Gas Market Regional Market Share
Geographic Coverage of US Natural Gas Market
US Natural Gas Market REPORT HIGHLIGHTS
| Aspects | Details |
|---|---|
| Study Period | 2020-2034 |
| Base Year | 2025 |
| Estimated Year | 2026 |
| Forecast Period | 2026-2034 |
| Historical Period | 2020-2025 |
| Growth Rate | CAGR of 3.5% from 2020-2034 |
| Segmentation |
|
Table of Contents
- 1. Introduction
- 1.1. Research Scope
- 1.2. Market Segmentation
- 1.3. Research Objective
- 1.4. Definitions and Assumptions
- 2. Executive Summary
- 2.1. Market Snapshot
- 3. Market Dynamics
- 3.1. Market Drivers
- 3.2. Market Restrains
- 3.3. Market Trends
- 3.4. Market Opportunities
- 4. Market Factor Analysis
- 4.1. Porters Five Forces
- 4.1.1. Bargaining Power of Suppliers
- 4.1.2. Bargaining Power of Buyers
- 4.1.3. Threat of New Entrants
- 4.1.4. Threat of Substitutes
- 4.1.5. Competitive Rivalry
- 4.2. PESTEL analysis
- 4.3. BCG Analysis
- 4.3.1. Stars (High Growth, High Market Share)
- 4.3.2. Cash Cows (Low Growth, High Market Share)
- 4.3.3. Question Mark (High Growth, Low Market Share)
- 4.3.4. Dogs (Low Growth, Low Market Share)
- 4.4. Ansoff Matrix Analysis
- 4.5. Supply Chain Analysis
- 4.6. Regulatory Landscape
- 4.7. Current Market Potential and Opportunity Assessment (TAM–SAM–SOM Framework)
- 4.8. RAX Analyst Note
- 4.1. Porters Five Forces
- 5. Market Analysis, Insights and Forecast 2021-2033
- 5.1. Market Analysis, Insights and Forecast - by Type
- 5.1.1. Wet Natural Gas
- 5.1.2. Dry Natural Gas
- 5.2. Market Analysis, Insights and Forecast - by End Use
- 5.2.1. Power Generation
- 5.2.2. Automotive
- 5.2.3. Residential
- 5.2.4. Industries
- 5.3. Market Analysis, Insights and Forecast - by Region
- 5.3.1. North America
- 5.3.2. South America
- 5.3.3. Europe
- 5.3.4. Middle East & Africa
- 5.3.5. Asia Pacific
- 5.1. Market Analysis, Insights and Forecast - by Type
- 6. Global US Natural Gas Market Analysis, Insights and Forecast, 2021-2033
- 6.1. Market Analysis, Insights and Forecast - by Type
- 6.1.1. Wet Natural Gas
- 6.1.2. Dry Natural Gas
- 6.2. Market Analysis, Insights and Forecast - by End Use
- 6.2.1. Power Generation
- 6.2.2. Automotive
- 6.2.3. Residential
- 6.2.4. Industries
- 6.1. Market Analysis, Insights and Forecast - by Type
- 7. North America US Natural Gas Market Analysis, Insights and Forecast, 2020-2032
- 7.1. Market Analysis, Insights and Forecast - by Type
- 7.1.1. Wet Natural Gas
- 7.1.2. Dry Natural Gas
- 7.2. Market Analysis, Insights and Forecast - by End Use
- 7.2.1. Power Generation
- 7.2.2. Automotive
- 7.2.3. Residential
- 7.2.4. Industries
- 7.1. Market Analysis, Insights and Forecast - by Type
- 8. South America US Natural Gas Market Analysis, Insights and Forecast, 2020-2032
- 8.1. Market Analysis, Insights and Forecast - by Type
- 8.1.1. Wet Natural Gas
- 8.1.2. Dry Natural Gas
- 8.2. Market Analysis, Insights and Forecast - by End Use
- 8.2.1. Power Generation
- 8.2.2. Automotive
- 8.2.3. Residential
- 8.2.4. Industries
- 8.1. Market Analysis, Insights and Forecast - by Type
- 9. Europe US Natural Gas Market Analysis, Insights and Forecast, 2020-2032
- 9.1. Market Analysis, Insights and Forecast - by Type
- 9.1.1. Wet Natural Gas
- 9.1.2. Dry Natural Gas
- 9.2. Market Analysis, Insights and Forecast - by End Use
- 9.2.1. Power Generation
- 9.2.2. Automotive
- 9.2.3. Residential
- 9.2.4. Industries
- 9.1. Market Analysis, Insights and Forecast - by Type
- 10. Middle East & Africa US Natural Gas Market Analysis, Insights and Forecast, 2020-2032
- 10.1. Market Analysis, Insights and Forecast - by Type
- 10.1.1. Wet Natural Gas
- 10.1.2. Dry Natural Gas
- 10.2. Market Analysis, Insights and Forecast - by End Use
- 10.2.1. Power Generation
- 10.2.2. Automotive
- 10.2.3. Residential
- 10.2.4. Industries
- 10.1. Market Analysis, Insights and Forecast - by Type
- 11. Asia Pacific US Natural Gas Market Analysis, Insights and Forecast, 2020-2032
- 11.1. Market Analysis, Insights and Forecast - by Type
- 11.1.1. Wet Natural Gas
- 11.1.2. Dry Natural Gas
- 11.2. Market Analysis, Insights and Forecast - by End Use
- 11.2.1. Power Generation
- 11.2.2. Automotive
- 11.2.3. Residential
- 11.2.4. Industries
- 11.1. Market Analysis, Insights and Forecast - by Type
- 12. Competitive Analysis
- 12.1. Company Profiles
- 12.1.1 Occidental Petroleum Corporation
- 12.1.1.1. Company Overview
- 12.1.1.2. Products
- 12.1.1.3. Company Financials
- 12.1.1.4. SWOT Analysis
- 12.1.2 Shell PLC
- 12.1.2.1. Company Overview
- 12.1.2.2. Products
- 12.1.2.3. Company Financials
- 12.1.2.4. SWOT Analysis
- 12.1.3 ExxonMobil Corporation
- 12.1.3.1. Company Overview
- 12.1.3.2. Products
- 12.1.3.3. Company Financials
- 12.1.3.4. SWOT Analysis
- 12.1.4 Marathon Petroleum Corporation
- 12.1.4.1. Company Overview
- 12.1.4.2. Products
- 12.1.4.3. Company Financials
- 12.1.4.4. SWOT Analysis
- 12.1.5 Hess Corporation*List Not Exhaustive
- 12.1.5.1. Company Overview
- 12.1.5.2. Products
- 12.1.5.3. Company Financials
- 12.1.5.4. SWOT Analysis
- 12.1.6 ConocoPhillips
- 12.1.6.1. Company Overview
- 12.1.6.2. Products
- 12.1.6.3. Company Financials
- 12.1.6.4. SWOT Analysis
- 12.1.7 Chevron Corporation
- 12.1.7.1. Company Overview
- 12.1.7.2. Products
- 12.1.7.3. Company Financials
- 12.1.7.4. SWOT Analysis
- 12.1.8 TotalEnergies SE
- 12.1.8.1. Company Overview
- 12.1.8.2. Products
- 12.1.8.3. Company Financials
- 12.1.8.4. SWOT Analysis
- 12.1.9 Phillips
- 12.1.9.1. Company Overview
- 12.1.9.2. Products
- 12.1.9.3. Company Financials
- 12.1.9.4. SWOT Analysis
- 12.1.10 EOG Resources Inc
- 12.1.10.1. Company Overview
- 12.1.10.2. Products
- 12.1.10.3. Company Financials
- 12.1.10.4. SWOT Analysis
- 12.1.1 Occidental Petroleum Corporation
- 12.2. Market Entropy
- 12.2.1 Company's Key Areas Served
- 12.2.2 Recent Developments
- 12.3. Company Market Share Analysis 2025
- 12.3.1 Top 5 Companies Market Share Analysis
- 12.3.2 Top 3 Companies Market Share Analysis
- 12.4. List of Potential Customers
- 13. Research Methodology
List of Figures
- Figure 1: Global US Natural Gas Market Revenue Breakdown (billion, %) by Region 2025 & 2033
- Figure 2: Global US Natural Gas Market Volume Breakdown (Tonnes, %) by Region 2025 & 2033
- Figure 3: North America US Natural Gas Market Revenue (billion), by Type 2025 & 2033
- Figure 4: North America US Natural Gas Market Volume (Tonnes), by Type 2025 & 2033
- Figure 5: North America US Natural Gas Market Revenue Share (%), by Type 2025 & 2033
- Figure 6: North America US Natural Gas Market Volume Share (%), by Type 2025 & 2033
- Figure 7: North America US Natural Gas Market Revenue (billion), by End Use 2025 & 2033
- Figure 8: North America US Natural Gas Market Volume (Tonnes), by End Use 2025 & 2033
- Figure 9: North America US Natural Gas Market Revenue Share (%), by End Use 2025 & 2033
- Figure 10: North America US Natural Gas Market Volume Share (%), by End Use 2025 & 2033
- Figure 11: North America US Natural Gas Market Revenue (billion), by Country 2025 & 2033
- Figure 12: North America US Natural Gas Market Volume (Tonnes), by Country 2025 & 2033
- Figure 13: North America US Natural Gas Market Revenue Share (%), by Country 2025 & 2033
- Figure 14: North America US Natural Gas Market Volume Share (%), by Country 2025 & 2033
- Figure 15: South America US Natural Gas Market Revenue (billion), by Type 2025 & 2033
- Figure 16: South America US Natural Gas Market Volume (Tonnes), by Type 2025 & 2033
- Figure 17: South America US Natural Gas Market Revenue Share (%), by Type 2025 & 2033
- Figure 18: South America US Natural Gas Market Volume Share (%), by Type 2025 & 2033
- Figure 19: South America US Natural Gas Market Revenue (billion), by End Use 2025 & 2033
- Figure 20: South America US Natural Gas Market Volume (Tonnes), by End Use 2025 & 2033
- Figure 21: South America US Natural Gas Market Revenue Share (%), by End Use 2025 & 2033
- Figure 22: South America US Natural Gas Market Volume Share (%), by End Use 2025 & 2033
- Figure 23: South America US Natural Gas Market Revenue (billion), by Country 2025 & 2033
- Figure 24: South America US Natural Gas Market Volume (Tonnes), by Country 2025 & 2033
- Figure 25: South America US Natural Gas Market Revenue Share (%), by Country 2025 & 2033
- Figure 26: South America US Natural Gas Market Volume Share (%), by Country 2025 & 2033
- Figure 27: Europe US Natural Gas Market Revenue (billion), by Type 2025 & 2033
- Figure 28: Europe US Natural Gas Market Volume (Tonnes), by Type 2025 & 2033
- Figure 29: Europe US Natural Gas Market Revenue Share (%), by Type 2025 & 2033
- Figure 30: Europe US Natural Gas Market Volume Share (%), by Type 2025 & 2033
- Figure 31: Europe US Natural Gas Market Revenue (billion), by End Use 2025 & 2033
- Figure 32: Europe US Natural Gas Market Volume (Tonnes), by End Use 2025 & 2033
- Figure 33: Europe US Natural Gas Market Revenue Share (%), by End Use 2025 & 2033
- Figure 34: Europe US Natural Gas Market Volume Share (%), by End Use 2025 & 2033
- Figure 35: Europe US Natural Gas Market Revenue (billion), by Country 2025 & 2033
- Figure 36: Europe US Natural Gas Market Volume (Tonnes), by Country 2025 & 2033
- Figure 37: Europe US Natural Gas Market Revenue Share (%), by Country 2025 & 2033
- Figure 38: Europe US Natural Gas Market Volume Share (%), by Country 2025 & 2033
- Figure 39: Middle East & Africa US Natural Gas Market Revenue (billion), by Type 2025 & 2033
- Figure 40: Middle East & Africa US Natural Gas Market Volume (Tonnes), by Type 2025 & 2033
- Figure 41: Middle East & Africa US Natural Gas Market Revenue Share (%), by Type 2025 & 2033
- Figure 42: Middle East & Africa US Natural Gas Market Volume Share (%), by Type 2025 & 2033
- Figure 43: Middle East & Africa US Natural Gas Market Revenue (billion), by End Use 2025 & 2033
- Figure 44: Middle East & Africa US Natural Gas Market Volume (Tonnes), by End Use 2025 & 2033
- Figure 45: Middle East & Africa US Natural Gas Market Revenue Share (%), by End Use 2025 & 2033
- Figure 46: Middle East & Africa US Natural Gas Market Volume Share (%), by End Use 2025 & 2033
- Figure 47: Middle East & Africa US Natural Gas Market Revenue (billion), by Country 2025 & 2033
- Figure 48: Middle East & Africa US Natural Gas Market Volume (Tonnes), by Country 2025 & 2033
- Figure 49: Middle East & Africa US Natural Gas Market Revenue Share (%), by Country 2025 & 2033
- Figure 50: Middle East & Africa US Natural Gas Market Volume Share (%), by Country 2025 & 2033
- Figure 51: Asia Pacific US Natural Gas Market Revenue (billion), by Type 2025 & 2033
- Figure 52: Asia Pacific US Natural Gas Market Volume (Tonnes), by Type 2025 & 2033
- Figure 53: Asia Pacific US Natural Gas Market Revenue Share (%), by Type 2025 & 2033
- Figure 54: Asia Pacific US Natural Gas Market Volume Share (%), by Type 2025 & 2033
- Figure 55: Asia Pacific US Natural Gas Market Revenue (billion), by End Use 2025 & 2033
- Figure 56: Asia Pacific US Natural Gas Market Volume (Tonnes), by End Use 2025 & 2033
- Figure 57: Asia Pacific US Natural Gas Market Revenue Share (%), by End Use 2025 & 2033
- Figure 58: Asia Pacific US Natural Gas Market Volume Share (%), by End Use 2025 & 2033
- Figure 59: Asia Pacific US Natural Gas Market Revenue (billion), by Country 2025 & 2033
- Figure 60: Asia Pacific US Natural Gas Market Volume (Tonnes), by Country 2025 & 2033
- Figure 61: Asia Pacific US Natural Gas Market Revenue Share (%), by Country 2025 & 2033
- Figure 62: Asia Pacific US Natural Gas Market Volume Share (%), by Country 2025 & 2033
List of Tables
- Table 1: Global US Natural Gas Market Revenue billion Forecast, by Type 2020 & 2033
- Table 2: Global US Natural Gas Market Volume Tonnes Forecast, by Type 2020 & 2033
- Table 3: Global US Natural Gas Market Revenue billion Forecast, by End Use 2020 & 2033
- Table 4: Global US Natural Gas Market Volume Tonnes Forecast, by End Use 2020 & 2033
- Table 5: Global US Natural Gas Market Revenue billion Forecast, by Region 2020 & 2033
- Table 6: Global US Natural Gas Market Volume Tonnes Forecast, by Region 2020 & 2033
- Table 7: Global US Natural Gas Market Revenue billion Forecast, by Type 2020 & 2033
- Table 8: Global US Natural Gas Market Volume Tonnes Forecast, by Type 2020 & 2033
- Table 9: Global US Natural Gas Market Revenue billion Forecast, by End Use 2020 & 2033
- Table 10: Global US Natural Gas Market Volume Tonnes Forecast, by End Use 2020 & 2033
- Table 11: Global US Natural Gas Market Revenue billion Forecast, by Country 2020 & 2033
- Table 12: Global US Natural Gas Market Volume Tonnes Forecast, by Country 2020 & 2033
- Table 13: United States US Natural Gas Market Revenue (billion) Forecast, by Application 2020 & 2033
- Table 14: United States US Natural Gas Market Volume (Tonnes) Forecast, by Application 2020 & 2033
- Table 15: Canada US Natural Gas Market Revenue (billion) Forecast, by Application 2020 & 2033
- Table 16: Canada US Natural Gas Market Volume (Tonnes) Forecast, by Application 2020 & 2033
- Table 17: Mexico US Natural Gas Market Revenue (billion) Forecast, by Application 2020 & 2033
- Table 18: Mexico US Natural Gas Market Volume (Tonnes) Forecast, by Application 2020 & 2033
- Table 19: Global US Natural Gas Market Revenue billion Forecast, by Type 2020 & 2033
- Table 20: Global US Natural Gas Market Volume Tonnes Forecast, by Type 2020 & 2033
- Table 21: Global US Natural Gas Market Revenue billion Forecast, by End Use 2020 & 2033
- Table 22: Global US Natural Gas Market Volume Tonnes Forecast, by End Use 2020 & 2033
- Table 23: Global US Natural Gas Market Revenue billion Forecast, by Country 2020 & 2033
- Table 24: Global US Natural Gas Market Volume Tonnes Forecast, by Country 2020 & 2033
- Table 25: Brazil US Natural Gas Market Revenue (billion) Forecast, by Application 2020 & 2033
- Table 26: Brazil US Natural Gas Market Volume (Tonnes) Forecast, by Application 2020 & 2033
- Table 27: Argentina US Natural Gas Market Revenue (billion) Forecast, by Application 2020 & 2033
- Table 28: Argentina US Natural Gas Market Volume (Tonnes) Forecast, by Application 2020 & 2033
- Table 29: Rest of South America US Natural Gas Market Revenue (billion) Forecast, by Application 2020 & 2033
- Table 30: Rest of South America US Natural Gas Market Volume (Tonnes) Forecast, by Application 2020 & 2033
- Table 31: Global US Natural Gas Market Revenue billion Forecast, by Type 2020 & 2033
- Table 32: Global US Natural Gas Market Volume Tonnes Forecast, by Type 2020 & 2033
- Table 33: Global US Natural Gas Market Revenue billion Forecast, by End Use 2020 & 2033
- Table 34: Global US Natural Gas Market Volume Tonnes Forecast, by End Use 2020 & 2033
- Table 35: Global US Natural Gas Market Revenue billion Forecast, by Country 2020 & 2033
- Table 36: Global US Natural Gas Market Volume Tonnes Forecast, by Country 2020 & 2033
- Table 37: United Kingdom US Natural Gas Market Revenue (billion) Forecast, by Application 2020 & 2033
- Table 38: United Kingdom US Natural Gas Market Volume (Tonnes) Forecast, by Application 2020 & 2033
- Table 39: Germany US Natural Gas Market Revenue (billion) Forecast, by Application 2020 & 2033
- Table 40: Germany US Natural Gas Market Volume (Tonnes) Forecast, by Application 2020 & 2033
- Table 41: France US Natural Gas Market Revenue (billion) Forecast, by Application 2020 & 2033
- Table 42: France US Natural Gas Market Volume (Tonnes) Forecast, by Application 2020 & 2033
- Table 43: Italy US Natural Gas Market Revenue (billion) Forecast, by Application 2020 & 2033
- Table 44: Italy US Natural Gas Market Volume (Tonnes) Forecast, by Application 2020 & 2033
- Table 45: Spain US Natural Gas Market Revenue (billion) Forecast, by Application 2020 & 2033
- Table 46: Spain US Natural Gas Market Volume (Tonnes) Forecast, by Application 2020 & 2033
- Table 47: Russia US Natural Gas Market Revenue (billion) Forecast, by Application 2020 & 2033
- Table 48: Russia US Natural Gas Market Volume (Tonnes) Forecast, by Application 2020 & 2033
- Table 49: Benelux US Natural Gas Market Revenue (billion) Forecast, by Application 2020 & 2033
- Table 50: Benelux US Natural Gas Market Volume (Tonnes) Forecast, by Application 2020 & 2033
- Table 51: Nordics US Natural Gas Market Revenue (billion) Forecast, by Application 2020 & 2033
- Table 52: Nordics US Natural Gas Market Volume (Tonnes) Forecast, by Application 2020 & 2033
- Table 53: Rest of Europe US Natural Gas Market Revenue (billion) Forecast, by Application 2020 & 2033
- Table 54: Rest of Europe US Natural Gas Market Volume (Tonnes) Forecast, by Application 2020 & 2033
- Table 55: Global US Natural Gas Market Revenue billion Forecast, by Type 2020 & 2033
- Table 56: Global US Natural Gas Market Volume Tonnes Forecast, by Type 2020 & 2033
- Table 57: Global US Natural Gas Market Revenue billion Forecast, by End Use 2020 & 2033
- Table 58: Global US Natural Gas Market Volume Tonnes Forecast, by End Use 2020 & 2033
- Table 59: Global US Natural Gas Market Revenue billion Forecast, by Country 2020 & 2033
- Table 60: Global US Natural Gas Market Volume Tonnes Forecast, by Country 2020 & 2033
- Table 61: Turkey US Natural Gas Market Revenue (billion) Forecast, by Application 2020 & 2033
- Table 62: Turkey US Natural Gas Market Volume (Tonnes) Forecast, by Application 2020 & 2033
- Table 63: Israel US Natural Gas Market Revenue (billion) Forecast, by Application 2020 & 2033
- Table 64: Israel US Natural Gas Market Volume (Tonnes) Forecast, by Application 2020 & 2033
- Table 65: GCC US Natural Gas Market Revenue (billion) Forecast, by Application 2020 & 2033
- Table 66: GCC US Natural Gas Market Volume (Tonnes) Forecast, by Application 2020 & 2033
- Table 67: North Africa US Natural Gas Market Revenue (billion) Forecast, by Application 2020 & 2033
- Table 68: North Africa US Natural Gas Market Volume (Tonnes) Forecast, by Application 2020 & 2033
- Table 69: South Africa US Natural Gas Market Revenue (billion) Forecast, by Application 2020 & 2033
- Table 70: South Africa US Natural Gas Market Volume (Tonnes) Forecast, by Application 2020 & 2033
- Table 71: Rest of Middle East & Africa US Natural Gas Market Revenue (billion) Forecast, by Application 2020 & 2033
- Table 72: Rest of Middle East & Africa US Natural Gas Market Volume (Tonnes) Forecast, by Application 2020 & 2033
- Table 73: Global US Natural Gas Market Revenue billion Forecast, by Type 2020 & 2033
- Table 74: Global US Natural Gas Market Volume Tonnes Forecast, by Type 2020 & 2033
- Table 75: Global US Natural Gas Market Revenue billion Forecast, by End Use 2020 & 2033
- Table 76: Global US Natural Gas Market Volume Tonnes Forecast, by End Use 2020 & 2033
- Table 77: Global US Natural Gas Market Revenue billion Forecast, by Country 2020 & 2033
- Table 78: Global US Natural Gas Market Volume Tonnes Forecast, by Country 2020 & 2033
- Table 79: China US Natural Gas Market Revenue (billion) Forecast, by Application 2020 & 2033
- Table 80: China US Natural Gas Market Volume (Tonnes) Forecast, by Application 2020 & 2033
- Table 81: India US Natural Gas Market Revenue (billion) Forecast, by Application 2020 & 2033
- Table 82: India US Natural Gas Market Volume (Tonnes) Forecast, by Application 2020 & 2033
- Table 83: Japan US Natural Gas Market Revenue (billion) Forecast, by Application 2020 & 2033
- Table 84: Japan US Natural Gas Market Volume (Tonnes) Forecast, by Application 2020 & 2033
- Table 85: South Korea US Natural Gas Market Revenue (billion) Forecast, by Application 2020 & 2033
- Table 86: South Korea US Natural Gas Market Volume (Tonnes) Forecast, by Application 2020 & 2033
- Table 87: ASEAN US Natural Gas Market Revenue (billion) Forecast, by Application 2020 & 2033
- Table 88: ASEAN US Natural Gas Market Volume (Tonnes) Forecast, by Application 2020 & 2033
- Table 89: Oceania US Natural Gas Market Revenue (billion) Forecast, by Application 2020 & 2033
- Table 90: Oceania US Natural Gas Market Volume (Tonnes) Forecast, by Application 2020 & 2033
- Table 91: Rest of Asia Pacific US Natural Gas Market Revenue (billion) Forecast, by Application 2020 & 2033
- Table 92: Rest of Asia Pacific US Natural Gas Market Volume (Tonnes) Forecast, by Application 2020 & 2033
Frequently Asked Questions
1. What is the projected Compound Annual Growth Rate (CAGR) of the US Natural Gas Market?
The projected CAGR is approximately 3.5%.
2. Which companies are prominent players in the US Natural Gas Market?
Key companies in the market include Occidental Petroleum Corporation, Shell PLC, ExxonMobil Corporation, Marathon Petroleum Corporation, Hess Corporation*List Not Exhaustive, ConocoPhillips, Chevron Corporation, TotalEnergies SE, Phillips, EOG Resources Inc.
3. What are the main segments of the US Natural Gas Market?
The market segments include Type, End Use.
4. Can you provide details about the market size?
The market size is estimated to be USD 473.4 billion as of 2022.
5. What are some drivers contributing to market growth?
Increasing Global Demand for Refined Petroleum Products4.; Economic Growth and Industrialization.
6. What are the notable trends driving market growth?
Power Generation Segment to Dominate the Market.
7. Are there any restraints impacting market growth?
Environmental Concerns and Regulations.
8. Can you provide examples of recent developments in the market?
May 2022: According to the US Energy Information Administration, the Natural Gas Pipeline Project Tracker was updated with recent approvals and completions of pipeline projects. As of the end of the first quarter of 2022, the Federal Energy Regulatory Commission (FERC) approved three projects to increase the export of US natural gas by pipeline and LNG. FERC approved two projects connecting LNG terminals in Louisiana. The Evangeline Pass Expansion Project, owned by Tennessee Gas Pipeline Company, is 1.1 billion cubic feet in size. It is intended that the proposed Plaquemines LNG Project in Plaquemines Parish, Louisiana, be supplied with natural gas by constructing 13.1 miles of new pipeline and two new compressor stations.
9. What pricing options are available for accessing the report?
Pricing options include single-user, multi-user, and enterprise licenses priced at USD 3800, USD 4500, and USD 5800 respectively.
10. Is the market size provided in terms of value or volume?
The market size is provided in terms of value, measured in billion and volume, measured in Tonnes.
11. Are there any specific market keywords associated with the report?
Yes, the market keyword associated with the report is "US Natural Gas Market," which aids in identifying and referencing the specific market segment covered.
12. How do I determine which pricing option suits my needs best?
The pricing options vary based on user requirements and access needs. Individual users may opt for single-user licenses, while businesses requiring broader access may choose multi-user or enterprise licenses for cost-effective access to the report.
13. Are there any additional resources or data provided in the US Natural Gas Market report?
While the report offers comprehensive insights, it's advisable to review the specific contents or supplementary materials provided to ascertain if additional resources or data are available.
14. How can I stay updated on further developments or reports in the US Natural Gas Market?
To stay informed about further developments, trends, and reports in the US Natural Gas Market, consider subscribing to industry newsletters, following relevant companies and organizations, or regularly checking reputable industry news sources and publications.
Methodology
Step 1 - Identification of Relevant Samples Size from Population Database


Step 2 - Approaches for Defining Global Market Size (Value, Volume* & Price*)

Note*: In applicable scenarios
Step 3 - Data Sources
Primary Research
- Web Analytics
- Survey Reports
- Research Institute
- Latest Research Reports
- Opinion Leaders
Secondary Research
- Annual Reports
- White Paper
- Latest Press Release
- Industry Association
- Paid Database
- Investor Presentations

Step 4 - Data Triangulation
Involves using different sources of information in order to increase the validity of a study
These sources are likely to be stakeholders in a program - participants, other researchers, program staff, other community members, and so on.
Then we put all data in single framework & apply various statistical tools to find out the dynamic on the market.
During the analysis stage, feedback from the stakeholder groups would be compared to determine areas of agreement as well as areas of divergence